Copyright © [year] UK Data Service. Created by [Organisation], [Institution]
Power Pivot and Excel dynamic arrays
Peter Smyth
CMI
CMI Webinar series
19
th
May 2020

Overview of Seminar
Excel power Pivot
Background & Availability
The data model
Demonstrations
Loading a JSON dataset (Tweets)
Manipulating a 246M row dataset (UKDS SN 7591)
Excel Dynamic Arrays
What are they
Demo of some of the new Functions
Length : up to 1h 15mins + question time

Overview of Seminar
This is a coding FREE Webinar
Both of the Power Pivot demonstrations today could be done by writing
programming code in Python or R or any other language, but today we are
going to let the mouse do most of the work for us.
The Dynamic Arrays demo does, as you would expect make use of Excel
formulae.

Power Pivot Background and availability
Power Pivot used to be only available as an Excel add-in
Now available on most versions of Excel
Has its own item 'Power Pivot' in the menu bar.
Works with Power Query and Power View which are now all integrated into
Excel
Can be used to :
perform powerful data analysis
create complex data models.
process large amounts of data (much more than 1M rows)
Import a variety of file types

Power Pivot The Data Model
A collection of tables with relationships
An analytical database inside the Excel workbook with its own set of
features and functions to aid Data Analysis
Power Pivot supports files up to 2GB in size and enables you to work with up
to 4GB of data in memory
The data in the data model is stored in a highly compressed form.

Power Pivot JSON Demonstration
In this demonstration we are going to take a file containing 100 Tweets downloaded using the Twitter
API and load the bits of the Tweets of interest into an Excel spreadsheet.
Before we start, a bit about JSON
Designed for application <-> application communication but is human-readable
Extensively used by APIs (Application Programming Interfaces)
Many tools to make it more readable by Humans e.g. JSON Editor and addins to the popular browsers

An example of simple JSON
This JSON file has been created by converting a csv file
You can always convert a csv file into JSON

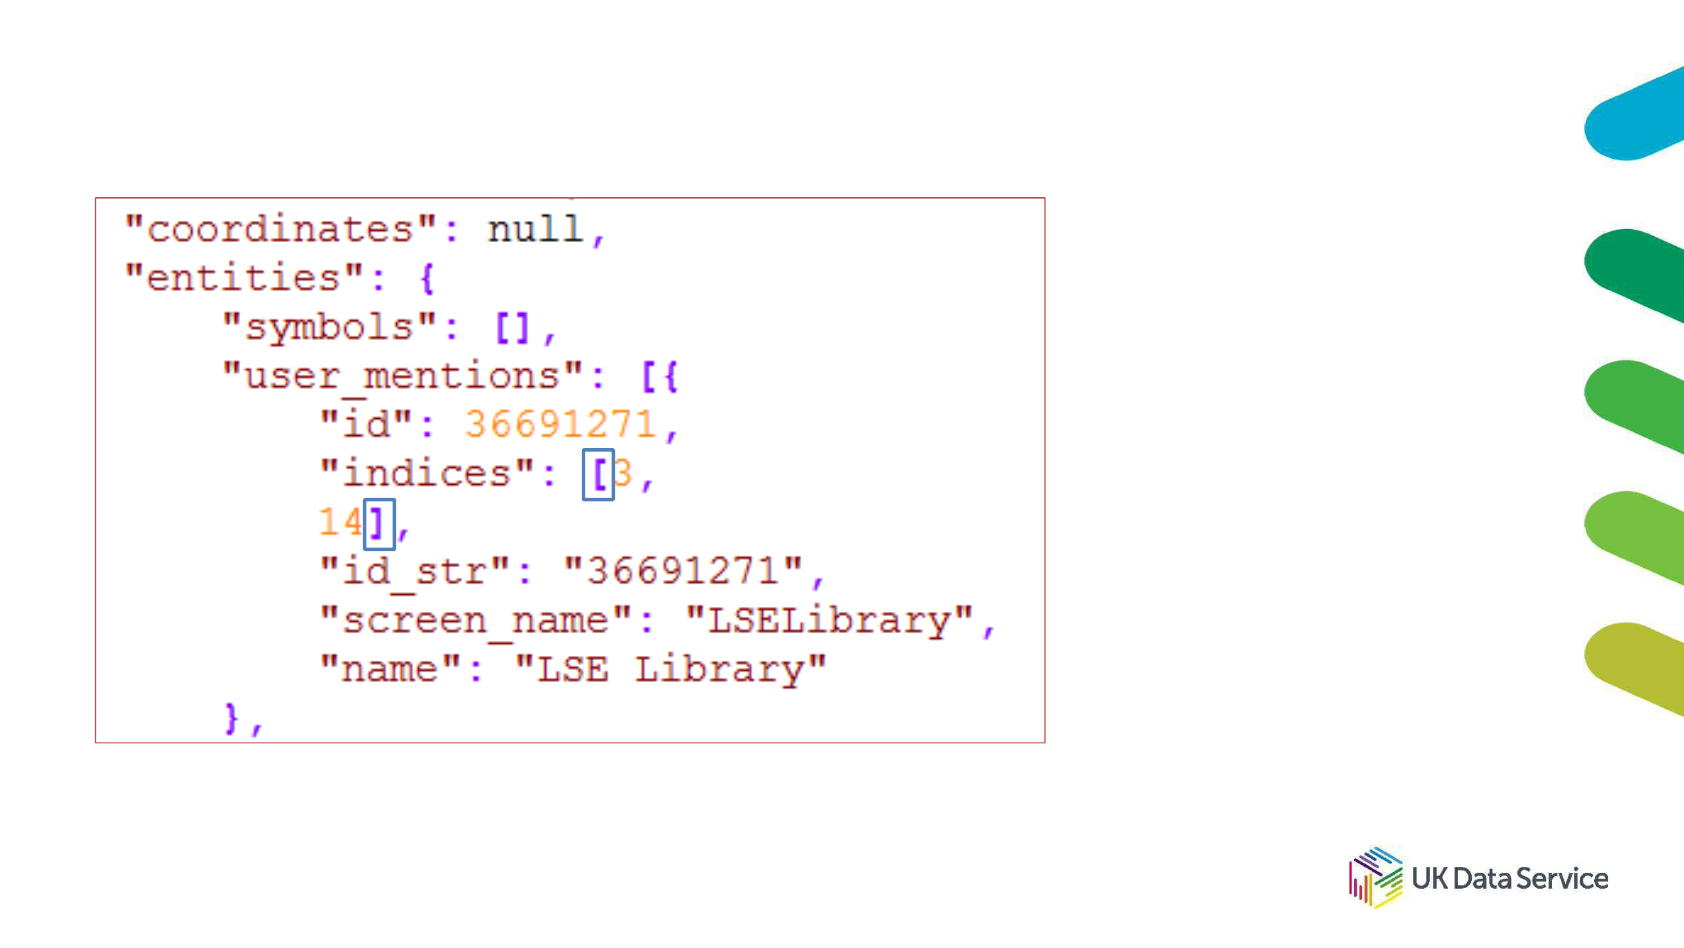
An example of complex JSON
This JSON is a very small part returned from a Twitter API call.
The nested structures {} can be accommodated by using a . notation in the column name. So the
id_str element could have a column name of entities.user_mentions.id_str.

An example of complex JSON
The [] symbols represents an array or list of items which are normally referenced by an index
number. You cannot easily flatten these into a simple table. In a relational model, you would separate
these out into a table by themselves and create a relationship between it
and the main table.

Relational Table and JSON terms
Relational tables and JSON use different terms to refer to similar items of data
A table in referred to as a collection in JSON
A row of a table equates to a document in JSON
A column in a table is referred to as a field in JSON
In the demo we are going to take a collection of JSON documents which have individual fields in them
and create a single table with rows and columns in it.

Loading a JSON Dataset (Tweets)
DEMO

Manipulating a 246M row dataset
In this demonstration we will manipulate a 246M row dataset.
The original dataset is 7,165,636Kb
When loading into the Excel data model the Excel filesize is
650,533Kb

Manipulating a 246M row dataset
The Steps
1. Load the edrp_gas file
2. Create new columns for Month and Year
3. Group the dataset by Anon_Id, Month and Year
4. Load the Geography file
5. Create relationship between the edrp_gas table and the Geography table
6. Create pivot table in Excel
7. Add the Months table into the model
8. Create a relationship between the Months table and the edrp_gas table
9. Modify the Months table in the data model using the sort by column feature
10.Redo the Pivot table and Pivot chart.
11.Add slicers to create a small dashboard.

Manipulating a 246M row dataset
Because of the time taken to perform the first three steps
we will actually start the live demo from step 4.

Edrp_gas

Edrp_gas with added columns

Edrp_gas The Group By screen

Manipulating a 246M row dataset
Demo

Excel Dynamic Arrays
Now a not so new feature of Excel, in most of the versions
Allows a function to return more than a single cell response
Used to have to use "Ctrl-Shift-Enter" and {} to enter arrays, not now!
Now some new functions are available
Some older functions behave differently
There are new easy ways to access or reference the dynamic arrays created

Excel Dynamic Arrays
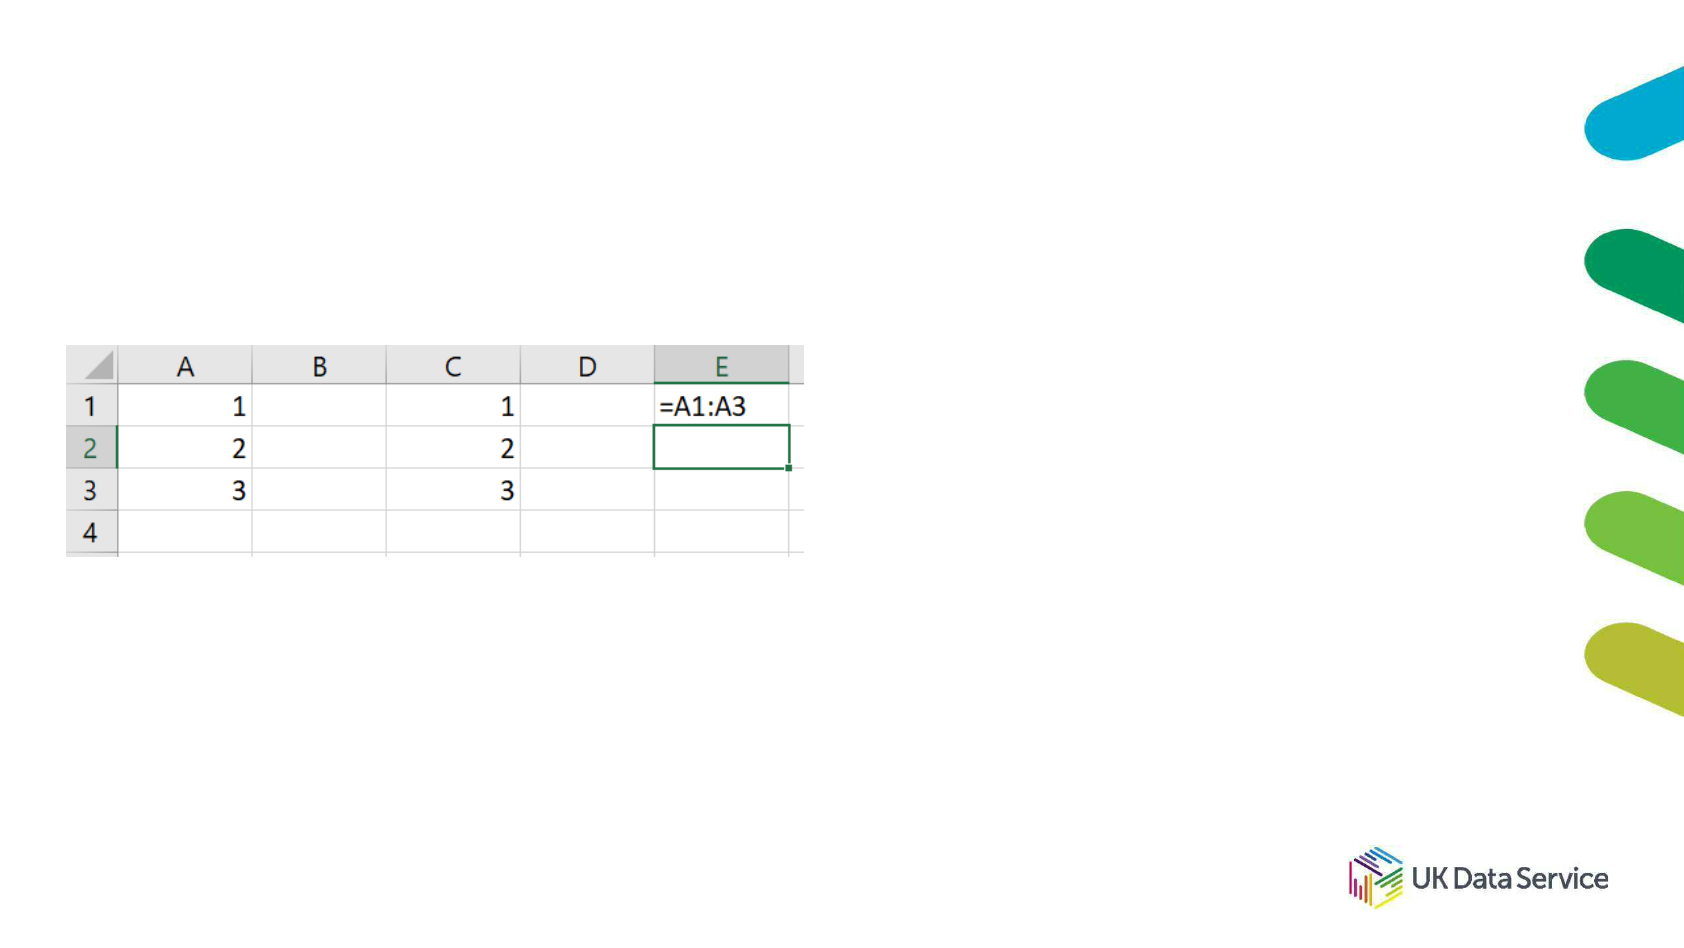
How do I know if I have them?
Type in the formula =A1:A3
If you only get the answer of 1 in cell C1 then you dont.
Alternatively you could just try search for one of the new functions such as unique.

Excel Dynamic Arrays The new functions
There are 6 new functions
FILTER function
RANDARRAY function
SEQUENCE function
SORT function
SORTBY function
UNIQUE function
We will look at some of them in the demo.

Excel Dynamic Arrays
Demo

Additional Info
Excel Dynamic Arrays
https://support.microsoft.com/en-us/office/dynamic-array-formulas-and-spilled-array-behavior-205c6b06-
03ba-4151-89a1-87a7eb36e531
Power Pivot
https://support.office.com/en-gb/article/Power-Pivot-Powerful-data-analysis-and-data-modeling-in-Excel-
A9C2C6E2-CC49-4976-A7D7-40896795D045
https://support.office.com/en-us/article/get-transform-and-power-pivot-in-excel-42d895c2-d1d7-41d0-88da-
d1ed7ecc102d

Questions
Peter Smyth
Peter.smyth@Manchester.ac.uk
