
Monthly Statistical Report
To:
From:
Copies:
Subject:
Date:
Jesus Saenz, Director of Airports
Jacob Tyler, Air Service Development Manager
San Antonio Regional Stakeholders
January 2024 Monthly Statistics
February 22, 2024
Record Breaking Months Continue into 2024
SUMMARY
In January 2024, the airport’s passenger numbers reached 789,684. SAT once again broke a
monthly passenger record with this January being the busiest in the airport’s history. The
previous record was set in January 2019. 2023 was officially the busiest year in the airport’s
history with nearly 10.7 million passengers flying through the two terminals. This busy trend has
continued with January 2024 being the ninth record-breaking month in a row for SAT.
Comparing the numbers
to the year prior, the airport experienced a significant 7%
increase
of passengers.
Airlines continue to add capacity to the San Antonio market. Several airlines flew more seats to
San Antonio this month than the same month in 2023. The airlines with the largest increases in
service included American Airlines (AA), Alaska Airlines (AS), Delta Air Lines (DL), Spirit
Airlines (NK), United Airlines (UA), Viva Aerobus (VB), Southwest Airlines (WN), and Volaris
(Y4).
Spirit Airlines (NK) also added to their growing list of nonstop destinations during the month
of January. The airline launched new, seasonal service to Tampa (TPA) on January 11
th
.
This
new service compliments existing service to the popular Florida destination by
Southwest Airlines (WN).
Additionally, a total of 18,051,265 pounds of air cargo moved through SAT during the month of
January 2024. This is below levels seen during the same month in 2023. For more detailed
information see the included charts.

Upcoming Changes
• Spirit Airlines (NK) will launch new, daily service to Newark (EWR) starting on April
10
th
. This will bring SAT’s total daily departures to the New York City metro to 5
daily. Currently, Delta Air Lines (DL) and JetBlue Airways (B6) both offer daily
service to New York (JFK) while United Airlines (UA) operates twice daily service to
Newark (EWR).
• Hi
story will be made on May 17
th
as Condor Airlines (DE) launches San Antonio’s
first-ever nonstop service to Europe. Service to Frankfurt (FRA) will operate
seasonally until September 6
th
during this first season and will operate on Mondays,
Wednesdays, and Fridays.
• Vi
va Aerobus (VB) will launch nonstop service to Torreon (TRC) starting on June 1
st
wi
th two weekly frequencies on Tuesdays and Saturdays.
• New
nonstop service to Burbank (BUR) on Southwest Airlines (WN) begins on June
4
th
.
• Am
erican Airlines (AA) will launch daily service to Philadelphia (PHL) starting June
5
th
.

DOMESTIC PASSENGERS
For January 2024, total scheduled domestic capacity, or seats, were up nearly 13% compared
to 2023 levels. Additionally, total domestic passenger levels were also up compared to 2023 by
nearly 6%.
Several airlines flew more passengers during January 2024 than the same month in 2023
showing continued growth in our market. These include Alaska Airlines (AS), American Airlines
(AA), Delta Air Lines (DL), Spirit Airlines (WN), and Southwest Airlines (WN).
As a result of the temporary grounding of the Boeing 737 MAX 9, United Airlines (UA) had
several flights canceled from San Antonio during the month of January. This resulted in lower
passenger numbers than expected compared to the year prior.
The following domestic routes had more service this month than in January 2023:
• Alaska Airlines (AS) to Seattle (SEA)
• American Airlines (AA) to Charlotte (CLT), Chicago (ORD), Dallas-Ft. Worth (DFW),
Miami (MIA), and Phoenix (PHX)
• Delta Air Lines (DL) to Detroit (DTW), Los Angeles (LAX), New York (JFK) new –
served pre-pandemic, and Salt Lake City (SLC)
• Spirit Airlines (NK) to Ft. Lauderdale (FLL) new, Las Vegas (LAS), Los Angeles
(LAX) new, Orlando (MCO), and Tampa (TPA) new
• Southwest Airlines (WN) to Atlanta (ATL), Baltimore (BWI), Chicago (MDW), Dallas
(DAL), Denver (DEN), El Paso (ELP), Ft. Lauderdale (FLL) new – served pre-
pandemic, Houston (HOU), Kansas City (MCI) new – served pre-pandemic, Las
Vegas (LAS), Los Angeles (LAX), Nashville (BNA), Orlando (MCO), Phoenix (PHX),
San Diego (SAN), and St. Louis (STL)
• United Airlines (UA) to Chicago (ORD), Denver (DEN), Newark (EWR), and
Washington (IAD)

Destination Airport Code AS G4 AA DL F9 B6 NK WN SY UA
Atlanta, GA ATL X X X
Baltimore, MD BWI X
Boston, MA BOS X
Charlotte, NC CLT X
Chicago-Midway, IL MDW X
Chicago-O'Hare, IL ORD X X
Dallas/Ft. Worth, TX DFW X
Dallas-Love, TX DAL X
Denver, CO DEN X X X
Detroit, MI DTW X
El Paso, TX ELP X
Fort Lauderdale, FL, US FLL X X
Houston-Hobby, TX HOU X
Houston-Intercontinental, TX IAH X
Kansas City, MO MCI X
Las Vegas, NV LAS X X X
Los Angeles, CA LAX X X X X
Miami, FL MIA X
Minneapolis/St. Paul, MN MSP X
Nashville, TN BNA X
New Orleans, LA MSY X
New York-JFK, NY JFK X X
Newark, NJ EWR X
Oklahoma City, OK OKC X
Orlando, FL MCO X X X
Phoenix, AZ PHX X X
Salt Lake City, UT SLC X
San Diego, CA SAN X
San Francisco, CA SFO X
Seattle, WA SEA X
St. Louis, MO STL X
Tampa, FL TPA X X
Washington-Dulles, VA IAD
X
-54%
-5%
188%
12%
-60%
-14%
245%
4%
-
Southwest Airlines
Sun Country Airlines
NKSpirit Airlines
Airline Code
Delta Air Lines
Frontier Airlines
JetBlue Airways
Alaska Airlines
American Airlines
Allegiant Air
DL
F9
B6
WN
SY
5%
AS
AA
Domestic Traffic
January 2024 Statistics Report
Capacity
Passengers
Airline
Vs 2023
Vs 2023
5%
24%
19%
G4 -100% -100%
10%
14%
33 Domestic Destinations in January 2024
UAUnited Airlines -5%
-
13%
January 2024 Statistics Report
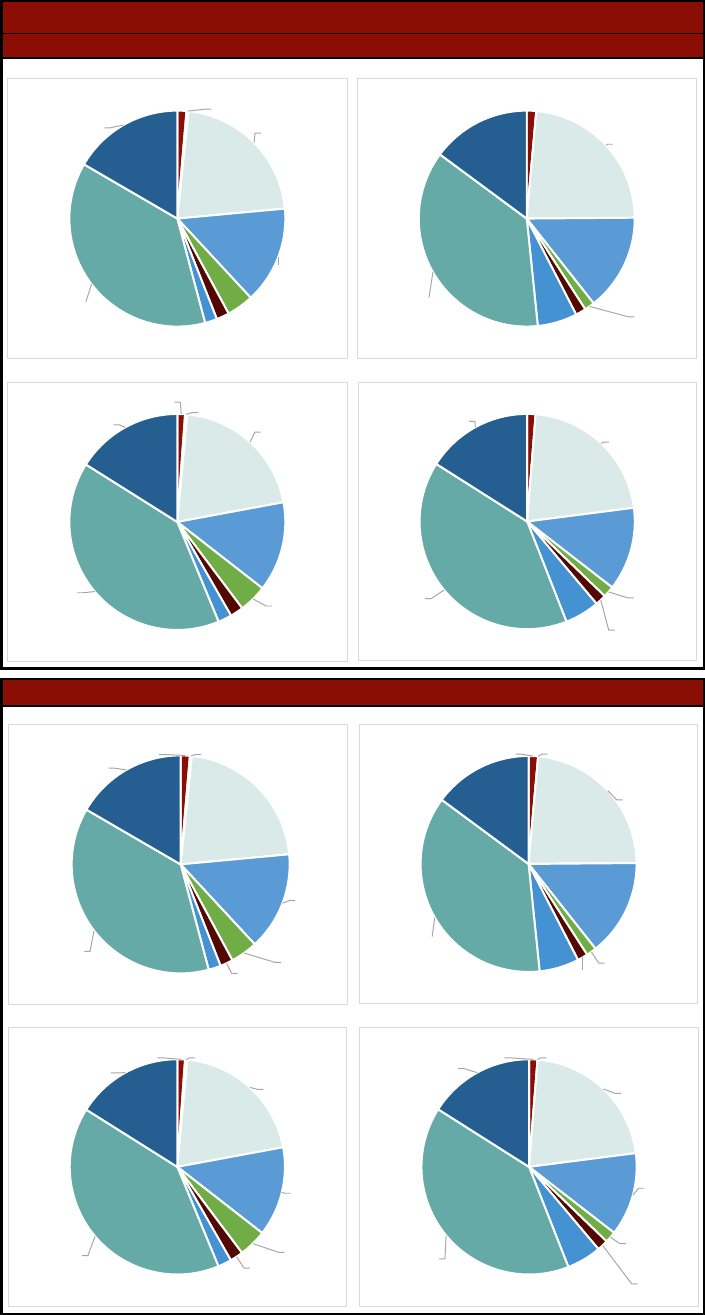
Domestic Market Share
Passengers Carried January 2023
Passengers Carried January 2024
Total Scheduled Seats January 2023
Total Scheduled Seats January 2024
Total Scheduled Seats YTD 2023
Total Scheduled Seats YTD 2024
Domestic Market Share
Passengers Carried YTD 2023
Passengers Carried YTD 2024
1.4% Alaska
0.3%
Allegiant
21.9%
American
14.6% Delta
4.0%
Frontier
37.5%
Southwest
16.6%
United
1.4% Alaska
23.5%
American
14.5% Delta
1.5%
Frontier
1.5%
JetBlue
5.9%
Spirit
36.8%
Southwest
14.9%
United
1.1% Alaska
0.3%
Allegiant
20.6%
American
13.5% Delta
4.2%
Frontier
2.0%
JetBlue
2.0%
Spirit
40.2%
Southwest
16.1%
United
1.3% Alaska
21.7%
American
12.5% Delta
1.7%
Frontier
1.7%
JetBlue
5.2%
Spirit
39.9%
Southwest
16.0%
United
1.4%
Alaska
0.3%
Allegiant
21.9%
American
14.6%
Delta
4.0%
Frontier
1.9%
JetBlue
1.8%
Spirit
37.5%
Southwest
16.6%
United
1.4%
Alaska
0.0%
Allegiant
23.5%
American
14.5%
Delta
1.5%
Frontier
1.5%
JetBlue
5.9%
Spirit
36.8%
Southwest
14.9%
United
1.1%
Alaska
0.3%
Allegiant
20.6%
American
13.5%
Delta
4.2%
Frontier
2.0%
JetBlue
2.0%
Spirit
40.2%
Southwest
16.1%
United
1.3%
Alaska
0.0%
Allegiant
21.7%
American
12.5%
Delta
1.7%
Frontier
1.7%
JetBlue
5.2%
Spirit
39.9%
Southwest
16.0%
United

INTERNATIONAL PASSENGERS
For January 2024, total scheduled international capacity, or seats, were up nearly 30%
compared to 2023 levels. Additionally, total international passenger levels were also up
compared to 2023 by nearly 16%.
SAT ranked #1 among all U.S. medium-hub airports in terms of total seats to Mexico for
January 2024. When looking at all U.S. airports, SAT ranked #15 between Detroit (DTW) and
Las Vegas (LAS). In terms of total international seats, SAT ranked #32 out of all 74 U.S. airports
that had international service during the month.
The following international routes had more service this month than in January 2023:
• Viva Aerobus (VB) to Leon/Guanajuato (BJX), Mexico City (MEX), Monterrey
(MTY), and Queretaro (QRO) new
• Vol
aris (Y4) to Guadalajara (GDL) and Mexico City (MEX)

Destination Airport Code
Cancun, Mexico CUN
Guadalajara, Mexico GDL
Leon/Guanjuato, Mexico BJX
Mexico City, Mexico MEX
Monterrey, Mexico MTY
Queretaro, Mexico QRO
-
27%
56%
X
X
X
X
X
X
VB
Y4
X
X
AM
WN
SY
5 International Destinations in October 2023
Volaris Y4
Aeromexico
VivaAerobus VB
Southwest Airlines WN -77%
Sun Country Airlines SY -
27%
30%
-10%
-75%
Vs 2023
Vs 2023
-4%AM
January 2024 Statistics Report
International Traffic
Passengers
Capacity
Airline
Airline Code

Total Scheduled January 2023
Total Scheduled January 2024
January 2024 Statistics Report
International Market Share
Passengers Carried January 2023
Passengers Carried January 2024
Total Scheduled Seats YTD 2023
Total Scheduled Seats YTD 2024
International Market Share
Passengers Carried YTD 2023
Passengers Carried YTD 2024
19.7%
Aeromexico
0.3%
Southwest
43.7%…
36.3%
Volaris
15.3%
Aeromexico
0.3%
Southwest
47.1%
VivaAerobus
37.3%
Volaris
24.3%
Aeromexico
40.7%
Viva
Aerobus
33.2%
Volaris
22.0%
Aeromexico
1.7%
Southwest
45.2%
Viva
Aerobus
31.1%
Volaris
19.7%
Aeromexico
0.3%
Southwest
43.7%
Viva Aerobus
36.3%
Volaris
15.3%
Aeromexico
0.3%
Southwest
47.1%
VivaAerobus
37.3%
Volaris
24.3%
Aeromexico
1.7%
S
outhwest
40.7%
V
iva
Aerobus
33.2%
Volaris
22.0%
Aeromexico
1.7%
Southwest
45.2%
Viva
Aerobus
31.1%
Volaris

2024 2023 % Change 2024 2023 % Change
Passengers
Domestic Enplanements 368,590 351,985 4.7% 368,590 351,985 4.7%
Domestic Deplanements 367,199 343,279 7.0% 367,199 343,279 7.0%
Total Domestic Passengers
735,789 695,264 5.8% 735,789 695,264 5.8%
International Enplanements 25,285 21,156 16.9% 25,285 21,156 19.5%
International Deplanements 28,610 24,708 22.3% 28,610 24,708 15.8%
Total International Passengers
53,895 45,864 17.5% 53,895 45,864 17.5%
Total All Passengers
789,684 741,128 6.6% 789,684 741,128 6.6%
Air Cargo (in pounds)
Domestic Freight Enplaned 5,446,252 5,850,349 -6.9% 5,446,252 5,850,349 -6.9%
Domestic Fright Deplaned 7,824,166 7,952,860 -1.6% 7,824,166 7,952,860 -1.6%
Total Domestic Freight
13,270,418 13,803,209 -3.9% 13,270,418 13,803,209 -3.9%
International Freight Enplaned 727,444 633,397 14.8% 727,444 633,397 14.8%
International Freight Deplaned 355,443 388,621 -8.5% 355,443 388,621 -8.5%
Total International Frieght
1,082,887 1,022,018 6.0% 1,082,887 1,022,018 6.0%
Total Freight
14,353,305 14,825,227 -3.2% 14,353,305 14,825,227 -3.2%
Mail Enplaned 1,606,496 1,701,611 -5.6% 1,606,496 1,701,611 -5.6%
Mail Deplaned 2,091,464 2,877,134 -27.3% 2,091,464 2,877,134 -27.3%
Total Mail
3,697,960 4,578,745 -19.2% 3,697,960 4,578,745 -19.2%
Grand Total All Air Cargo
18,051,265 19,403,972 -7.0% 18,051,265 19,403,972 -7.0%
January 2023 Statistics Report
Calendar Year-to-DateOctober
