
State Special Emphasis Report:
Instructions for Traumatic Brain Injury Data
U.S. Department of Health and Human Services
Centers for Disease Control and Prevention
National Center for Injury Prevention and Control
Division of Injury Response
Atlanta, Georgia
May 2012
State Injury Special Emphasis Report: Instructions for Preparing Traumatic Brain Injury Data is a publication of
the National Center for Injury Prevention and Control, Centers for Disease Control and Prevention.
Centers for Disease Control and Prevention
Thomas R. Frieden, MD, MPH
Director
National Center for Injury Prevention and Control
Linda Degutis, DrPH, MSN
Director
Division of Injury Response
Richard C. Hunt, MD, FACEP
Director
The ndings and conclusions in this report are those of the authors and do not necessarily represent the ofcial
position of the Centers for Disease Control and Prevention (CDC).
Suggested citation:
Jones CD, Thomas KE, Johnson RL. State injury special emphasis report: instructions for preparing traumatic
brain injury data. Atlanta (GA): Centers for Disease Control and Prevention, National Center for Injury
Prevention and Control; 2012.
Editors
Christopher D. Jones, PhD
Division of Injury Response
National Center for Injury Prevention and Control
Karen E. Thomas, MPH
Division of Injury Response
National Center for Injury Prevention and Control
Renee L. Johnson, RPT, MSPH
Division of Injury Response
National Center for Injury Prevention and Control
Acknowledgements
The editors wish to acknowledge the many years of Injury Indicator data submission by our state partners
which has enabled the continued advancement of the Injury Indicator reach to include this more in-depth
presentation of traumatic brain injury data. Also the editors extend a special thank-you to Kavitha Muthuswamy
and Kelly Sarmiento, both from the National Center for Injury Prevention and Control, for their creation of the
report template.
iv | State Special Emphasis Report: Instructions for Traumatic Brain Injury Data
FOREWORD
The National Center for Injury Prevention and Control (NCIPC) of the Centers for Disease Control and
Prevention (CDC) is pleased to provide this document to guide states in preparing a special emphasis report
on traumatic brain injury (TBI).
In a continued effort to expand TBI surveillance capacity through the Core Violence and Injury Prevention
Program, NCIPC expanded the Injury Indicators for the 2010 data year to include more details on the external
causes of injury for TBI-related deaths, hospitalizations, and emergency department (ED) visits. The TBI
Special Emphasis Report template is a tool produced by NCIPC for state health department injury and violence
prevention programs and their partners to facilitate use of the Injury Indicator TBI data and to move it into action.
The Special Emphasis Report is built upon the Injury Indicator consensus driven product and as such is in
alignment with the TBI Injury Indicators. This methodology is based on recommendations developed by working
groups representing the Safe States Alliance; the Council of State and Territorial Epidemiologists (CSTE); the
CDC and NCIPC; the Society for Advancement of Violence and Injury Research (SAVIR); and individual state
partners. States will need to be familiar with the State Injury Indicators: Instructions for Preparing 2010 Data
1
document and use it as a reference.
State Special Emphasis Report: Instructions for Traumatic Brain Injury Data | v
ABBREVIATIONS
CDC
Centers for Disease Control and Prevention
ED
Emergency Department
ICD-10
International Classication of Diseases – Tenth Revision
ICD-9-CM
International Classication of Diseases – Ninth Revision – Clinical Modication
NCHS
National Center for Health Statistics
NCIPC
National Center for Injury Prevention and Control
TBI
Traumatic Brain Injury
State Special Emphasis Report: Instructions for Traumatic Brain Injury Data | vii
CONTENTS
FOREWORD . . . . . . . . . . . . . . . . . . . . . . . . . . . . . . . . . . . . . . . . . . . . .iv
ABBREVIATIONS . . . . . . . . . . . . . . . . . . . . . . . . . . . . . . . . . . . . . . . . . . . v
BACKGROUND AND PURPOSE . . . . . . . . . . . . . . . . . . . . . . . . . . . . . . . . . . .1
METHODS . . . . . . . . . . . . . . . . . . . . . . . . . . . . . . . . . . . . . . . . . . . . . . .2
APPENDIX A: Special Emphasis Report: Traumatic Brain Injury template . . . . . . . . . . . .5
APPENDIX B: Instructions for using the
Special Emphasis Report: Traumatic Brain Injury template . . . . . . . . . . . . . . . . . . . 7
REFERENCES. . . . . . . . . . . . . . . . . . . . . . . . . . . . . . . . . . . . . . . . . . . . 14

State Special Emphasis Report: Instructions for Traumatic Brain Injury Data | 1
What is an Injury Special Emphasis Report?
Injury Special Emphasis Reports will be developed and used by state health department injury and
violence prevention programs and their partners to move injury data into action. They are intended to focus
on subsets of a state’s injury data in order to highlight the prevention needs related to specic causes or
population subgroups. The reports provide detailed information for the focus area. The unied content and
design of the reports result in the recognition and use of injury data.
BACKGROUND AND PURPOSE
In 2005, TBI surveillance was expanded by leveraging TBI funding with the funding for the Core Violence and
Injury Prevention Program to further support state health department surveillance capacity. Aligning the two
sources of surveillance funding resulted in an increase in the number of states funded to produce and submit
state-level TBI-related hospitalization and death data annually. Voluntary submission of data by states that
were not federally funded by the Core Violence and Injury Prevention Program was encouraged for inclusion in
the State Injury Indicators Report. By 2010, 30 states funded by CDC and 11 additional states submitted state-
level TBI data from death certicate and hospital discharge records for inclusion in the State Injury Indicators
Report. These periodic reports provided state-level rates of TBI-related deaths and hospitalizations by age
group and gender.
An internal evaluation of annual TBI reporting was conducted to provide information on how to improve the
format of the report and make it compatible with the goals and objectives of the new funding cycle, and to
recommend methods on how to increase TBI data dissemination. The evaluation found that annual TBI data
reporting has value on both state and national levels because state health departments were producing annual
TBI data reports and disseminating these data reports in their state. The evaluation recommended improving
the value of the reporting system by establishing clear guidance on reporting and developing a systematic
reporting process.
This manual provides straightforward information to encourage all states and U.S. territories, regardless of their
epidemiologic infrastructure and capabilities, to produce TBI data and to move it into action. Companion tools
will be provided to assist states in creating a brief, meaningful TBI data report.
2 | State Special Emphasis Report: Instructions for Traumatic Brain Injury Data
METHODS
Instructions for Creating and Using a TBI-Specific Vital Statistics Data Set
The TBI-specic death indicators should be calculated based on rst creating a TBI-related injury death subset.
This is done using the instructions for the TBI-related fatality indicator in the State Injury Indicators: Instructions
for Preparing 2010 Data
1
and outlined below:
▪
First, limit deaths to those with an injury underlying cause of death (V01–Y36, Y85–Y87, Y89, *U01–*U03).
▪
Then select deaths with any of the TBI ICD-10
2
codes in any eld of the multiple cause of death le:
• S01.0–S01.9, S02.0, S02.1, S02.3, S02.7–S02.9, S04.0, S06.0–S06.9, S07.0, S07.1, S07.8, S07.9,
S09.7–S09.9, T01.0, T02.0, T04.0, T06.0, T90.1, T90.2, T90.4, T90.5, T90.8, T90.9.
▪
The TBI-related injury fatalities indicator should be the same as the TBI indicator in the Overall State Injury
Indicator Death spreadsheet.
▪
For the other TBI-related indicators, use the underlying cause of death ICD-10 codes specied in the Injury
Indicator Instructions and below:
• Unintentional fall-related fatalities: W00–W19
• Firearm-related fatalities: W32–W34, X72–X74, X93–X95, Y22–Y24, Y35.0, *U01.4
• Homicides: X85–Y09, Y87.1, *U01, *U02
• Motor vehicle trafc fatalities: V02–V04(.1, .9), V09.2, V12–V14(.3–.9), V19(.4–.6), V20–V28(.3–.9),
V29–V79(.4–.9), V80(.3–.5), V81.1, V82.1, V83–V86 (.0–.3), V87(.0–.8), V89.2
• Suicides: X60–X84, Y87.0, *U03
▪
Deaths should be age-adjusted to the 2000 standard using the NCHS population distribution
(page 54 of the Injury Indicator Instructions).
Instructions for Creating and Using a TBI-Specific Injury Hospitalizations Data Set
The TBI-specic hospitalization indicators should be calculated based on rst creating a TBI-related injury
hospitalization subset. This is done using the instructions for the TBI-related hospital discharge indicator in the
State Injury Indicators: Instructions for Preparing 2010 Data
1
and outlined below:
▪
First, create an injury hospitalization subset (a primary diagnosis of 800–909.2, 909.4, 909.9, 910–994.9,
995.5–995.59, or 995.80–995.85).
▪
Then select hospitalizations with any of the following TBI ICD-9-CM
3
codes in any diagnosis eld:
800.00–801.99, 803.00–804.99, 850.0–854.19, 950.1–950.3, 959.01, or 995.55.
▪
The TBI-related injury hospitalization indicator should be the same as the TBI indicator in the Overall State
Injury Indicator Hospital Discharge spreadsheet.
▪
For the other TBI-related indicators, use the external-cause-of-injury codes specied in the Injury Indicator
Instructions and below. Search for external-cause-of-injury codes as instructed in the Injury Indicator
Instructions (pages 6–7).
State Special Emphasis Report: Instructions for Traumatic Brain Injury Data | 3
• Unintentional fall-related hospitalizations: E880–E886, E888
• Firearm-related hospitalizations: E922.0–E922.3, E922.8, E922.9, E955.0–E955.4, E965.0–E965.4,
E985.0–E985.4, E970, E979.4
• Assault-related hospitalizations: E960–E969, E979, E999.1
• Motor vehicle trafc hospitalizations: E810–E819
• Suicide attempt hospitalizations: E950–E959
▪
Hospitalizations should be age-adjusted to the 2000 standard using the NCHS population distribution
(page 54 of the Injury Indicator Instructions).
▪
The percentage of TBI-specic injury hospitalizations with external cause coding and those with only an
unspecied external cause of injury should be calculated as instructed in the TBI-specic hospitalization
spreadsheet.
Instructions for Creating and Using a TBI-Specific Emergency Department Data Set
These indicators should be calculated based on rst creating a TBI-related injury emergency department visit
subset. This is done using the instructions for the TBI-related emergency department indicator in the State
Injury Indicators: Instructions for Preparing 2010 Data
1
and outlined below:
▪
First, create an injury emergency department visit subset (a primary diagnosis of 800–909.2, 909.4, 909.9,
910–994.9, 995.5–995.59, or 995.80–995.85 OR a valid external cause of injury).
▪
Then select emergency department visits with any of the following TBI ICD-9-CM
3
codes in any diagnosis
eld: 800.00–801.99, 803.00–804.99, 850.0–854.19, 950.1–950.3, 959.01, or 995.55.
▪
The TBI-related injury emergency department visit indicator should be the same as the TBI indicator in the
Overall State Injury Indicator Emergency Department Visit spreadsheet.
▪
For the other TBI-related indicators, use the external-cause-of-injury codes specied in the Injury Indicator
Instructions and below (the same ICD-9-CM
3
codes as for hospitalizations). Search for external-cause-of-
injury codes as instructed in the Injury Indicator Instructions (page 9).
• Unintentional fall-related emergency department visits: E880–E886, E888
• Firearm-related emergency department visits: E922.0–E922.3, E922.8, E922.9, E955.0–E955.4,
E965.0–E965.4, E985.0–E985.4, E970, E979.4
• Assault-related emergency department visits: E960–E969, E979, E999.1
• Motor vehicle trafc emergency department visits: E810–E819
• Suicide attempt emergency department visits: E950–E959
▪
Emergency department visits should be age-adjusted to the 2000 standard using the NCHS population
distribution (page 54 of the Injury Indicator Instructions).
▪
The percentage of TBI-specic injury emergency department visits with external cause coding and those
with only an unspecied external cause of injury should be calculated as instructed in the TBI-specic
emergency department visit spreadsheet.
4 | State Special Emphasis Report: Instructions for Traumatic Brain Injury Data

State Special Emphasis Report: Instructions for Traumatic Brain Injury Data | 5
APPENDIX A: Special Emphasis Report: Traumatic Brain Injury template
This is a screenshot of the report template to be customized by individual states. The actual template is found
in an accompanying le.

6 | State Special Emphasis Report: Instructions for Traumatic Brain Injury Data

State Special Emphasis Report: Instructions for Traumatic Brain Injury Data | 7
APPENDIX B: Instructions for using the
Special Emphasis Report: Traumatic Brain Injury template
The data publication template for the Special Emphasis Report: Traumatic Brain Injury is designed to be used
in conjunction with the Traumatic Brain Injury Spreadsheets. The template is structured around a series of
preformatted Excel generated graphics and text boxes. As state-specic data is entered, these boxes may
need to be resized slightly to accommodate the individual state text.
All of the data to be presented in the template is found within the Traumatic Brain Injury Spreadsheets. In some
cases data from two or more cells of a spreadsheet may need to be combined as it is transferred to the Excel
tables found in the template.
The template is a formatted tool to help states quickly publish and disseminate state-specic traumatic brain
injury data to support program initiatives. It is designed as a collaborative publication between CDC and state
injury prevention programs to reect the work across agencies to prevent TBIs.
Technical Requirements
The template is provided in both Microsoft Word 2003 and 2010 to ensure access and compatibility across user
systems. For those using Microsoft Word 2007, you may wish to use the MS Word 2003 template, or download
a free Microsoft Ofce Compatibility Pack to exchange les between previous releases of MS Word (2007
and 2003). http://ofce.microsoft.com/en-us/products/microsoft-ofce-compatibility-pack-for-word-Excel-and-
powerpoint-HA010168676.aspx.
The template can be used with previous versions of MS Word, but may need adjustments in formatting or
saved as compatible le type (.doc). Save the completed document as a PDF for easier printing and electronic
distribution. Please follow the guidelines below for easy use and to ensure consistent design.
Entering Data for Charts/Graphs in Microsoft Word 2010
To enter data into the template pie charts and graphs:
▪
Click once onto the chart and the Chart Tools menu will appear on your toolbar.
▪
Right click on the chart and choose Edit Data from the menu.
▪
Enter data into the Excel sheet that opens.
▪
When complete, click X on the top right corner and the data will be automatically updated and saved.

8 | State Special Emphasis Report: Instructions for Traumatic Brain Injury Data
Entering Data for Charts/Graphs in Microsoft Word 2003
To enter data into the template pie charts and graphs:
▪
Click once onto the chart.
▪
Right click on the chart and choose Chart Object from the menu.
▪
Click on Edit
▪
The Chart Tools will open on the top toolbar, and the chart will be displayed as one page in an Excel
Workbook.
▪
Click on the next worksheet to view or edit the data.
▪
When complete, click X on the top right corner and the data will be automatically updated and saved.
Editing the Header
▪
To access the header in Word 2010, choose Insert, then Header, then Edit Header.
▪
In header, insert your state name in ALL CAPS, as indicated.
▪
Enter relevant information in <highlighted> sections and then remove highlighting and “< >” characters.
▪
Try to keep the font and formatting the same to avoid major shifts in spacing and layout.
▪
To ensure consistent design, keep only the 2 lines of text in the header. Use data year in the header, not the
year the data is released.
Adding Pages
▪
If you are including additional data points in your report, add extra pages to the template by inserting a new
page. The new page will include the header.
▪
You may choose to add page numbers for additional pages.
Design Layout, Colors and Images
▪
To ensure consistent overall design layout across all reports, please keep the original color palette, font, text
and graphic placement.
▪
Please keep color of the header unchanged.
▪
Images in the document are from NCIPC’s library of licensed images. If you would like to add additional
images (ex: to ll blank spaces if less text) or replace existing images, only use those licensed by CDC. You
can download for FREE at CDC’s Public Health Image Library at http://phil.cdc.gov/phil/home.asp.

State Special Emphasis Report: Instructions for Traumatic Brain Injury Data | 9
Clearance
▪
The template has been cleared by CDC.
▪
Before distribution or posting on websites, be sure to obtain appropriate clearance from your state health
department and injury prevention program. This includes applicable clearance of content and use of logos.
Logo
▪
The CDC logo is included in the templates. Do not adjust the placement of the logos.
▪
For uniform design, place the state health department logo in the designated area.
▪
Only state health department logos can be placed on this document. If other partner logos and local/county
health department logos are added, then the CDC logo must be removed.
• Note: All information within this document is available in the public domain and can be used freely.
However, the use of CDC logo within this document represents the agency and the brand, and has
only been approved for limited use with state health departments.
▪
The state health department logo cannot be larger in size than the CDC logo.
Section 508 Implementation and Compliance
Section 508 requires that Federal agencies’ electronic and information technology is accessible to people with
disabilities. This information must be accessible in a variety of ways, which are specic to each disability. To
learn more about Section 508 guidance, visit www.section508.gov.
Images, data tables, charts and graphs must contain titles and descriptions, Alt Text, to provide alternative,
text-based representations of the information contained within. The Alt Text is accessed and read through the
use of electronic screen readers.
The Special Emphasis Report: Traumatic Brain Injury from each state must be fully compliant with Section 508
before electronic distribution. Instructions to add Alt Text in Microsoft Word are below.

10 | State Special Emphasis Report: Instructions for Traumatic Brain Injury Data
Adding Alt Text to Images and Pictures in Microsoft Word 2010
▪
Right click on the image or picture.
▪
Choose Format Shape from the menu.
▪
Next, choose Alt Text from the menu.
▪
Enter the title and a brief description of the image in the elds provided.
• Ex: Mother adjusting son’s helmet while both are sitting on bicycles

State Special Emphasis Report: Instructions for Traumatic Brain Injury Data | 11
Adding Alt Text to Charts, Graphs or Data Tables in Microsoft Word 2010
▪
Right click on the chart, graph or data table.
▪
Choose Format Chart Area from the menu.
▪
Next, choose Alt Text from the menu.
▪
Enter the title and a brief description of the image in the elds provided. For data graphics, simply copy and
paste the summary next to each graph/chart.
• Ex: <Cause> was the leading cause of injury among those who were hospitalized with a TBI alone or in
combination with other injuries or conditions

12 | State Special Emphasis Report: Instructions for Traumatic Brain Injury Data
Adding Alt Text to Images and Pictures in Microsoft Word 2003
▪
Right click on the image or picture.
▪
Choose Format AutoShape from the menu.
▪
Next, choose Alt Text from the menu.
▪
Enter the title and a brief description of the image in the elds provided.
• Ex: Mother adjusting son’s helmet while both are sitting on bicycles
State Special Emphasis Report: Instructions for Traumatic Brain Injury Data | 13
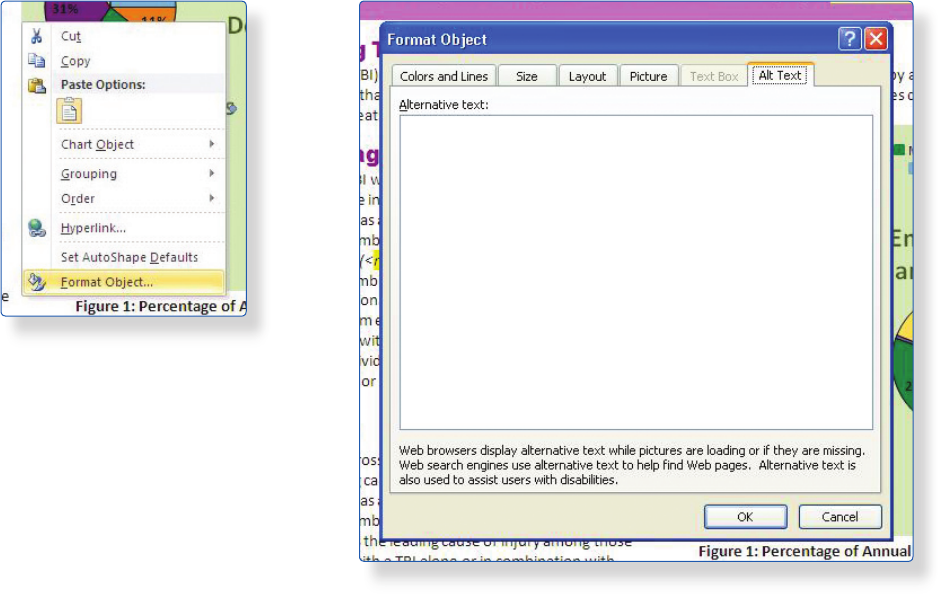
Adding Alt Text to Charts, Graphs or Data Tables in Microsoft Word 2003
▪
Right click on the chart, graph or data table.
▪
Choose Format Object from the menu.
▪
Next, choose Alt Text from the menu.
▪
Enter the title and a brief description of the image in the elds provided. For data graphics, simply
copy and paste the summary next to each graph/chart.
• Ex: <Cause> was the leading cause of injury among those who died with a TBI alone or
combined with other injuries or conditions.

14 | State Special Emphasis Report: Instructions for Traumatic Brain Injury Data
CHECKLIST
Be sure the following steps are completed before considering this document nal for distribution:
□ Header complete with necessary information.
□ Logos:
• No logos other than CDC and state health department
• State health department logo not larger than CDC logo
• Do not adjust the placement of the CDC logo
• If other partner logos are included, then CDC logo is removed
□ Clearance:
• State health department clearance complete
□ 508 Compliance
• All pictures have Alt Text
• All graphs and charts have Alt Text
□ Design/Formatting
• All colors unchanged.
• All images and layout remain unchanged
REFERENCES
1. Thomas KE, Johnson RL. State injury indicators report: instructions for preparing 2010 data. Atlanta (GA):
Centers for Disease Control and Prevention, National Center for Injury Prevention and Control; 2012.
2. International Classication of Diseases 10th Revision [online]. [cited 2012 Jan 27]. Available from URL:
http://www.who.int/classications/icd/en/.
3. International Classication of Diseases 9th Revision Clinical Modication [online]. [cited 2012 Jan 27].
Available from URL: www.cdc.gov/nchs/icd/icd9cm.htm

CS233209
