
Calumet County Severe Weather Facts (1950-2023)
Updated: 01/01/24: Next Update: January 2025
Storm Reports by Decade
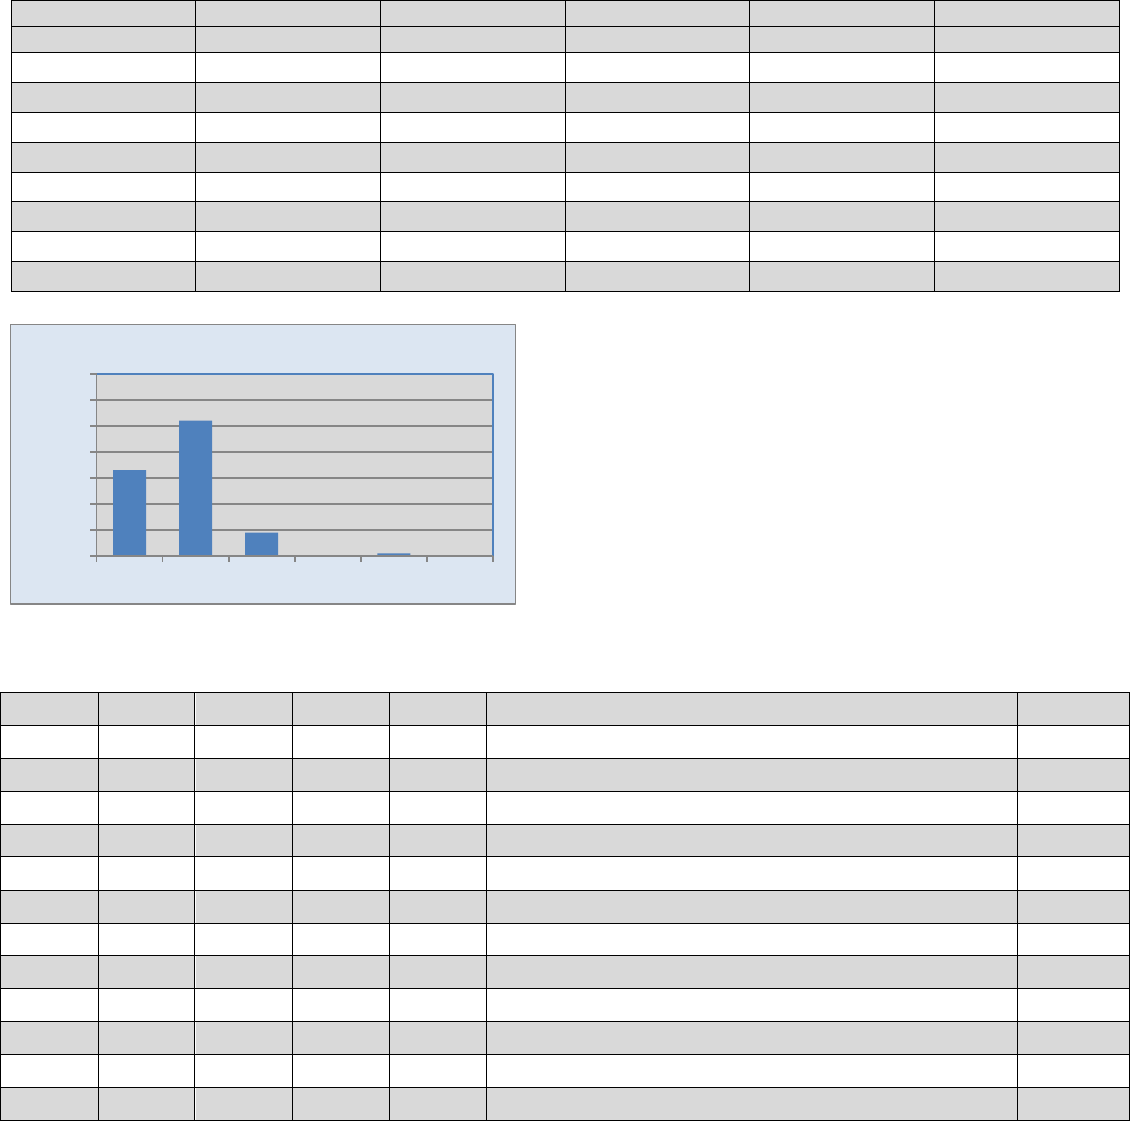
Since 1950 there have been 242 documented reports of large hail,
damaging winds and tornadoes across Calumet County (see graph to the
left). The population boom of the 1980s and 1990s combined with the
SKYWARN program led to an increase in the number of reports of severe
weather during both decades. The number of reports decreased 11% from
the 2014-2023 period compared to the 1990s, although many counties
across northeast Wisconsin saw increases in the number of storm reports.
One can’t say for sure there has been an increase in severe weather across
northeast Wisconsin. One possible reason for the apparent increase in
reports is that in some instances, multiple reports were received from a
single location for the same storm due to more spotters today. Another
reason for the increase in storm reports has been the focus by the National
Weather Service (NWS) to improve warning verification. 2006 was the
most active year with 21 reports, followed by 20 reports in 1998, 13
reports in 2008, 12 reports in 2011 and 10 reports in 1996, 2002, 2012 and
2021. In 2023, there were no reports of severe weather across the county.
Days of Severe Weather by Decade
In order to address the impact of multiple reports for the same storm, the
data was examined by the number of severe weather days. Since the
reports were sporadic during the 1950s through the 1970s, only data from
1980 to present was used. There has been an increase of 25% in the
number of days of severe weather from the 2014-2023 period compared
to the 1990s. (see graph to the left). This trend can be attributed to the
increase in population, technology advances in reporting severe weather
and greater severe weather awareness by the public. Since 2010, Calumet
County averages 2.9 days of severe weather per year. The long-term
average from 1980 to 2023 is 2.5 days per year. There were no reports of
severe weather in the following years: 1985, 1990, 1991, 1995, 2009 and
2023. The most active year was 2006 and 2021 with 8 days of severe
weather; followed by six days in 1998, 2005 and 2011. The last report of
severe weather occurred on August 3, 2022.
1
9
17
24
44
70
61
16
0
10
20
30
40
50
60
70
80
50s 60s 70s 80s 90s 00s 10s 20s
R
e
p
o
r
t
s
Storm Reports by Decade
1
7
14
12
20
35
30
11
0
5
10
15
20
25
30
35
40
50s 60s 70s 80s 90s 00s 10s 20s
D
a
y
s
Days of Severe Weather by Decade
2
1 1 1 1
0
2
1
2
1
0 0
1 1 1
0
5
2
6
4
1
2
5
4
2
6
8
3
4
0
3
6
3
4
1
2 2
4
2
3
1
8
2
0
0
2
4
6
8
10
1980
1981
1982
1983
1984
1985
1986
1987
1988
1989
1990
1991
1992
1993
1994
1995
1996
1997
1998
1999
2000
2001
2002
2003
2004
2005
2006
2007
2008
2009
2010
2011
2012
2013
2014
2015
2016
2017
2018
2019
2020
2021
2022
2023
D
a
y
s
Number of Days of Severe Weather Since 1980

Calumet County Severe Weather Facts (1950-2023)
Storm Reports by Month
Severe weather has been reported in Calumet County in every month except February, November and December. Surprisingly,
there has been one report of severe weather during the month of January. On January 24, 1967, a line of thunderstorms produced
damaging winds across Brown, Calumet, Winnebago, and Outagamie counties during the early evening hours. On a few
occasions, severe weather breaks out during the month of March. The severe weather season begins in earnest in April, with
the heart of the convective season between May and August. July is the peak month for the number of reports followed by June
and August. The warm season period of May through September accounts for 88% of all severe weather reports during the
year. Severe weather can occur from time to time in September. Isolated reports of severe weather have been noted during
October. Large hail (0.75 inches) was reported on October 2, 2006 in Brillion. The largest October event occurred on October
18, 2007 when there were four reports of large hail (0.88 to 1.50 inches) across the county. The latest report of severe weather
during a given year occurred on October 27, 1984 when wind damage was reported in New Holstein.
NOTE: The chart depicts storm type by month: (hail, wind/wind damage, tornadoes).
1
0
4
17
30
44
74
51
15
6
0 0
0
10
20
30
40
50
60
70
80
90
JAN FEB MAR APR MAY JUN JUL AUG SEP OCT NOV DEC
R
e
p
o
r
t
s
All Storm Reports By Month
0 0
3
6
12
13
33
18
5 5
0 0
1
0 0
8
14
24
35
27
10
1
0 00 0
1
3
4
7
6 6
0 0 0 0
0
5
10
15
20
25
30
35
40
JAN FEB MAR APR MAY JUN JUL AUG SEP OCT NOV DEC
R
e
p
o
r
t
s
Storm Reports By Month
Hail Wind Tornadoes

Calumet County Severe Weather Facts (1950-2023)
Storm Reports by Time of Day
No matter the season, the afternoon and early evening hours are the peak time for severe weather across Calumet County.
Nearly two-thirds of all severe weather reports occurred between 1 PM and 9 PM local standard time. In Calumet County,
severe weather reports increased after noon with a peak between 3 PM and 8 PM local standard time. The peak in the storm
activity corresponds to peak afternoon heating when the atmosphere is most unstable. During May through early September,
there is another peak of severe weather that occurs between midnight and 5 AM. In these events, thunderstorms that fire up
across the Dakotas and Minnesota and moves into the county overnight. However, on September 2, 2011 northeast Wisconsin
experienced one of the biggest and strongest morning severe weather outbreaks in years when severe thunderstorms developed
across east central and northeast Wisconsin and moved northeast into Brown County. Numerous reports of severe weather were
reported across Winnebago, Waushara, Outagamie and Brown Counties. Hurricane force winds were reported near High Cliff
State Park around 8:40 AM CST and near Wrightstown in Brown County around 8:45 AM CST. In 2019, a round of severe
thunderstorms moved across northeast Wisconsin on the morning of July 20
th
, producing wind gusts of 50 to 80 mph.
14
8
10
9
38
77
55
31
0
10
20
30
40
50
60
70
80
90
12AM-3AM 3AM-6AM 6AM-9AM 9AM-12PM 12PM-3PM 3PM-6PM 6PM-9PM 9PM-12AM
R
e
p
o
r
t
s
Severe Weather Reports Every 3 Hours (CST)
6
5
3
1
3
4
6
1
3
4 4
1
9
11
18
24 24
29
21 21
13
18
4
9
0
5
10
15
20
25
30
35
12A 1A 2A 3A 4A 5A 6A 7A 8A 9A 10A11A12P 1P 2P 3P 4P 5P 6P 7P 8P 9P 10P 11P
R
e
p
o
r
t
s
Severe Weather Reports By Hour (CST)

Calumet County Severe Weather Facts (1950-2023)
Severe Weather Reports Midnight to 6 AM CST
Overnight severe weather reports are most prominent during the summer (June through August) due to nocturnal convection
along warm fronts, or from complexes of storms that develop across the Dakotas and Minnesota and roll through northeast
Wisconsin during the early morning hours. The summer months account for nearly 73% of all overnight reports during the
year. The last report of an early morning severe weather event (midnight to 6 AM CST) occurred on July 18
th
when damaging
winds were reported around 4:50 AM CST near St. John.
0
5
16
1
0
2
4
6
8
10
12
14
16
18
WINTER (DEC-FEB) SPRING (MAR-MAY) SUMMER (JUN - AUG) FALL (SEP-NOV)
R
e
p
o
r
t
s
Midnight to 6 AM CST Reports By Season

Calumet County Severe Weather Facts (1950-2023)
Calumet County Tornadoes
Since record keeping began in 1950, there have been 27 documented tornadoes in Calumet County. Of the 27 tornadoes, there
have been zero documented tornadoes of F/EF3 or greater intensity. Six of the tornadoes have been rated F/EF2 intensity, 10
tornadoes were rated F/EF1 and 11 tornadoes rated F/EF0 (see table on next page). The last F/EF2 tornado to strike Calumet
County occurred four miles west of Kiel on April 4, 1981. The most tornadoes in a year occurred in 1996 with four. Two
tornadoes were reported in 1967, 2003, 2005, 2011 and 2013. The last tornado to strike Calumet County occurred on August
28, 2018 when an EF0 tornado touched down around 3:33 PM CST around two miles east of New Hostein. Since 1950,
tornadoes have touched down in 19 different years. A tornado strike in Calumet County occurs on average about every two and
a half years.
Event
Date
Time
F/EF
#
Month
Day
Year
(CST)
Start / End Location
Rating
1
6
20
1954
04:00
Brothertown
2
2
5
8
1964
18:30-19:06
Winneconne - Wrightstown
2
3
7
8
1965
17:00
Lake Winnebago - 1 N Sherwood
2
4
6
30
1967
23:49-23:59
Chilton - 7 E Chilton
2
5
7
2
1967
14:00
Brillion
1
6
4
21
1971
17:30
4 SW Hilbert
0
7
3
11
1973
10:30
2 E Calumetville
1
8
8
9
1979
18:20
Rockland Beach
2
9
4
4
1981
00:35
4 W Kiel
2
10
7
19
1983
19:25
Stockbridge Harbor
1
11
5
24
1989
21:05
4 WNW Chilton
1
12
6
11
1996
16:08-16:09
5 NW Chilton
0
13
7
18
1996
18:05-18:07
1.1 S - 1.6 SE Jericho
1
14
7
18
1996
18:10
5.9 S Chilton
0
15
7
18
1996
18:15-18:16
2.2 WNW - 1.8 W St Anna
0
16
5
31
1998
01:20-01:24
0.5 N Stockbridge - 2 NE Stockbridge
1
17
6
8
2003
12:42-12:46
4.3 W - 4.1 WSW Brothertown
0
18
8
3
2003
13:59-14:03
0.3 W - 0.2 ENE Potter
1
19
5
6
2005
15:25-15:29
5 WSW - 3.7 SW Brothertown
0
20
6
9
2005
18:14
4 NW Stockbridge
0
21
6
24
2006
16:14-16:15
4 W Sherwood
0
22
4
10
2011
19:59-20:01
1.6 NW Quinney - 1.5 SSE Stockbridge
1
23
8
23
2011
20:05-20:06
0.8 ENE - 1.3 E Sherwood
0
24
8
6
2013
23:38-23:52
3.5 E Greenville - 2.6 NNE Brillion
1
25
8
7
2013
00:05-00:10
0.5 SSE Henrysville - 1 NE Stangelville
1
26
6
15
2016
17:47-17:49
3.3 WSW Harrison - 2.6 NW Stockbridge
0
27
8
28
2018
15:33-1:534
1.9 E New Hostein
0

Calumet County Severe Weather Facts (1950-2023)
F/EF2 or Greater Tornadoes in Calumet County
Event
Date
Time
F/EF
#
Month
Day
Year
(CST)
Start / End Location
Rank
1
5
8
1964
18:30-19:06
Winneconne - Wrightstown
2
2
7
8
1965
17:00
Lake Winnebago - 1 N Sherwood
2
3
6
30
1967
23:49-23:59
Chilton - 7 E Chilton
2
4
8
9
1979
18:20
Rockland Beach
2
5
4
4
1981
00:35
4 W Kiel
2
Additional tornado data can be found on the NWS Green Bay webpage at: http://www.weather.gov/grb/severeclimate
Overall, F/EF2 tornadoes account for 22% of all tornadoes in the county. F/EF1 tornadoes 37% and F/EF0 tornadoes 41%.
11
10
6
0 0 0
F/EF0 F/EF1 F/EF2 F/EF3 F/EF4 F/EF5
0
2
4
6
8
10
12
14
T
o
r
n
a
d
o
e
s
Number of Tornadoes By F/EF Scale

Calumet County Severe Weather Facts (1950-2023)
Tornadoes by Month
Documented tornadoes have occurred in Calumet County from March through August. The earliest documented tornado during
the year occurred on March 11, 1973, when a F1 tornado touched down two miles east of Calumetville. The tornado season
peaks in June through August which accounts for 70% of all tornadoes during the year. The latest documented tornado on
record during a given year occurred on August 28, 2018 when an EF0 tornado touched down nearly two miles east of New
Hostein.
Tornadoes by Hour
In Calumet County, 18 out of the 27 (67%) documented tornadoes have occurred between 2 PM and 10 PM CST. There have
been no documented tornadoes between 2 AM and 4 AM CST, and from 5 AM and 10 AM CST.
2
1
0 0
1
0 0 0 0 0
1
0
1 1 1
2 2
3
6
2
1 1
0
2
0
1
2
3
4
5
6
7
12A 1A 2A 3A 4A 5A 6A 7A 8A 9A 10A11A 12P 1P 2P 3P 4P 5P 6P 7P 8P 9P 10P 11P
T
o
r
n
a
d
o
e
s
Tornadoes By Hour
0 0
1
3
4
7
6 6
0 0 0 0
0
2
4
6
8
10
JAN FEB MAR APR MAY JUN JUL AUG SEP OCT NOV DEC
T
o
r
n
a
d
o
e
s
Tornadoes By Month
Calumet County Severe Weather Facts (1950-2023)
Predominant Storm Reports – Wind and Hail Only
During March and October, large hail is the dominant weather event that is reported to the National Weather Service. Typically
during these months, the atmosphere is colder aloft to support large hail reaching the ground. For the remainder of the
convective season, reports of high winds or wind damage are nearly as slightly more likely to be reported to the National
Weather compared to large hail. June, August and September have a strong bias for strong winds or wind damage being reported
across the county compared to large hail.
% Hail
% Wind or
% Hail
% Wind or
Month
Reports
Wind Damage
Month
Reports
Wind Damage
Jan
0.0
100
Jul
48.5
51.5
Feb
0.0
0.0
Aug
40.0
60.0
Mar
100
0.0
Sep
33.3
66.7
Apr
42.9
57.1
Oct
83.3
16.7
May
46.2
53.8
Nov
0.0
0.0
Jun
35.1
64.9
Dec
0.0
0.0
Year
44.2
55.8
Large Hail in Calumet County
There have only been ten documented reports of large hail over two
inches in diameter across the county. The largest hail stone of 4.0
inches in diameter occurred at St. John on March 29, 1998. The
most recent large hail event over two inches occurred on July 16,
2008 when hail the size of two and a half inches was reported a half
mile east of Chilton. Overall, hail ranging in size from three
quarters to one inch accounted for 60% of the documented large
hail reports. Large hail reports of two inches or greater only
accounted for 11% of the total hail reports.
Hail over 2 inches
Rank
Month
Date
Year
Time
Location
Size
1
3
29
1998
12:25
St. John
4.00
2
7
5
1994
09:00
Chilton
2.75
3
7
16
2008
13:53
0.5 E Chilton
2.50
4T
7
16
2008
13:10
0.5 E High Cliff
2.00
4T
7
16
2008
13:08
High Cliff Junction
2.00
4T
7
1
2006
19:20
Potter
2.00
4T
5
12
2000
10:28
Stockbridge – Hayton
2.00
4T
8
23
1998
16:00
Sherwood
2.00
4T
8
14
1998
16:00
3 SSW Sherwood
2.00
4T
6
8
1973
17:15
2 SW Chilton
2.00
Calumet County Severe Weather Facts (1950-2023)
33
52
9
0
1
0
< 1 1 - 1.99 2 - 2.99 3 - 3.99 4 - 4.99 5-5.99
0
10
20
30
40
50
60
70
R
e
p
o
r
t
s
Hail Reports By Size (Inches)

Calumet County Summary
In Calumet County, the severe weather season begins in earnest in April and wanes quickly by September. Severe weather
usually occurs in the afternoon and early evening hours, with a secondary peak between midnight and 6 AM CST during the
summer months. If you do experience severe weather, you are likely to see large hail early in the spring or late fall. Damaging
wind or large hail will be the dominant severe weather report during the remainder of the convective season. In the NWS Green
Bay County Warning Area which includes 22 counties from central to northeast Wisconsin, Calumet County ranks 15
th
in the
total number of storm reports and 7
th
in the number of tornado reports since 1950.
One of the most severe storms to hit Calumet County (picture to the left of home
damaged in Chilton) occurred during the late morning of May 12, 2000 when a single
"high-precipitation" supercell thunderstorm developed in west-central Wisconsin, and
moved east across the central and east central Wisconsin. Hail up to the size of
baseballs, driven by winds in excess of 60 mph, produced incredible damage in
Waushara, Winnebago, Calumet, and Manitowoc counties. Chilton and St. Nazianz
were particularly hard-hit by very large hail and hurricane force wind gusts well over
75 mph. Total damage from the storm in Wisconsin was nearly $122 million, much of
that in the NWS Green Bay forecast area.
Green Bay Forecast Area Severe Weather Climatology Summary
Across the Green Bay forecast area which covers 22 counties in north-central and northeast Wisconsin, severe weather has
been documented in every month except February. This includes a rare event on January 24, 1967 in which a line of
thunderstorms produced damaging winds across Brown, Winnebago, and Outagamie counties during the early evening hours.
Another rare late season thunderstorm produced one inch hail in Florence County on December 5, 2001 while one inch hail
was reported four miles west of St. Nazianz in Manitowoc County on December 20, 1967.
Tornadoes have occurred from March through December, with an extremely rare tornado outbreak occurring on December 1,
1970. On this date four tornadoes were reported across central and northeast Wisconsin during the morning. A strong area of
low pressure brought unseasonably mild temperatures and severe thunderstorms to portions of central and northeast Wisconsin
as a cold front swept across the state. The first tornado was reported twelve miles southeast of Marshfield in Wood County
around 7 AM CST while another tornado was reported in the town of Hull in Portage County around 9 AM CST. Later that
morning, an EF2 tornado was reported in Waupaca and Shawano counties, from four miles southwest of Iola to near Marion
and Pella. The last and strongest tornado occurred around 9:45 AM CST. The EF3 tornado traveled from Medina in southwest
Outagamie County to far southeast Shawano County, destroying about 20 barns and five homes.
Here are the strongest documented tornadoes in the Green Bay forecast area which covers 22 counties in central, north-central
and northeast Wisconsin.
F/EF4 Tornadoes
Event
Date
Time
Tor in GRB Service Area
#
Month
Day
Year
(CST)
Start / End Location
County or Counties
1
6
25
1950
21:00
1 W Woodboro - 5 NE Rhinelander
Oneida
2
9
26
1951
15:45-16:08
9 SSW Amherst - 2 SW Bear Creek
Portage-Waupaca
3
4
3
1956
13:45-13:53
Berlin - 2 W Omro
Waushara-Winnebago
4
8
19
1968
16:10
3 SW Pound - Marinette
Marinette
5
4
21
1974
14:40-15:08
5 S Ripon - Oshkosh
Winnebago
6
4
27
1984
15:20-15:40
1 NE Winneconne - Freedom
Winnebago-Outagamie
7
7
5
1994
15:43-15:55
2.5 NW Maribel - 0.5 W Cooperstown
Manitowoc
Calumet County Severe Weather Facts (1950-2023)

Green Bay Forecast Area Severe Weather Climatology Summary
The state record for the largest documented hail stone in Wisconsin occurred in Wausau on May 22, 1921. The hailstone
measured 5.7 inches in diameter. More recently, a hailstone of 5.5 inches in diameter was reported in Port Edwards in southeast
Wood County on June 7, 2007. In 2021, there were three reports of hail four inches in diameter or greater across northeast
Wisconsin.
Hail
Month
Date
Year
Time (CST)
Start / End Location
County
5.70
5
22
1921
??
Wausau
Marathon
5.50
6
7
2007
15:23
Port Edwards - Wisconsin Rapids
Wood
4.50
9
7
2021
07:47-07:48
2 W Apple Creek
Outagamie
4.50
7
16
1997
14:15
8 NE Merrill
Lincoln
4.25
5
22
2011
15:05
0.8 NW Winchester
Winnebago
4.25
5
22
2011
14:35
0.5 E Redgranite
Waushara
4.10
9
7
2021
07:45-07:46
3 NE Greenville
Outagamie
4.00
9
7
2021
08:13-08:14
2 E Apple Creek
Outagamie
4.00
8
2
2015
13:32
2.8 S Brookside
Oconto
4.00
8
2
2015
13:24
0.5 E Abrams
Oconto
4.00
4
25
2008
17:50
0.8 SW Kings
Lincoln
4.00
7
1
2006
14:31
1 N Hayes - Suring
Oconto
4.00
3
29
1998
12:25
St. John
Calumet
3.75
9
7
2021
07:47-07:48
1 NW Little Chute
Outagamie
3.50
6
8
2000
22:30
10 W Middle Inlet
Marinette
3.25
7
1
2006
15:05
Oconto - 6 SE Oconto Falls
Oconto
3.00
10
24
2023
08:50-08:51
Nasonville
Wood
3.00
8
2
2015
14:06
Rudolph
Wood
3.00
5
22
2011
17:35
Plover
Portage
3.00
6
7
2007
15:50
5 W Langlade
Langlade
3.00
7
1
2006
19:29
Branch - Manitowoc
Manitowoc
3.00
4
18
2002
15:30
7 WSW Bloomville - 7 NW Bradley
Lincoln
3.00
8
9
2001
12:50
1S Sturgeon Bay
Door
3.00
6
5
1999
18:24
3 S - 8 SE Eagle River
Vilas
3.00
7
27
1989
10:50
1 N Oshkosh
Winnebago
3.00
8
19
1968
16:15
2 E Harmony
Marinette
3.00
7
19
1963
15:00
4 S Rhinelander
Oneida
3.00
7
1
1956
11:00
5 E Green Bay
Brown
