
Immediate Release
Contact: Patrick Nolan
248.754.0884
BORGWARNER REPORTS FOURTH QUARTER 2020 NET SALES INCREASED COMPARED WITH
FOURTH QUARTER 2019 AND NET CASH PROVIDED BY OPERATING ACTIVITIES OF $416
MILLION
Auburn Hills, Michigan, February 11, 2021 – BorgWarner Inc. (NYSE: BWA) today reported 2020 fourth
quarter and full-year results.
Fourth Quarter Highlights:
• U.S. GAAP net sales of $3,926 million, up 53.4% compared with fourth quarter 2019.
◦ Excluding the impact of foreign currencies and the impact of the Delphi Technologies
acquisition, net sales were up 6.2% compared with fourth quarter 2019.
• U.S. GAAP net income of $358 million, or $1.52 per diluted share.
◦ Excluding the $0.34 per diluted share related to non-comparable items (detailed in
the table below), adj. net income was $1.18 per diluted share.
• U.S. GAAP operating income of $214 million, or 5.5% of net sales.
◦ Excluding the $234 million of net pretax impacts related to non-comparable items,
adj. operating income was $448 million, or 11.4% of net sales.
• Net cash provided by operating activities of $416 million.
◦ Free cash flow of $197 million.
Full Year Highlights:
• U.S. GAAP net sales of $10,165 million, relatively flat when compared with 2019.
◦ Excluding the impact of foreign currencies and the impact of the Delphi Technologies
acquisition and the thermostat divestiture, net sales were down 11.0% compared with
2019.
• U.S. GAAP net income of $500 million, or $2.34 per diluted share.
◦ Excluding $0.42 per diluted share related to non-comparable items (detailed in the
table below), adjusted net earnings were $2.76 per diluted share.
• U.S. GAAP operating income of $618 million, or 6.1% of net sales.
◦ Excluding the $372 million of net pretax impacts related to non-comparable items,
adjusted operating income was $990 million, or 9.7% of net sales.
• Net cash provided by operating activities of $1,224 million.
◦ Free cash flow of $743 million.
Exhibit 99.1
1
Financial Results:
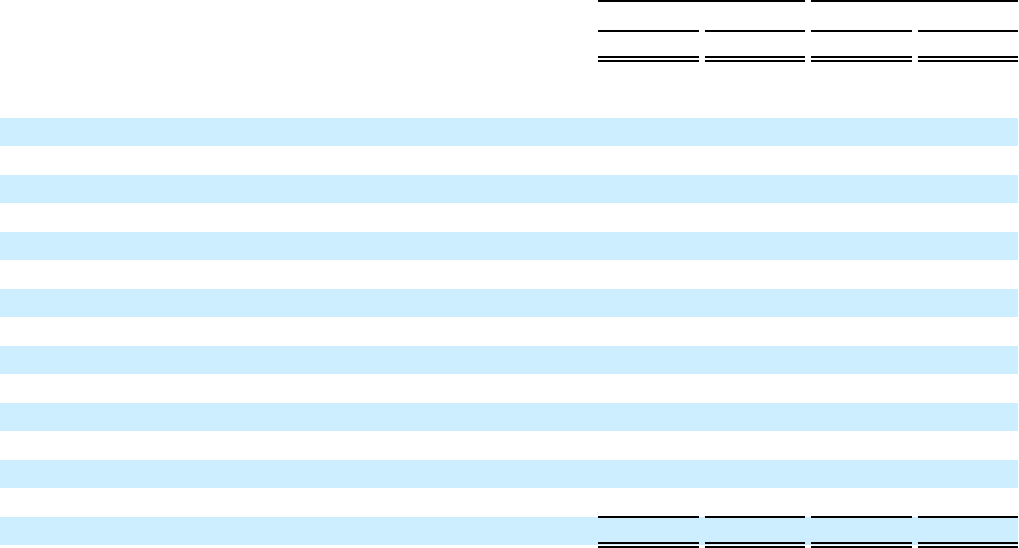
The Company believes the following table is useful in highlighting non-comparable items that
impacted its U.S. GAAP net earnings per diluted share. The Company defines adjusted earnings per
diluted share as earnings per diluted share adjusted to eliminate the impact of restructuring expense,
merger, acquisition and divestiture expense, other net expenses, discontinued operations, other gains
and losses not reflective of the Company's ongoing operations, and related tax effects.
Three Months Ended
December 31,
Year Ended
December 31,
2020 2019 2020 2019
Earnings per diluted share $ 1.52 $ 1.06 $ 2.34 $ 3.61
Non-comparable items:
Restructuring expense 0.53 0.11 0.86 0.26
Merger, acquisition and divestiture expense 0.13 0.01 0.38 0.05
Intangible asset accelerated amortization 0.13 — 0.14 —
Amortization of inventory step-up 0.09 — 0.10 —
Asset impairment and loss on divestiture — 0.03 0.08 0.03
Net gain on insurance recovery for property damage — — (0.04) —
Unfavorable arbitration loss — — — 0.07
Officer stock awards modification — — — 0.01
Gain on derecognition of subsidiary — (0.02) — (0.02)
Unrealized gain on equity securities* (1.26) — (1.36) —
Delayed-draw term loan cancellation — — 0.01 —
Pension settlement loss 0.02 — 0.02 0.10
Tax adjustments 0.02 (0.02) 0.23 0.02
Adjusted Earnings per Diluted Share $ 1.18 $ 1.17 $ 2.76 $ 4.13
*On December 29, 2020, through a business combination of Romeo Systems, Inc. and RMG Acquisition Corporation, a new entity Romeo
Power, Inc. became a publicly listed company. In the fourth quarter of 2020, the Company recorded a net after-tax gain of $298 million to
record its investment in Romeo Power Inc. at fair value. For full year 2020, the Company recorded a net after-tax gain of $291 million for fair
value adjustments to this investment.
Net sales were $3,926 million for the fourth quarter 2020, up 53.4% from $2,559 million for the fourth
quarter 2019 due primarily to the acquisition of Delphi Technologies and increased demand for the
Company’s products. The impact of foreign currencies increased net sales by approximately $88 million.
Net income for the fourth quarter 2020 was $358 million, or $1.52 per diluted share, compared with net
income of $220 million, or $1.06 per diluted share, for the fourth quarter 2019. Adj. net income per diluted
share for the fourth quarter 2020 was $1.18, compared to adj. net income per diluted share of $1.17 for
the fourth quarter 2019. Adj. net income for the fourth quarter 2020 excluded net non-comparable items
of $0.34 per diluted share. Adj. net income for the fourth quarter 2019 excluded net non-comparable
items of $(0.11) per diluted share. These items are listed in the table above, which is provided by the
Company for comparison with other results and the most directly comparable U.S. GAAP measures. Adj.
net earnings per diluted share was approximately flat on a year-over-year basis as the impact of higher
revenue and adj. net earnings from the Delphi Technologies acquisition was offset by a higher tax rate
and the impact of additional shares issued in the fourth quarter as a result of the acquisition.
Net sales for full year 2020 were $10,165 million, which was relatively flat when compared to $10,168
million in 2019 as added sales from the Delphi Technologies acquisition were primarily offset by
2
production disruptions arising from the COVID-19 pandemic. The impact of foreign currencies increased
net sales by approximately $22 million. Net income for the full year 2020 was $500 million, or $2.34 per
diluted share, compared with $746 million, or $3.61 per diluted share, for 2019. Adj. net income per
share for the full year 2020 was $2.76, down from adj. net income per diluted share of $4.13 for 2019.
Adj. net income for the full year 2020 excluded net non-comparable items of $(0.42) per diluted share.
Adj. net income for the full year 2019 excluded net non-comparable items of $(0.52) per diluted share.
These items are listed in the table above, which is provided by the Company for comparison with other
results and the most directly comparable U.S. GAAP measures. The decline in adj. net earnings per
diluted share was primarily due to lower income on lower sales arising from the COVID-19 pandemic and
a higher tax rate, partially offset by Adj. net earnings from the Delphi Technologies acquisition.
Net cash provided by operating activities was $1,224 million for the full year 2020 compared with
$1,008 million for the full year of 2019. Investments in capital expenditures, including tooling outlays,
totaled $481 million for the full year 2020 compared with $481 million for the full year 2019. Compared
with the end of 2019, balance sheet debt at the end of 2020 increased $1,827 million primarily due to the
Delphi Technologies acquisition. Cash and cash equivalents increased by $818 million compared with the
full year 2019, primarily due to the Company’s cash generation in 2020.
Following the completion of the Delphi Technologies acquisition on October 1, 2020, the Company
reorganized its management reporting structure to accommodate the newly acquired business.
Previously, the Company reported its results under two reporting segments, Engine and Drivetrain, which
are now combined with portions of the acquired business and referred to as Air Management and e-
Propulsion & Drivetrain, respectively. The former Delphi Technologies Powertrain Products segment was
integrated into the Air Management segment, and the former Delphi Technologies Electronics &
Electrification segment was integrated into the e-Propulsion & Drivetrain segment. The remaining Delphi
Technologies segments comprise two additional reporting segments, which are referred to as Fuel
Injection and Aftermarket.
Air Management Segment Results: The Air Management segment net sales were $1,942 million in the
fourth quarter 2020 compared with $1,533 million in the fourth quarter 2019. Excluding the impact of
foreign currencies and $312 million from the acquisition of Delphi Technologies, net sales were up 2.8%
from the prior year. Adj. earnings before interest, income taxes and non-controlling interest (“Adj. EBIT”)
were $301 million in the fourth quarter 2020, compared to $264 million from the prior year. The increase
in Adj. EBIT was primarily due to the acquisition of Delphi Technologies.
e-Propulsion & Drivetrain Segment Results: The e-Propulsion & Drivetrain segment net sales were
$1,447 million in the fourth quarter 2020 compared with $1,042 million in the fourth quarter 2019.
Excluding the impact of foreign currencies and $255 million from the acquisition of Delphi Technologies,
net sales were up 11.1% from the prior year. Adj. EBIT was $164 million in the fourth quarter 2020,
compared to $136 million from the prior year. The increase in Adj. EBIT was primarily due to the
acquisition of Delphi Technologies.
3
Fuel Injection Segment Results: The Fuel Injection segment’s net sales and Adj. EBIT in the fourth
quarter 2020 were $479 million and $39 million, respectively. The Adj. EBIT margin was 8.1% in the
fourth quarter 2020. This is a new segment following the Delphi Technologies acquisition.
Aftermarket Segment Results: The Aftermarket segment’s net sales and Adj. EBIT in the fourth quarter
2020 were $194 million and $22 million, respectively. The Adj. EBIT margin was 11.3% in the fourth
quarter 2020. This is a new segment following the Delphi Technologies acquisition.
Full Year 2021 Guidance: The Company has provided 2021 full year guidance. Net sales are expected
to be in the range of $14.7 billion to $15.3 billion, compared with 2020 pro forma combined sales of $12.8
billion. This implies a year-over-year increase in organic sales of 12% to 17%. The Company expects its
weighted light and commercial vehicle markets to increase in the range of approximately 11% to 14% in
2021. Foreign currencies are expected to result in a year-over-year increase in sales of approximately
$355 million, primarily due to the strengthening of the Euro and Chinese Renminbi against the U.S. dollar.
Operating margin is expected to be in the range of 8.6% to 9.5%. Excluding the impact of non-
comparable items, adjusted operating margin is expected to be in the range of 10.0% to 10.5%. Net
earnings are expected to be within a range of $3.23 to $3.77 per diluted share. Excluding the impact of
non-comparable items, adjusted net earnings are expected to be within a range of $3.85 to $4.25 per
diluted share. Full-year operating cash flow is expected to be in the range of $1,450 million to $1,600
million, while free cash flow is expected to be in the range of $800 million to $900 million.
At 9:30 a.m. ET today, a brief conference call concerning fourth quarter and full year 2020 results and
guidance will be webcast at: http://www.borgwarner.com/en/Investors/default.aspx. Additionally, an
earnings call presentation will be available at http://www.borgwarner.com/en/Investors/default.aspx.
BorgWarner Inc. (NYSE: BWA) is a global product leader in clean and efficient technology solutions
for combustion, hybrid and electric vehicles. Building on its original equipment expertise, BorgWarner
also brings market leading product and service solutions to the global aftermarket. With manufacturing
and technical facilities in 96 locations in 24 countries, the Company employs approximately 50,000
worldwide. For more information, please visit borgwarner.com.
# # #
Forward-Looking Statements: This press release may contain forward-looking statements as
contemplated by the 1995 Private Securities Litigation Reform Act that are based on management’s
current outlook, expectations, estimates and projections. Words such as “anticipates,” “believes,”
“continues,” “could,” “designed,” “effect,” “estimates,” “evaluates,” “expects,” “forecasts,” “goal,”
“guidance,” “initiative,” “intends,” “may,” “outlook,” “plans,” “potential,” “predicts,” “project,” “pursue,”
“seek,” “should,” “target,” “when,” “will,” “would,” and variations of such words and similar expressions are
intended to identify such forward-looking statements. Further, all statements, other than statements of
historical fact contained or incorporated by reference in this press release that we expect or anticipate will
or may occur in the future regarding our financial position, business strategy and measures to implement
that strategy, including changes to operations, competitive strengths, goals, expansion and growth of our
4
business and operations, plans, references to future success and other such matters, are forward-looking
statements. Accounting estimates, such as those described under the heading “Critical Accounting
Policies and Estimates” in Item 7 of our Annual Report on Form 10-K for the year ended December 31,
2019 (“Form 10-K”), are inherently forward-looking. All forward-looking statements are based on
assumptions and analyses made by us in light of our experience and our perception of historical trends,
current conditions and expected future developments, as well as other factors we believe are appropriate
in the circumstances. Forward-looking statements are not guarantees of performance, and the
Company’s actual results may differ materially from those expressed, projected or implied in or by the
forward-looking statements.
You should not place undue reliance on these forward-looking statements, which speak only as of the
date of this press release. Forward-looking statements are subject to risks and uncertainties, many of
which are difficult to predict and generally beyond our control, that could cause actual results to differ
materially from those expressed, projected or implied in or by the forward-looking statements. These risks
and uncertainties, among others, include: uncertainties regarding the extent and duration of impacts of
matters associated with COVID-19, including additional production disruptions; the failure to realize the
expected benefits of the acquisition of Delphi Technologies PLC that the Company completed on October
1, 2020; the failure to promptly and effectively integrate acquired businesses; the potential for unknown or
inestimable liabilities relating to acquired businesses; our dependence on automotive and truck
production, both of which are highly cyclical and subject to disruptions; our reliance on major OEM
customers; commodities availability and pricing; supply disruptions; fluctuations in interest rates and
foreign currency exchange rates; availability of credit; our dependence on key management; our
dependence on information systems; the uncertainty of the global economic environment; the outcome of
existing or any future legal proceedings, including litigation with respect to various claims; future changes
in laws and regulations, including, by way of example, tariffs, in the countries in which we operate;
impacts from any potential future acquisition or divestiture transactions; and the other risks, including by
way of example, pandemics and quarantines, noted in reports that we file with the Securities and
Exchange Commission, including Item 1A, “Risk Factors” in our most recently-filed Form 10-K and in our
most recently-filed Form 10-Q. We do not undertake any obligation to update or announce publicly any
updates to or revisions to any of the forward-looking statements in this press release to reflect any
change in our expectations or any change in events, conditions, circumstances, or assumptions
underlying the statements.
5
BorgWarner Inc.
Condensed Consolidated Statements of Operations (Unaudited)
(in millions, except per share amounts)
Three Months Ended Year Ended
December 31, December 31,
2020 2019 2020 2019
Net sales $ 3,926 $ 2,559 $ 10,165 $ 10,168
Cost of sales 3,154 2,014 8,255 8,067
Gross profit 772 545 1,910 2,101
Selling, general and administrative expenses 350 205 951 873
Other operating expense (income), net 208 (138) 341 (75)
Operating income 214 478 618 1,303
Equity in affiliates’ earnings, net of tax (8) (7) (18) (32)
Unrealized gain on equity securities (391) — (382) —
Interest income (4) (3) (12) (12)
Interest expense 23 12 73 55
Other postretirement (income) expense, net (2) 1 (7) 27
Earnings before income taxes and noncontrolling interest 596 475 964 1,265
Provision for income taxes 211 238 397 468
Net earnings 385 237 567 797
Net earnings attributable to the noncontrolling interest, net of tax 27 17 67 51
Net earnings attributable to BorgWarner Inc. $ 358 $ 220 $ 500 $ 746
Earnings per share attributable to BorgWarner Inc. — diluted $ 1.52 $ 1.06 $ 2.34 $ 3.61
Weighted average shares outstanding — diluted 236.0 206.9 214.0 206.8
Supplemental Financial Information (Unaudited)
(in millions)
Three Months Ended Year Ended
December 31, December 31,
2020 2019 2020 2019
Capital expenditures, including tooling outlays $ 219 $ 135 $ 481 $ 481
Depreciation and amortization $ 229 $ 115 $ 568 $ 439
6

BorgWarner Inc.
Net Sales by Reporting Segment (Unaudited)
(in millions) Three Months Ended Year Ended
December 31, December 31,
2020 2019 2020 2019
Air Management $ 1,942 $ 1,533 $ 5,678 $ 6,214
e-Propulsion & Drivetrain 1,447 1,042 3,989 4,015
Fuel Injection 479 — 479 —
Aftermarket 194 — 194 —
Inter-segment eliminations (136) (16) (175) (61)
Net sales $ 3,926 $ 2,559 $ 10,165 $ 10,168
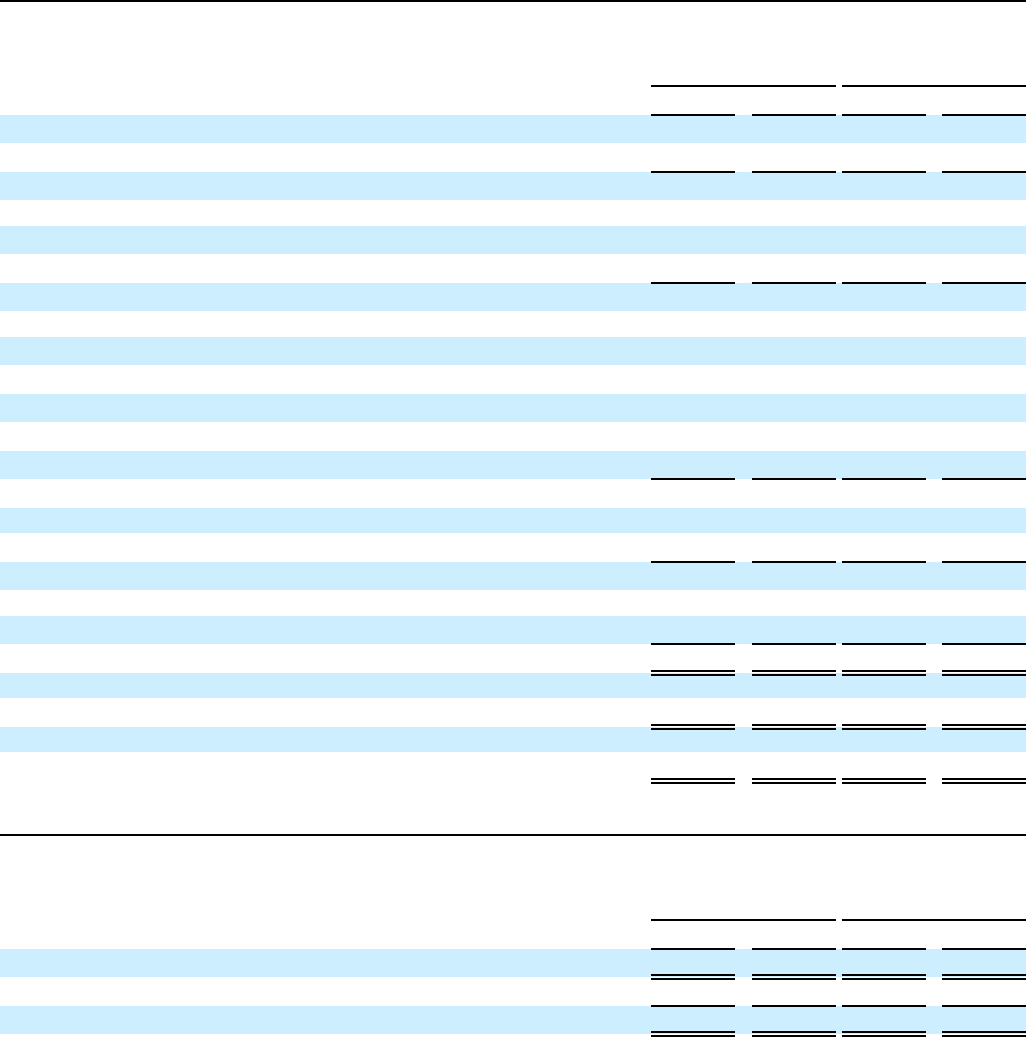
Segment Adjusted Earnings Before Interest, Income Taxes and Noncontrolling Interest ("Segment Adj. EBIT") (Unaudited)
(in millions)
Three Months Ended Year Ended
December 31, December 31,
2020 2019 2020 2019
Air Management $ 301 $ 264 $ 762 $ 995
e-Propulsion & Drivetrain 164 136 359 443
Fuel Injection 39 — 39 —
Aftermarket 22 — 22 —
Segment Adjusted EBIT 526 400 1,182 1,438
Restructuring expense 131 31 203 72
Merger, acquisition and divestiture expense 38 1 96 11
Intangible asset accelerated amortization 38 — 38 —
Amortization of inventory step-up 27 — 27 —
Asset impairment and loss on divestiture — 7 17 7
Net gain on insurance recovery for property damage — — (9) —
Gain on derecognition of subsidiary — (177) — (177)
Unfavorable arbitration loss — — — 14
Officer stock awards modification — — — 2
Corporate, including stock-based compensation 78 60 192 206
Equity in affiliates' earnings, net of tax (8) (7) (18) (32)
Unrealized gain on equity securities (391) — (382) —
Interest income (4) (3) (12) (12)
Interest expense 23 12 73 55
Other postretirement (income) expense (2) 1 (7) 27
Earnings before income taxes and noncontrolling interest 596 475 964 1,265
Provision for income taxes 211 238 397 468
Net earnings 385 237 567 797
Net earnings attributable to the noncontrolling interest, net of tax 27 17 67 51
Net earnings attributable to BorgWarner Inc. $ 358 $ 220 $ 500 $ 746
7
BorgWarner Inc.
Condensed Consolidated Balance Sheets (Unaudited)
(in millions)
December 31,
2020
December 31,
2019
ASSETS
Cash and cash equivalents $ 1,650 $ 832
Receivables, net 2,919 1,921
Inventories, net 1,286 807
Prepayments and other current assets 312 276
Total current assets 6,167 3,836
Property, plant and equipment, net 4,591 2,925
Other non-current assets 5,276 2,941
Total assets $ 16,034 $ 9,702
LIABILITIES AND EQUITY
Notes payable and other short-term debt $ 49 $ 286
Accounts payable 2,352 1,325
Other current liabilities 1,409 718
Total current liabilities 3,810 2,329
Long-term debt 3,738 1,674
Other non-current liabilities 1,733 855
Total BorgWarner Inc. stockholders’ equity 6,457 4,706
Noncontrolling interest 296 138
Total equity 6,753 4,844
Total liabilities and equity $ 16,034 $ 9,702
8

BorgWarner Inc.
Condensed Consolidated Statements of Cash Flows (Unaudited)
(in millions) Year Ended
December 31,
2020 2019
OPERATING
Net cash provided by operating activities $ 1,224 $ 1,008
INVESTING
Capital expenditures, including tooling outlays (481) (481)
Payments for businesses acquired, net of cash acquired (449) (10)
Capital expenditures for damage to property, plant and equipment (20) —
Payments for investments in equity securities (2) (53)
Insurance proceeds received for damage to property, plant and equipment 20 —
Proceeds from asset disposals and other, net 16 9
Proceeds from settlement of net investment hedges, net 10 22
Proceeds from sale of businesses, net of cash divested — 24
Net cash used in investing activities (906) (489)
FINANCING
Net increase (decrease) in notes payable 8 —
Additions to debt 1,178 63
Repayments of debt, including current portion (331) (204)
Payments for debt issuance cost (10) —
Payments for purchase of treasury stock (216) (100)
Payments for stock-based compensation items (13) (15)
Capital contribution from noncontrolling interest 4 4
Dividends paid to BorgWarner stockholders (146) (140)
Dividends paid to noncontrolling stockholders (37) (28)
Net cash provided by (used in) financing activities 437 (420)
Effect of exchange rate changes on cash 63 (6)
Net increase in cash and cash equivalents 818 93
Cash and cash equivalents at beginning of year 832 739
Cash and cash equivalents at end of year $ 1,650 $ 832
9

Non-GAAP Financial Measures
This press release contains information about BorgWarner’s financial results that is not presented in
accordance with accounting principles generally accepted in the United States (“GAAP”). Such non-
GAAP financial measures are reconciled to their closest GAAP financial measures below and in the
Financial Results table above. The provision of these comparable GAAP financial measures for 2020 is
not intended to indicate that BorgWarner is explicitly or implicitly providing projections on those GAAP
financial measures, and actual results for such measures are likely to vary from those presented. The
reconciliations include all information reasonably available to the Company at the date of this press
release and the adjustments that management can reasonably predict.
Management believes that these non-GAAP financial measures are useful to management, investors,
and banking institutions in their analysis of the Company's business and operating performance.
Management also uses this information for operational planning and decision-making purposes.
Non-GAAP financial measures are not and should not be considered a substitute for any GAAP measure.
Additionally, because not all companies use identical calculations, the non-GAAP financial measures as
presented by BorgWarner may not be comparable to similarly titled measures reported by other
companies.
Adjusted Operating Income and Adjusted Operating Margin
The Company defines adjusted operating income as operating income adjusted to eliminate the impact of
restructuring expense, merger, acquisition and divestiture expense, other net expenses, discontinued
operations, and other gains and losses not reflective of the Company’s ongoing operations. Adjusted
operating margin is defined as adjusted operating income divided by net sales.
Adjusted Earnings per Diluted Share
The Company defines adjusted earnings per diluted share as earnings per diluted share adjusted to
eliminate the impact of restructuring expense, merger, acquisition and divestiture expense, other net
expenses, discontinued operations, other gains and losses not reflective of the Company's ongoing
operations, and related tax effects.
Free Cash Flow
The Company defines free cash flow as net cash provided by operating activities minus capital
expenditures and it is useful to both management and investors in evaluating the Company’s ability to
service and repay its debt.
10

Adjusted Operating Income and Adjusted Operating Margin
Three Months Ended Year Ended
December 31, December 31,
(in millions) 2020 2019 2020 2019
Net sales $ 3,926 $ 2,559 $ 10,165 $ 10,168
Gross profit $ 772 $ 545 $ 1,910 $ 2,101
Gross margin 19.7 % 21.3 % 18.8 % 20.7 %
Operating income 214 478 618 1,303
Operating margin 5.5 % 18.7 % 6.1 % 12.8 %
Non-comparable items:
Restructuring expense $ 131 $ 31 $ 203 $ 72
Merger, acquisition and divestiture expense 38 1 96 11
Intangible asset accelerated amortization 38 — 38 —
Amortization of inventory step-up 27 — 27 —
Asset impairment and loss on divestiture — 7 17 7
Net gain on insurance recovery for property damage — — (9) —
Unfavorable arbitration loss — — — 14
Officer stock awards modification — — — 2
Gain on derecognition of subsidiary — (177) * — (177) *
Adjusted operating income $ 448 $ 340 $ 990 $ 1,232
Adjusted operating margin 11.4 % 13.3 % 9.7 % 12.1 %
*On October 30, 2019, the Company entered into a definitive agreement with Enstar Holdings (US) LLC (“Enstar”), a subsidiary of Enstar
Group Limited, pursuant to which Enstar acquired 100% of the equity interests of BorgWarner Morse TEC LLC ("Morse TEC"), a consolidated
wholly-owned subsidiary of the Company that held asbestos and certain other liabilities. In connection with the closing, the Company recorded
a pre-tax gain of $177 million. The tax expense associated with this transaction was $173 million, resulting in a net after-tax gain of $4 million.
Pro Forma Quarterly Net Sales and Adjusted Operating Income (Unaudited)
(in millions) Q1 2020 Q2 2020 Q3 2020 Q4 2020 FY 2020
Net sales
Air Management $ 1,683 $ 961 $ 1,750 $ 1,942 $ 6,336
e-Propulsion & Drivetrain 1,032 757 1,305 1,447 4,541
Fuel Injection 411 250 410 479 1,550
Aftermarket 174 129 195 194 692
Inter-segment eliminations (76) (43) (72) (136) (327)
Total net sales $ 3,224 $ 2,054 $ 3,588 $ 3,926 $ 12,792
Total Adjusted Operating Income (Loss) $ 274 $ (52) $ 396 $ 448 1,066
Total Adjusted Operating Income Margin 8.5 % (2.5) % 11.0 % 11.4 % 8.3 %
On October 1, 2020 BorgWarner completed its acquisition of Delphi Technologies PLC (Delphi Technologies). The 2020 pro forma unaudited
quarterly financial information included herein includes the pro forma combined results of BorgWarner and Delphi Technologies for periods prior
to October 1, 2020. The pro forma financial information has been derived from the unaudited consolidated financial statements included in
BorgWarner’s and Delphi Technologies’ Quarterly Report on Form 10-Q for the three and six months ended June 30, 2020 and does not give
effect to the transaction on periods prior to October 1, 2020. The pro forma financial information is not necessarily indicative of either the actual
consolidated results had the acquisition of Delphi Technologies occurred on January 1, 2020 or of future operating results.
11

Fourth Quarter 2020 Organic Net Sales Change
(in millions)
Q4 2019
Net Sales FX
Delphi
Technologies
Impact
Market Impact,
Pricing & Other
Q4 2020
Net Sales
Organic
Net Sales
Change
Net sales
Air Management $ 1,533 $ 54 $ 312 $ 43 $ 1,942 2.8 %
e-Propulsion & Drivetrain 1,042 34 255 116 1,447 11.1 %
Fuel Injection — — 479 — 479 —
Aftermarket — — 194 — 194 —
Inter-segment eliminations (16) — (120) — (136) —
Total net sales $ 2,559 $ 88 $ 1,120 $ 159 $ 3,926 6.2 %
Full Year 2020 Organic Net Sales Change
(in millions)
2019 Net
Sales FX
Delphi
Technologies
Impact
Thermostat
Sale
Market Impact,
Pricing & Other
2020 Net
Sales
Organic
Net Sales
Change
Net sales
Air Management $ 6,214 $ 15 $ 312 $ (30) $ (833) $ 5,678 (13.5) %
e-Propulsion & Drivetrain 4,015 7 255 — (288) 3,989 (7.2) %
Fuel Injection — — 479 — — 479 —
Aftermarket — — 194 — — 194 —
Inter-segment eliminations (61) — (120) — 6 (175) —
Total net sales $ 10,168 $ 22 $ 1,120 $ (30) $ (1,115) $ 10,165 (11.0) %
Adjusted Operating Income and Adjusted Operating Margin Guidance Reconciliation
Full-Year 2021 Guidance
Low High
Net Sales $ 14,700 $ 15,300
Operating Income 1,260 1,450
Operating Margin 8.6 % 9.5 %
Non-comparable items:
Restructuring and other expense $ 200 $ 150
Merger, acquisition and divestiture expense 10 10
Adjusted Operating Income $ 1,470 $ 1,610
Adjusted Operating Margin 10.0 % 10.5 %
Adjusted Earnings Per Diluted Share Guidance Reconciliation
Full-Year 2021 Guidance
Low High
Earnings per Diluted Share $ 3.23 $ 3.77
Non-comparable items:
Restructuring expense 0.58 0.44
Merger, acquisition and divestiture expense 0.04 0.04
Adjusted Earnings per Diluted Share $ 3.85 $ 4.25
12

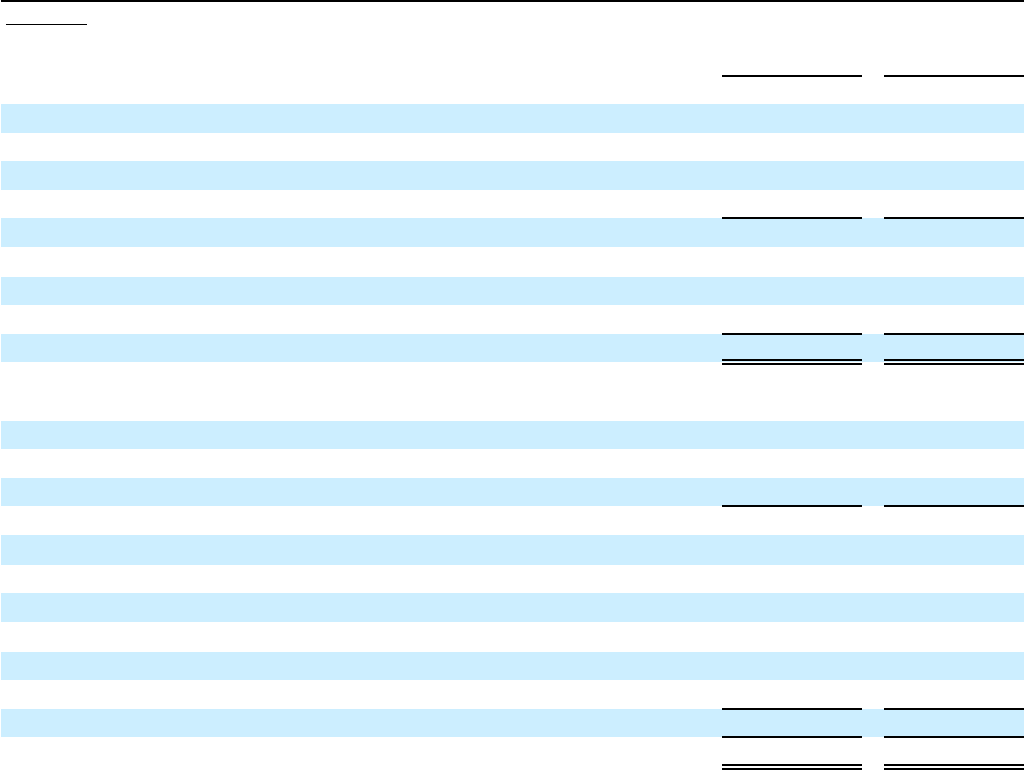
Free Cash Flow Reconciliation
Three Months Ended
December 31, Year Ended December 31,
2020 2019 2020 2019
Net cash provided by operating activities $ 416 $ 184 $ 1,224 $ 1,008
Derecognition of subsidiary — 172 — 172
Capital expenditures, including tooling outlays (219) (135) (481) (481)
Free cash flow $ 197 $ 221 $ 743 $ 699
Free Cash Flow Outlook Reconciliation
Full-Year 2021 Guidance
Low High
Net cash provided by operating activities $ 1,450 $ 1,600
Capital expenditures, including tooling outlays (650) (700)
Free cash flow $ 800 $ 900
Key Definitions
The terms below are commonly used by management and investors in assessing ongoing financial
performance.
Organic Net Sales Change: BorgWarner net sales change year over year excluding the estimated impact
of foreign exchange (FX) and net M&A.
Market: For 2020, light vehicle production weighted for BorgWarner's geographic exposure as estimated
by BorgWarner. For 2021, light and commercial vehicle production weighted for BorgWarner’s
geographic exposure as estimated by BorgWarner.
Outgrowth: For 2020, BorgWarner's “Organic Net Sales Change” vs. year-over-year change in “Market”.
For 2021 “Organic Net Sales Change” excluding Aftermarket segment vs. year-over-year change in
“Market”.
13
