
nutrients
Article
Evaluation of Disparities in Adults’ Macronutrient Intake Status:
Results from the China Health and Nutrition 2011 Survey
Yajie Zhao * and Tetsuya Araki
Citation: Zhao, Y.; Araki, T.
Evaluation of Disparities in Adults’
Macronutrient Intake Status: Results
from the China Health and Nutrition
2011 Survey. Nutrients 2021, 13, 3044.
https://doi.org/10.3390/nu13093044
Academic Editor: Zumin Shi
Received: 28 July 2021
Accepted: 27 August 2021
Published: 30 August 2021
Publisher’s Note: MDPI stays neutral
with regard to jurisdictional claims in
published maps and institutional affil-
iations.
Copyright: © 2021 by the authors.
Licensee MDPI, Basel, Switzerland.
This article is an open access article
distributed under the terms and
conditions of the Creative Commons
Attribution (CC BY) license (https://
creativecommons.org/licenses/by/
4.0/).
International Agro-Informatics Laboratory, Department of Agricultural Sciences, Graduate School of Agricultural
and Life Sciences, University of Tokyo, Tokyo 113-8657, Japan; [email protected]
* Correspondence: [email protected]; Tel.: +81-080-6680-6898
Abstract:
Little is known about the macronutrient intake status of adult Chinese people. This cross-
sectional study assessed the macronutrient intake status of adults (aged
≥
20 years) by comparing
their intake level of macronutrients against the Dietary Reference Intakes (DRI). It further explored the
associations between macronutrient intake status and age groups, genders, education levels, smoking
status, drinking frequency, social classes, knowledge of Chinese Dietary Guidelines 2016 (CDGs),
healthy diet priorities, and areas (urban and rural) within two regions (northern and southern).
The analysis includes the dietary intake data of 7860 Chinese adults, with complete data entries in
the China Health and Nutrition 2011 survey. Dietary data were obtained through the 24 h recall
method. More than half had carbohydrate intake below the recommended level of intake, and more
than half had fat intake above the recommended level of intake. There were significant associations
between three macronutrient intakes and education levels, social classes, healthy diet priorities, areas,
and regions. Disparities in macronutrient consumptions revealed geographical and socioeconomic
variations in dietary patterns, as well as risks for many different noncommunicable diseases. Public
health and nutrition interventions should take notice of regional differences in dietary intake and
place more emphasis on vulnerable populations including women, rural residents, and people with
lower education level.
Keywords:
macronutrient composition; Dietary Reference Intakes (DRI); northern and southern
regions; socioeconomic status; noncommunicable diseases
1. Introduction
Macronutrients play an important role in sustaining lives and regulating overall human
health [
1
]. The associations between the prevention of noncommunicable diseases (NCDs)
and the proportions of these macronutrient intakes have been well
documented [2–10]
. For
instance, evidence shows that diets low in saturated fat can improve cardiovascular health
compared to the ones high in saturated fat [
7
]. In particular, one study has suggested that
compared to the 55–60% carbohydrate diet, a lower-carbohydrate diet has positive effects
on weight control and reduces the risk of Type 2 diabetes [
5
]. Similarly, the Mediterranean
diet with an MUFA: SFA > 1.6 ratio of dietary fat intake can also reduce the risk of Type 2
diabetes [
7
,
8
]. In addition, many studies have shown that diets consisting of high amounts
of low-quality carbohydrates could be associated with high glycemic index and mortality
caused by all kinds of NCDs [
9
,
10
]. Over the past decades, diets high in carbohydrate
proportion have been replaced by the ones with higher fat proportions around the globe [
11
].
The changes in macronutrient composition are also linked to the burden of increase in
NCDs such as diabetes and overweight [11,12].
In China, it is well known that different cultural and dietary habits have been formed
between the northern and southern regions of China over a long period of history [
13
].
Geographically speaking, the Yellow River cultivated a fertile land that gave birth to the
north civilization and diet, and countless river basins and branches from the Yangtze River
Nutrients 2021, 13, 3044. https://doi.org/10.3390/nu13093044 https://www.mdpi.com/journal/nutrients

Nutrients 2021, 13, 3044 2 of 15
altogether nurtured the profound food cultures in the south [
14
]. Carbohydrates used
to dominate the traditional northern diet in the form of wheat, as compared to rice in
the southern diet [
13
–
15
]. Along with its economic growth and urbanization since the
beginning of the 21st century, the nutrition epidemiological transition in China has been
taking place rapidly across both regions [
13
,
16
–
19
]. Although the association between
dietary intake and NCDs is well established by numerous studies based on the China
Health and Nutrition Survey [
20
], little is known about the macronutrient intakes and
the factors influencing the intake of macronutrients among adults in two geographic
regions in China. Thus, it is important to understand the overall dietary intake and
nutritional status of Chinese adults through examining the macronutrient intakes by
regions. It is also important to have a contextual understanding of the regional differences
in intakes by various sociodemographic, socioeconomic, lifestyle, and health factors. More
detailed evidence may further facilitate Chinese health policymaking by targeting different
population groups among different regions.
The present study undertook the call to investigate whether the macronutrient intakes
among Chinese adults meet the recommended level of Dietary Reference Intakes (DRI)
included in the Chinese Dietary Guidelines 2016 (CDGs 2016) [
21
]. It also aimed to evaluate
the association between macronutrient intakes of adults (aged
≥
20 years) and different age
groups, genders, regions, areas, education levels, social class, smoking and drinking status,
knowledge status of CDGs, and priorities in healthy diets.
2. Materials and Methods
2.1. Study Design and Sample Collection
The China Health and Nutrition Survey (CHNS) is an ongoing survey that covers
myriad demographic, socioeconomic, and public health risk factors at both individual and
household levels across fifteen different provinces and autonomous cities [
17
]. It is an
international project coordinated by the Carolina Population Center at the University of
Carolina at Chapel Hill (UNC-CH), the National Institute for Nutrition and Health (NINH)
at the Chinese Center for Disease Control and Prevention (CCDC). Approval for using the
CHNS survey data was granted by the University of Tokyo (approval number: 21-71).
The sample data were collected from nine provinces in a multistage, random cluster-
drawing process in 1989. Later, nine additional data collection waves were conducted in
1991, 1993, 1997 (Heilongjiang province was added), 2000, 2004, 2006, 2009, 2011 (three
megacities, Beijing, Shanghai, and Chongqing, were added), and 2015 (Shaanxi, Yunnan,
and Zhejiang were added). Note that the CHNS dietary data were collected in 1991 and
subsequent survey waves up to 2011 [
17
]. This present study used dietary data collected
in 2011.
Data quality checks were performed to eliminate outliers (i.e., out-of-range values
that are above the 75th percentile and below the 25th percentile of the interquartile range
multiplied by a factor of 1.5). The following description shows the details of nutrition
survey data collection procedures.
2.2. Dietary Data Collection
The CHNS survey used the 24 h recall method to collect nutrition and dietary data
on a basis of three consecutive days at both individual and household levels. Individual
food composition was determined by a weighing technique that measured changes in food
inventory from the beginning to the end of each day. All remaining foods at the end of the
day were weighed and recorded. Preparation waste (spoiled foods and discarded meals
fed to pets or animals) was estimated when weighing was not possible [
18
]). Individual
dietary data were collected for three consecutive days. Trained field interviewers used food
models and pictures during the interview, asking each participant to report the amounts
and types of all foods consumed at home or away from home during the previous day [
18
].
Despite a few cases where some one-day dietary reports were missed, about 99%
of overall sample data was completed for three consecutive days. Moreover, the initial

Nutrients 2021, 13, 3044 3 of 15
data cleaning was performed in the CHNS survey which deleted duplicated, missing, and
unrealistically reported values, although some extreme values remaining in the data are
left to the discretion of researchers [18].
2.3. Assessment of Macronutrient Intake
Based on the Food Consumption Table, the CHNS obtained the three-day average values
for total daily energy intake (kcal), carbohydrates (g), fats (g), and proteins (g). The total energy
intake is the sum of the three macronutrient intakes multiplied by an energy conversion factor
of each: 1 g carbohydrate = 4 kcal, 1 g fat = 9 kcal, and 1 g protein = 4 kcal [22].
The Chinese Dietary Reference Intakes (DRI) is the dietary target for the Chinese
population to achieve an adequate intake of nutrients. It is released by the Chinese
Nutrition Society (CNS) and is constantly updated with the latest WHO recommendations
and nutritional evidence. [
23
]. According to the DRI, the recommended daily intake of
carbohydrates should account for 55–65% of daily energy intake; the recommended amount
of fat intake should be 20–30% of total energy intake; the adequate protein intake should
account for 11–15% of total energy intake. These cut-points are helpful to assess whether
the macronutrient intake levels of each Chinese adult meet the standard intake levels.
2.4. Other Variables
For the purpose of this study, age was stratified into three age groups (younger adults:
20–39 years, middle-aged adults: 40–59 years, and older adults: >60 years). Gender was
divided into male and female. This present analysis selected eight provinces that can be
evenly divided into two geographic regions (north: Liaoning, Heilongjiang, Shandong,
and Henan; south: Jiangsu, Hubei, Hunan, and Guangxi) [
13
]. Since some evidence has
demonstrated that urban development could have an impact on the food and nutrition
intakes as well as an overall health outcome [
21
,
23
], this present study further analyzes the
macronutrient intake between urban and rural areas with these two regions as well.
Education level was reported as the highest degree achieved and was recoded into
three different categories: low level (illiteracy; below high school), middle level (high school
diploma; technical degree), and high level (college degree and above). Since the frequency
of alcohol drinking was previously documented to be correlated with dietary intake [
24
],
self-reported alcohol intake frequency was represented by three different levels: low
frequency (no more than twice a month), middle frequency (1–4 times per week), and high
frequency (almost every day). One dummy variable was used to represent current smoking
status (no = 0, yes = 1). Social class was classified into two classes, defined by the types of
occupation: high social class (i.e., nonmanual, professional, and managerial occupations),
and low social class (i.e., skilled and unskilled manual occupations) [
25
]. Participants
in the CHNS study were also asked if they know about CDGs (no = 0,
yes = 1
). This
analysis included the participants’ knowledge of CDGs to testify if there is any relationship
between the status of knowing CDGs and the compliance with DRI. Additionally, the
CHNS also included a five-point Likert scale of self-rated healthy diet priority. In order to
assess whether an individual’s healthy diet priority can influence his or her macronutrient
intake [
26
], this study also included one variable that summarized participants’ perception
of a healthy diet as not important, important, and very important.
2.5. Statistical Analysis
RStudio version 4.0.3 (R Foundation for Statistical Computing) was used to conduct
all the data analysis in this study. The 3-day average total energy intake (kcal), macronutri-
ent intake (g), and percentage of each macronutrient intake (%) were reported as means
and standard deviations to represent the values of normally distributed data. Margin
plots were adopted to show the relative macronutrient intakes for urban and rural areas
between the south and the north. The chi-square test was used to examine the association
between the DRI levels (below, meeting, and above) for macronutrients and all the predic-
tors. A correlogram was created to display the correlation between variables of relative

Nutrients 2021, 13, 3044 4 of 15
macronutrient intakes. One-way ANOVA was used to explore whether the associations
between relative macronutrient intake and all the predictor variables were statistically
significant. Post hoc tests (using the Holm correction to adjust p) were performed after
ANOVA to observe which groups were significantly different from one another. Univariate
simple linear regression was constructed to explore the specific correlation between relative
macronutrient intakes and all the predictor variables. Three multiple linear regression
models were created for three macronutrients to further analyze these associations: the
carbohydrate model adjusted for age, gender, current smoking status, and CDG knowl-
edge; the fat model adjusted for CDG knowledge; the protein model adjusted for gender,
current smoking status, and CDG knowledge. Statistical significance was determined as
p value < 0.05.
3. Results
3.1. Participants’ Characteristics
There were 7860 Chinese adults aged
≥
20 years recruited in the 2011 CHNS who
had complete and valid dietary data. Of these participants, 22% (n = 1686) were aged
20–30 years, 47% (n = 3720) were aged 40–59 years, and 31% (n = 2454) were aged
≥
60 years.
The total number of participants from northern and southern regions was 3821 (49%) and
4039 (51%), respectively. Table 1 summarized the total 3-day average energy intake (kcal),
three macronutrient intakes (g), and energy from three macronutrients (%) classified by age
group, gender, region, area, education level, current smoking status, drinking frequency,
social class, CDG knowledge, and healthy diet priority.
3.2. Total Energy, Carbohydrates, Fat, and Protein Intakes
In general, according to Table 1, older adults aged
≥
60 years were having the least
amount of total energy and three macronutrient intakes compared to young and middle-
aged adults. Males had higher intakes in total energy and three macronutrients than their
female counterparts. Compared to those living in the south, people from the north had
lower intakes in total energy and three macronutrients. Current smokers had higher total
energy and three macronutrient intakes than those who were nonsmokers. Adults who
consumed alcohol at a high frequency had higher total energy and three macronutrient
intakes than those who drank less frequently. Compared with those who did not know
about CDGs, participants who had knowledge of CDGs had higher intakes in total energy
and three macronutrients. Adults to whom the priority of a healthy diet was high had the
most total energy and three macronutrient intakes.
As illustrated in Table 1, rural adults consumed lower amounts of total energy and
carbohydrate than their urban counterparts. People with low and middle education levels
had higher total energy intake than those with a higher education level. Carbohydrate
intake among those with a low education level was the highest. The total energy and
carbohydrate intakes among adults from the lower social class were higher than among
those from the higher social class.
Compared with the consistent results regarding total and carbohydrate intakes, an
inconsistency was detected in fat and protein intakes. People living in rural areas had
higher fat intake but lower protein intake than those living in urban areas. Participants
with a low educational level had lowest fat and protein intakes than those with middle
and high levels of education. Adults with a low social class had lower fat intake but higher
protein intake than the ones with a high social class (Table 1).
3.3. Relative Energy Intake from Carbohydrates, Fat, and Protein (%)
The mean relative intake of carbohydrates was slightly lower among adults who were
younger, male, currently smoking, and had high priority of healthy diet. No differences
were observed in the mean relative carbohydrate intake between those who had knowledge
of CDGs and those who did not. People with a high education level had the lowest relative
intake of carbohydrates. Although relative carbohydrate intake did not differ between

Nutrients 2021, 13, 3044 5 of 15
the groups with low and middle frequencies of alcohol consumption, those with a high
drinking frequency were found to have a lower mean intake of carbohydrate. Compared
with the mean relative carbohydrate intake, an opposite trend of fat intake was observed
among adults with different levels of education, social classes, and priorities of a healthy
diet. No major differences were observed in the mean relative protein intakes among adults
concerning all different categories (Table 1).
Table 1. Total energy intake, carbohydrate, fat, and protein intakes of adults.
N %
Energy
(kcal)
Carbohydrate
(g)
Fat (g) Protein (g)
Energy from
Carbohydrate (%)
Energy from
Fat (%)
Energy from
Protein (%)
Age
groups
(years)
20–39
1686
21.5 1996.7 (549.8) 268.5 (93.3) 71.1 (29.4) 65.1 (22.4) 53.7 (10.8) 32.2 (10.6) 13.2 (3.0)
40–59
3720
47.3 1991.8 (572) 272.9 (95.9) 69.1 (30.1) 67.2 (22.2) 54.7 (11.2) 31.3 (10.9) 13.6 (3.1)
≥60
2454
31.2 1825.4 (560.9) 246.8 (93.3) 65.3 (29.9) 58.3 (21.2) 54.04 (11.7) 32.3 (11.5) 13.0 (3.0)
Gender
Male
3603
45.8 2101.0 (575.2) 283.5 (97.8) 73.0 (30.2) 68.5 (22.8) 53.92 (11.2) 31.4 (10.7) 13.2 (3.0)
Female
4257
54.2 1807.7 (528.1) 245.1 (89.2) 65.4 (29.3) 59.1 (20.8) 54.11 (11.3) 32.5 (11.3) 13.2 (3.1)
Region
North
3821
48.6 1881.2 (566.7) 260.7 (92.3) 64.0 (30.2) 60.6 (21.4) 55.6 (11.2) 30.6 (1.21) 13.0 (2.9)
South
4039
51.4 1999.8 (565.7) 264.6 (97.7) 73.4 (29.1) 66.1 (22.7) 52.5 (11.1) 33.4 (10.7) 13.4 (3.1)
Area
Urban
2673
34.0 1775.6 (548.1) 222.0 (82.3) 69.3 (31.0) 62.6 (23.8) 50.2 (11.2) 34.9 (11.1) 14.2 (3.3)
Rural
5187
66.0 2028.1 (560.8) 283.8 (94.5) 68.7 (29.5) 63.8 (21.4) 56.0 (10.8) 30.5 (10.7) 12.7 (2.8)
Education
level
Low
5761
73.3 1942.0 (575.1) 267.4 (97.2) 67.3 (29.9) 62.1 (21.7) 55.0 (11.4) 31.4 (11.2) 12.9 (2.9)
Middle
1455
18.5 1958.0 (554.9) 255.0 (88.6) 72.4 (30.3) 66.8 (23.1) 52.2 (10.6) 33.3 (10.5) 13.8 (3.2)
High 644 8.2 1908.4 (547.5) 238.1 (85.8) 74.3 (29.2) 67.6 (22.9) 49.8 (10.1) 35.2 (10.2) 14.3 (3.2)
Current
smoker
Yes
1994
25.4 2095.7 (585.7) 281.1 (98.0) 72.9 (72.9) 67.9 (22.7) 53.7 (11.5) 31.4 (10.8) 13.1 (3.0)
No
5866
74.6 1890 (554.0) 256.4 (93.3) 67.5 (29.6) 61.9 (21.8) 54.1 (11.2) 32.2 (11.1) 13.2 (3.1)
Drinking
frequency
Low 335 4.3 1871.5 (539.3) 254.3 (94.5) 66.0 (29.1) 64.6 (23.1) 54.2 (11.8) 31.8 (11.4) 14.0 (3.5)
Middle
6769
86.1 1920.3 (558.4) 261.9 (94.9) 68.4 (29.9) 62.7 (23.1) 54.4 (11.1) 32.1 (11.0) 13.2 (3.0)
High 756 9.6 2169.0 (625.1) 273.5 (97.2) 74.1 (30.6) 69.0 (23.5) 50.7 (11.8) 31.1 (11.0) 12.9 (3.2)
Social
class
Low
3464
44.1 2032.9 (580.3) 284.0 (97.8) 68.3 (29.9) 65.0 (23.5) 55.8 (10.9) 30.4 (10.7) 12.9 (2.8)
High
4396
55.9 1870.7 (549.9) 245.9 (89.6) 69.3 (30.1) 62.2 (22.9) 52.6 (11.3) 33.3 (11.1) 13.4 (3.2)
Awareness
of CDG
Yes
1858
23.6 2040.9 (583.8) 275.6 (95.5) 72.3 (30.5) 66.8 (23.0) 54.0 (10.7) 31.9 (10.4) 13.2 (3.1)
No
6002
76.4 1911.6 (561.2) 258.7 (94.7) 67.8 (29.8) 62.4 (21.9) 54.0 (11.4) 32.1 (11.2) 13.2 (3.0)
Healthy
diet
priority
Low 514 6.5 1899.4 (576.4) 262.9 (94.2) 64.8 (31.8) 60.8 (21.4) 55.7 (12.4) 30.5 (12.1) 12.9 (3.1)
Middle
4535
57.7 1918.2 (571.2) 259.5 (95.7) 68.3 (30.3) 62.1 (22.3) 54.0 (11.5) 32.2 (11.3) 13.08 (3.0)
High
2811
35.8 1988.6 (561.9) 267.9 (94.2) 70.5 (29.0) 66.0 (22.1) 53.7 (10.6) 32.1 (10.4) 13.4 (3.0)
All values are means (standard deviation).
3.4. Percentage of Adults Meeting the DRI for Carbohydrates, Fat, and Protein (%)
The percentage of adults in the study sample with relative macronutrient intakes
below, meeting, and above the DRI, classified by age groups, gender, regions, areas,
education levels, current smoking status, drinking frequency, social classes, knowledge of
CDC, and healthy diet priority, is shown in Figure 1.
More than half of the adults had relative carbohydrate intakes below the recommended
level of DRI, while more than half of them had relative fat intakes above the DRI level.
About one-third of the adults had relative carbohydrate and fat intakes meeting the DRI
levels, and more than half of the adults’ relative protein intake met the DRI.

Nutrients 2021, 13, 3044 6 of 15
There were no significant differences in the percentage of adults with macronutrient
intake levels below, meeting, and above the DRI with respect to different genders (carbo-
hydrate p = 0.7, fat p = 0.02, protein p = 0.46) and current smoking status (carbohydrate
p = 0.75, fat p = 0.15, protein p = 0.96). However, there were significant differences in the
percentage of adults with macronutrient intake levels below, meeting, and above the DRI
with respect to different regions, areas, education levels, social classes, and healthy diet
priorities (p < 0.001).
Approximately 14% out of the 7860 adults simultaneously met the DRI for all three
macronutrients. Table 2 shows that none of the younger adults simultaneously met the
DRI for all three macronutrients. The chi-square test indicated that were no significant
differences among regions (p = 0.69) and social class (p = 0.28) in terms of simultaneously
meeting the DRI for three macronutrients. However, there were significant differences in
the percentage of adults with all three macronutrient intake levels meeting DRI with respect
to different age groups, areas, education levels, smoking status, drinking frequencies, CDG
knowledge, and healthy diet priorities (p < 0.001).
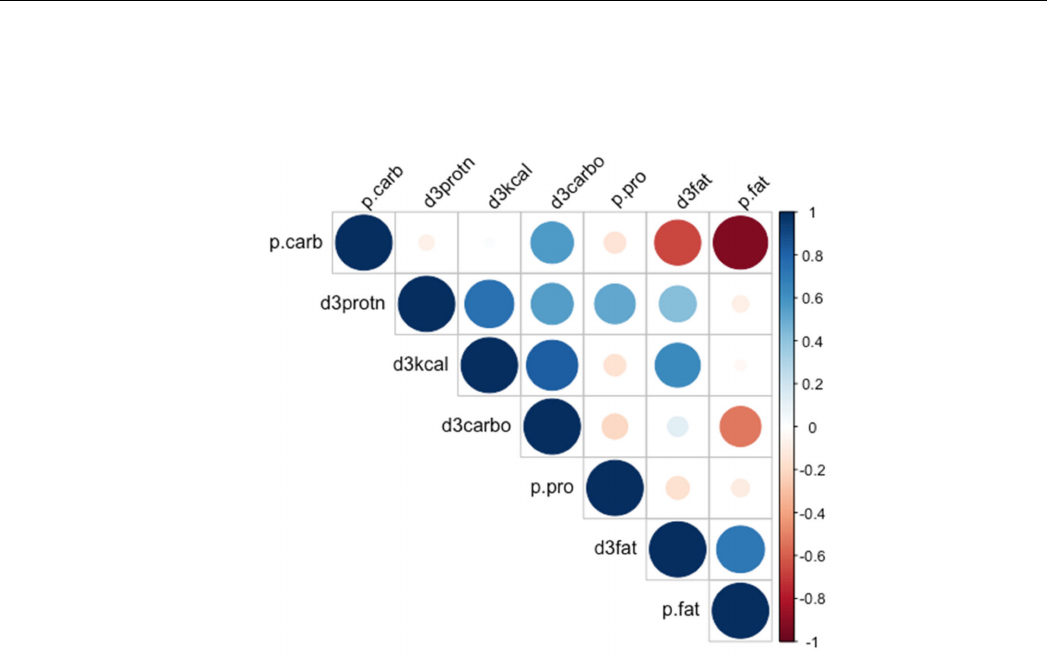
3.5. Consumption Correlations among Relative Macronutrient Intakes
Figure 2 is a correlogram displaying the correlations among total daily energy intake,
three macronutrient intakes, and three relative macronutrient intakes. There was a strong
positive correlation between daily total energy intake and carbohydrate intake, suggesting
that carbohydrate was the main source of energy in daily diets. A strong negative correla-
tion was found between relative carbohydrate intake and relative fat intake. No significant
correlations were found between total energy intake and protein intake, as well as between
relative carbohydrate intake and relative protein intake.
Nutrients 2021, 13, x FOR PEER REVIEW 7 of 16
Figure 1. Cont.

Nutrients 2021, 13, 3044 7 of 15
Nutrients 2021, 13, x FOR PEER REVIEW 7 of 16
Figure 1.
Percentage of adults with macronutrient intake below/meeting/above the recommended intake of DRI: (
a
) carbo-
hydrates; (b) fats; (c) proteins.

Nutrients 2021, 13, 3044 8 of 15
Table 2.
Demographic characteristics and chi-square tests of adults who simultaneously met the DRI
for all three macronutrients.
n %
χ
2
p
N = 1609
Age group
20–39 0 0.00 939.13 <0.001
40–59 266 24.90
≥60 803 75.10
Gender
Male 481 45.00 10.71 <0.005
Female 1128 55.00
Region
North 541 50.60 0.16 0.69
South 1068 49.40
Area
Urban 220 20.60 370.10 <0.001
Rural 1389 79.40
Education
Low 825 77.20 942.86 <0.001
Middle 179 16.70
High 605 6.10
Current smoker
Yes 796 24.00 290.22 <0.001
No 813 76.00
Drinking frequency
Low 85 8.00 1461.70 <0.001
Middle 945 88.40
High 579 3.60
Social class
Low 1092 51.60 1.15 0.28
High 517 48.40
CDG knowledge
Yes 290 27.10 223.69 <0.001
No 1319 72.90
Healthy diet priority
Low 69 6.50 409.42 <0.001
Middle 605 56.60
High 935 36.90
3.6. Linear Regression Models
Significant differences were found to exist in relative macronutrient intakes among
different ages, genders, regions, areas, and levels of education, smoking status, drinking
frequency, social class, and health diet priority. The specific associations between the
relative macronutrient intakes and all the predictor variables were further explored using
linear regression models (Table 3).
The univariate regression analysis suggested that age, gender, smoking status, and
CDG knowledge (p > 0.05) had no effect on the relative intake of carbohydrates. The
adjusted multiple linear regression revealed significant associations between carbohydrate
intake and regions (p < 0.001, 95% CI
−
3.67,
−
2.67), areas (p < 0.001, 95% CI 5.23, 6.25),
education levels (p < 0.001), drinking frequencies (p < 0.001), social classes (p < 0.001, 95%
CI 3.03, 4.06), and healthy diet priorities (p < 0.005). Compared with adults who had
low education level, those with middle and high education levels had lower intakes of
carbohydrates (2.90% and 5.49% lower, respectively).
Adults living in the south had 3.17% lower carbohydrate intake than those from
the north. Higher relative carbohydrate intake was associated with lower social class
(3.55% higher). Adults with low and middle drinking frequencies had higher carbohydrate
intake than those with high drinking frequency (3.69% and 3.40% higher, respectively).
Compared to the adults living in the urban area, those from the rural area had 5.74% higher
Nutrients 2021, 13, 3044 9 of 15
carbohydrate intake than those living in the urban area. There was an inverse association
between relative carbohydrate intake and priority levels placed in a healthy diet, in which
higher carbohydrate intake was associated with lower priorities placed in a healthy diet.
Figure 2.
Correlations among total daily energy intake, macronutrient intakes, and relative macronu-
trient intakes. P.carb, percentage of daily energy from carbohydrate; p.pro, percentage of daily
energy from protein; p.fat, percentage of daily energy from fat; d3carbo, three-day average intake
of carbohydrate (g); d3fat, three-day average intake of fat (g); d3protn, three-day average intake of
fat (g).
No significant difference was found in relative fat intake between adults who had
knowledge of CDG and those who did not (p = 0.57, 95% CI
−
0.74, 0.41). However, strong
associations with relative fat intake were found among age groups and smoking status
(p < 0.005). Stronger associations were found in genders, regions, areas, education levels,
social classes, and healthy diet priorities (p < 0.001). Interestingly, higher relative fat intake
was associated with females (1.11% higher), low drinking frequency (1.04% higher), and
high social class (3.00% higher). Compared to those with low education level, adults with
middle and high education levels had higher relative fat intake (2.00% and 4.04% higher,
respectively). Adults living in the southern region had 2.86% higher fat intake than those
living in the northern region, and rural residents had 4.41% lower fat intake than their
urban counterparts. Compared to adults with low priority of healthy diet, those with middle
and high priority had higher relative fat intake (1.69% and 1.60% higher, respectively).
As far as relative protein intake was concerned, there were no statistically significant
differences examined in different genders, status of smoking, and status of CDG knowledge.
However, strong associations were observed between relative protein intake and age
groups, regions, areas, education levels, drinking frequencies, social classes, and healthy
diet priorities (p < 0.001). Compared with adults above 60 years of age, middle-aged and
younger adults had higher relative protein intake (0.32% and 0.72% higher, respectively).
Adults living in the southern region had 0.37% higher protein intake than their northern
counterparts. Rural adults had 1.50% lower protein intake than urban adults. Relative
protein intake was also associated with higher education levels, higher drinking frequency,
higher social class, and higher healthy diet priority.

Nutrients 2021, 13, 3044 10 of 15
Table 3.
Results of linear regression analysis of three macronutrient relative intakes and its associated factors (coefficients
and 95% confident intervals).
Univariate Simple Linear Model Adjusted Multiple Linear Model
Coefficient CI 95 p Coefficient CI 95 p
% energy from carbohydrate
Age groups (years)
≥60 (ref)
40–59 −0.34 −0.91, 0.23 0.24
20–39 0.65 0.05, 1.34 0.07
Gender
Male (ref)
Female 0.18 −0.32, 0.68 0.47
Region
North (ref)
South −3.07 −3.56, −2.57 <0.001 −3.17 −3.67, −2.67 <0.001
Area
Urban (ref)
Rural 5.73 5.22, 6.24 <0.001 5.74 5.23, 6.25 <0.001
Education level
Low (ref)
Middle −2.78 −3.42, −2.14 <0.001 −2.90 −3.55, −2.26 <0.001
High −5.20 −6.11, −4.29 <0.001 −5.49 −6.41, −4.57 <0.001
Current smoker
No (ref)
Yes −0.45 −1.02, 0.12 0.12
Drinking frequency
High (ref)
Middle 3.66 2.81, 4.50 <0.001 3.69 2.81, 4.57 <0.001
Low 3.43 1.99, 4.87 <0.001 3.40 1.94, 4.87 <0.001
Social class
High (ref)
Low 3.20 2.70, 3.70 <0.001 3.55 3.03, 4.06 <0.001
CDG knowledge
No (ref)
Yes 0.02 −0.57, 0.61 0.95
Healthy diet priority
Low (ref)
Middle −1.69 −2.71, −0.66 <0.001 −1.70 −2.73, −0.68 <0.005
High −1.98 −3.04, −0.92 <0.001 −2.02 −3.09, −0.96 <0.005
% energy from fat
Age groups (years)
≥40 (ref)
20–39 −0.95 −1.54, −0.36 <0.005 −0.94 −1.54, −0.35 <0.005
Gender
Male (ref)
Female 1.12 0.63, 1.60 <0.001 1.11 0.62, 1.60 <0.001
Region
North (ref)
South 2.84 2.36, 3.33 <0.001 2.86 2.38, 3.35 <0.001
Area
Urban (ref)
Rural −4.40 −4.91, −3.90 <0.001 −4.41 −4.91, −3.91 <0.001
Education level
Low (ref)
Middle 1.89 1.26, 2.52 <0.001 2.00 1.37, 2.64 <0.001
High 3.80 2.91, 4.70 <0.001 4.04 3.13, 4.95 <0.001

Nutrients 2021, 13, 3044 11 of 15
Table 3. Cont.
Univariate Simple Linear Model Adjusted Multiple Linear Model
Coefficient CI 95 p Coefficient CI 95 p
Current smoker
No (ref)
Yes −0.80 −1.36, −0.24 <0.01 −0.80 −1.36, − 0.24 <0.005
Drinking frequency
High(ref)
Low 1.04 0.21, 1.86 <0.05 1.04 0.22, 1.87 <0.05
Social class
High (ref)
Low −2.99 −3.50, −2.50 <0.001 −3.00 −3.49, −2.52 <0.001
CDG knowledge
No (ref)
Yes −0.17 −0.74, 0.41 0.57
Healthy diet priority
Low (ref)
Middle 1.66 0.66, 2.67 <0.01 1.69 0.69, 2.70 <0.001
High 1.55 0.51, 2.58 <0.01 1.60 0.55, 2.64 <0.005
% energy from protein
Age groups (years)
≥60 (ref)
40–59 0.31 0.16, 0.47 <0.001 0.32 0.17, 0.48 <0.001
20–39 0.72 0.52, 0.91 <0.001 0.72 0.53, 0.91 <0.001
Gender
Male (ref)
Female 0.04 −0.10, 0.17 0.61
Region
North (ref)
South 0.36 0.23, 0.49 <0.001 0.37 0.23, 0.51 <0.001
Area
Urban (ref)
Rural −1.50 −1.64, −1.36 <0.001 −1.50 −1.63, −1.35 <0.001
Education level
Low (ref)
Middle 0.90 0.73, 1.07 <0.001 0.94 0.75, 1.10 <0.001
High 1.39 1.15, 1.64 <0.001 1.46 1.20, 1.70 <0.001
Current smoker
No (ref)
Yes −0.13 −0.29, 0.02 0.094
Drinking frequency
Low (ref)
High 0.76 0.43, 1.10 <0.001 0.77 0.43, 1.10 <0.001
Social class
High (ref)
Low −0.45 −0.58, −0.31 <0.001 −0.44 −0.58, −0.31 <0.001
CDG knowledge
No (ref)
Yes 0.06 −0.10, 0.22 0.44
Healthy diet priority
Low (ref)
High 0.35 0.21, 0.49 <0.001 0.35 0.21, 0.49 <0.001
4. Discussion
This cross-sectional study examined the association between the status of three
macronutrient intakes and age groups, genders, regions (northern and southern), areas
(urban and rural), education levels, smoking status, drinking frequencies, social class,
knowledge of CDGs, and priorities of healthy diet among Chinese adults aged above

Nutrients 2021, 13, 3044 12 of 15
20 years. Our results showed that more than half of the adults met the recommended level
for protein intake, but the status of carbohydrate and fat intakes is concerning. Another
interesting finding regarding the dietary pattern among Chinese adults was the inverse
relationship between the relative intake of carbohydrates and that of fat. In line with the
same finding, one study concluded that high carbohydrate intake may be associated with
lower fat intake [27].
Moreover, there were significant differences in the relative intakes of the three macronu-
trients with respect to different regions, areas, education levels, social classes, and healthy
diet priorities. Some very interesting findings were provided by this current analysis. First,
more than half of the adults had carbohydrates intake below the recommended level, with
adults in the high education level and social class having less carbohydrate intake than
those in the low education level and social class. Meanwhile, more than half of the adults
had fat intakes above the recommended level, with adults in the high education level
and social class having more fat intake than those in the low education level and social
class. These findings were compatible with results of previous studies suggesting that
the dietary pattern of those with better socioeconomic status has shifted to the high-fat
and low-carb macronutrient proportion, which could be one of the major causes of the
nutritional epidemics in China [
28
]. Furthermore, a similar study conducted in Norway
also reported the link between education gradients and macronutrient intake, in which
higher education was associated with higher fat and lower carbohydrate consumption [
29
].
Therefore, the diet and health interventions should focus on improving education level
with an emphasis on less-advantaged groups (i.e., those with lower socioeconomic status
and education level).
Second, lower carbohydrate intake and higher fat intake were also found in urban
adults living in the southern region compared to their northern counterparts. This finding
was consistent with previous literature suggesting that economic growth, urbanization, and
globalization of food can play an important role in affecting eating habits and prevalence
of NCDs [
30
–
32
]. Despite the fact that southerners had higher relative fat intake, studies
have shown that hypertension and obesity were more common in the northern region [
32
].
This could be explained by the higher MUFA:SFA ratio in the southern diet that contains
more omega-3 fatty acids from fish, which lowers the risk of hypertension [
15
]. Some
studies also showed that the carbohydrate-rich dietary pattern in the north is more likely
associated with low HDL and higher risk of hypertension [
13
,
33
]. This overall dietary trend
in China seems to correspond well with the recent economic development and increasing
urbanization that has caused eating behavior change and increased oil consumption among
the Chinese population [21].
Another important finding in our study is that the awareness of CDGs had no signifi-
cant influence on lowering or increasing relative macronutrient intakes. The underlying
reason for the lack of link between CDG knowledge and levels of macronutrient intakes is
not yet understood, but it may be potentially explained by previous qualitative research on
this issue showing that knowledge itself is not enough to influence food choice [
26
]. Some
studies demonstrated that food choice can depend on the reliability of public information
and a broader environment [
34
], suggesting that disseminating CDGs to the public alone
would not significantly improve the nutrient status of Chinese population.
In terms of priorities of a healthy diet, adults who had a higher priority in a healthy
diet were more likely to meet the DRI for macronutrients compared to those who had
lower priority in a healthy diet. This could be interpreted by one study that demonstrated
that personal evaluation or belief in foods, in our case, the priority given to healthy diet,
can influence personal food choice [
26
]. Since one’s food attitude and values placed in a
healthy diet can be developed over time [
26
], it is crucially important to implement dietary
education and intervention targeting people of younger age. Moreover, the finding that
females are having more fat intake than males suggests that women are at higher risk of
developing obesity and other diet-related NCDs compared to men in China. The public
health and nutrition policy might need to enhance the emphasis on maternal diet.

Nutrients 2021, 13, 3044 13 of 15
The strengths of this study include the use of a relatively large sample size and
individual dietary data to assess the overall macronutrient intake status across two regions
in China. It reveals the variations in the macronutrient intake status among Chinese adults
with respect to different sociodemographic, socioeconomic, and lifestyle factors, providing
insights into a more detailed and contextual understanding of adult nutritional status
in different regions and areas. To the best of our knowledge, this is the first study that
incorporated the evaluation of the link between an individual’s diet knowledge and belief
system and macronutrient intake status among Chinese adults.
Nevertheless, our study contains several limitations. Firstly, the CNHS study did not
update the most recent years of nutrition and health survey data since the year 2011; there-
fore, the study year 2011 used in this study is not likely to be the most representative of the
current status of macronutrient intake among Chinese adults. Additionally, the 24 h dietary
data collection method was largely dependent on recall, which is subject to inaccuracy.
Secondly, the predictor variables selected in this study were somewhat subjective, including
the selection of social and lifestyle factors most relevant to the study, and re-labeling and
categorization of some variables. Moreover, the selection of the eight provinces that were
divided into two regions in this study might not be generalized to the entire country. Third,
the nutritional assessment in this study was mainly based on macronutrient composition
that was documented to have different possible health outcomes [
35
], and thus led to bias
without taking specific food groups into account. The analysis of the quality of the food
intakes and dietary pattern in the further study would provide a better understanding of
the nutritional status in China. Since physical activity also seems to be a significant factor
influencing dietary intake, it is valid to expand knowledge in this area [
36
]. The inclusion of
other important variables, such as anthropometric measurements and family incomes [
37
],
in future studies might be more useful and informative for making public health interven-
tions and nutrition policy. Overall, this study adds to the growing body of evidence linking
macronutrient intake status with various important social and lifestyle factors.
5. Conclusions
Using the dietary data from the China Health and Nutrition 2011 Survey, we evaluated
macronutrient intake status among Chinese adults (
≥
20 years) in association with different
sociodemographic, socioeconomic, and lifestyle factors. More than half of the adults met
the DRI for protein intakes, but more than half of the adults had high fat intakes and
low carbohydrate intakes. Only fourteen percent of the adults simultaneously met the
DRI for all three macronutrients. Relative carbohydrate intakes were inversely associated
with relative fat intakes. Higher relative fat and lower relative carbohydrate intakes were
more common among younger adults who lived in urban areas of the southern region,
had higher socioeconomic level, and placed high priority in healthy diet. Having the
knowledge of China Dietary Guidelines had no strong influence on macronutrient intakes.
These findings suggest the inequality of macronutrient intake status among different age
groups, genders, regions, and socioeconomic status. Our results indicate the need for
further analysis of intake status of specific food groups and dietary patterns, as well as for
development of region-specific dietary guidelines aiming to improve dietary quality of
vulnerable populations.
Author Contributions:
Conceptualization, Y.Z. and T.A.; methodology, Y.Z.; software, Y.Z.; formal
analysis, Y.Z.; data curation, Y.Z.; writing original draft, Y.Z.; review and editing, Y.Z.; supervision,
T.A. All authors have read and agreed to the published version of the manuscript.
Funding: This research received no external funding.
Institutional Review Board Statement:
The study was conducted according to the guidelines of the
Declaration of Helsinki, and approved by the Institutional Review Board (or Ethics Committee) of
the University of Tokyo (approval number: 21-71, 12 July 2021).
Informed Consent Statement:
Informed consent was obtained from all subjects involved in the study.

Nutrients 2021, 13, 3044 14 of 15
Data Availability Statement:
The link to publicly archived datasets analyzed in this study is
http://www.cpc.unc.edu/projects/china/about/proj_desc/survey (accessed on 28 July 2021).
Acknowledgments:
This research uses data from China Health and Nutrition Survey (CHNS). We are
grateful for research grant funding from the National Institute for Health (NIH), the Eunice Kennedy
Shriver National Institute of Child Health and Human Development (NICHD) for R01 HD30880,
National Institute of Diabetes and Digestive and Kidney Diseases (NIDDK) for R01DK104371 and
R01HL108427, the NIH Fogarty grant D43 TW009077 for financial support for the CHNS data collec-
tion and analysis files since 1989, and the China-Japan Friendship Hospital, Ministry of Health for
support for CHNS 2009, Chinese National Human Genome Center at Shanghai since 2009, and Beijing
Municipal Center for Disease Prevention and Control since 2011. We thank the National Institute for
Nutrition and Health, China Center for Disease Control and Prevention, Beijing Municipal Center for
Disease Control and Prevention, and the Chinese National Human Genome Center in Shanghai.
Conflicts of Interest: The authors declare no conflict of interest.
References
1.
Joint WHO/FAO Expert, Consultation. Diet, Nutrition and the Prevention of Chronic Diseases. World Health Organ. Tech. Rep. Ser.
2003, 916, 1–149.
2.
Esposito, K.; Maiorino, M.I.; Di Palo, C.; Giugliano, D.; Campanian Postprandial Hyperglycemia Study Group. Adherence to a
Mediterranean Diet and Glycaemic Control in Type 2 Diabetes Mellitus. Diabet. Med. 2009, 26, 900–907. [CrossRef]
3.
Santesso, N.; Akl, E.A.; Bianchi, M.; Mente, A.; Mustafa, R.; Heels-Ansdell, D.; Schünemann, H.J. Effects of Higher- versus
Lower-Protein Diets on Health Outcomes: A Systematic Review and Meta-Analysis. Eur. J. Clin. Nutr.
2012
, 66, 780–788.
[CrossRef] [PubMed]
4.
Schwingshackl, L.; Hoffmann, G. Long-Term Effects of Low-Fat Diets Either Low or High in Protein on Cardiovascular and
Metabolic Risk Factors: A Systematic Review and Meta-Analysis. Nutr. J. 2013, 12, 48. [CrossRef]
5.
Nielsen, J.V.; Joensson, E.A. Low-Carbohydrate Diet in Type 2 Diabetes: Stable Improvement of Bodyweight and Glycemic
Control during 44 Months Follow-Up. Nutr. Metab. 2008, 5, 14. [CrossRef] [PubMed]
6.
Abbasnezhad, A.; Falahi, E.; Gonzalez, M.J.; Kavehi, P.; Fouladvand, F.; Choghakhori, R. Effect of Different Dietary Approaches
in Comparison with High/Low-Carbohydrate Diets on Systolic and Diastolic Blood Pressure in Type 2 Diabetic Patients: A
Systematic Review and Meta-Analysis. Prev. Nutr. Food Sci. 2020, 25, 233–245. [CrossRef]
7.
Siri-Tarino, P.W.; Sun, Q.; Hu, F.B.; Krauss, R.M. Meta-Analysis of Prospective Cohort Studies Evaluating the Association of
Saturated Fat with Cardiovascular Disease. Am. J. Clin. Nutr. 2010, 91, 535–546. [CrossRef] [PubMed]
8.
Billingsley, H.E.; Carbone, S.; Lavie, C.J. Dietary Fats and Chronic Noncommunicable Diseases. Nutrients
2018
, 10, 1385. [CrossRef]
[PubMed]
9.
Burger, K.N.J.; Beulens, J.W.J.; van der Schouw, Y.T.; Sluijs, I.; Spijkerman, A.M.W.; Sluik, D.; Boeing, H.; Kaaks, R.; Teucher, B.;
Dethlefsen, C.; et al. Dietary Fiber, Carbohydrate Quality and Quantity, and Mortality Risk of Individuals with Diabetes Mellitus.
PLoS ONE 2012, 7, e43127. [CrossRef] [PubMed]
10.
Nakamura, Y.; Okuda, N.; Okamura, T.; Kadota, A.; Miyagawa, N.; Hayakawa, T.; Kita, Y.; Fujiyoshi, A.; Nagai, M.;
Takashima, N.; et al. Low-Carbohydrate Diets and Cardiovascular and Total Mortality in Japanese: A 29-Year Follow-up of
NIPPON DATA80. Br. J. Nutr. 2014, 112, 916–924. [CrossRef]
11.
Seidelmann, S.B.; Claggett, B.; Cheng, S.; Henglin, M.; Shah, A.; Steffen, L.M.; Folsom, A.R.; Rimm, E.B.; Willett, W.C.;
Solomon, S.D. Dietary Carbohydrate Intake and Mortality: A Prospective Cohort Study and Meta-Analysis. Lancet Public Health
2018, 3, e419–e428. [CrossRef]
12.
Ho, F.K.; Gray, S.R.; Welsh, P.; Petermann-Rocha, F.; Foster, H.; Waddell, H.; Anderson, J.; Lyall, D.; Sattar, N.;
Gill, J.M.R.; et al. Associations of Fat and Carbohydrate Intake with Cardiovascular Disease and Mortality: Prospective
Cohort Study of UK Biobank Participants. BMJ 2020, 368, m688. [CrossRef]
13. Song, F.; Cho, M.S. Geography of Food Consumption Patterns between South and North China. Foods 2017, 6, 34. [CrossRef]
14. Li, L.T.; Yin, L.J.; Masayoshi, S. Function of traditional foods and food culture in China. JARQ 2004, 38, 213–220. [CrossRef]
15.
Wang, J.; Lin, X.; Bloomgarden, Z.T.; Ning, G. The Jiangnan Diet, a Healthy Diet Pattern for Chinese. J. Diabetes
2020
, 12, 365–371.
[CrossRef]
16.
He, Y.; Li, Y.; Yang, X.; Hemler, E.C.; Fang, Y.; Zhao, L.; Zhang, J.; Yang, Z.; Wang, Z.; He, L.; et al. The Dietary Transition and
Its Association with Cardiometabolic Mortality among Chinese Adults, 1982–2012: A Cross-Sectional Population-Based Study.
Lancet Diabetes Endocrinol. 2019, 7, 540–548. [CrossRef]
17.
Chang, X.; DeFries, R.S.; Liu, L.; Davis, K. Understanding Dietary and Staple Food Transitions in China from Multiple Scales.
PLoS ONE 2018, 13, e0195775. [CrossRef]
18.
Popkin, B.M.; Lu, B.; Zhai, F. Understanding the Nutrition Transition: Measuring Rapid Dietary Changes in Transitional Countries.
Public Health Nutr. 2002, 5, 947–953. [CrossRef]
19.
Batis, C.; Sotres-Alvarez, D.; Gordon-Larsen, P.; Mendez, M.A.; Adair, L.; Popkin, B. Longitudinal Analysis of Dietary Patterns in
Chinese Adults from 1991 to 2009. Br. J. Nutr. 2014, 111, 1441–1451. [CrossRef]

Nutrients 2021, 13, 3044 15 of 15
20.
China Health and Nutrition Survey (CHNS). [Internet]. 2007. Available online: http://www.cpc.unc.edu/projects/china/about/
proj_desc/survey (accessed on 30 July 2021).
21.
Zhai, F.Y.; Du, S.F.; Wang, Z.H.; Zhang, J.G.; Du, W.W.; Popkin, B.M. Dynamics of the Chinese Diet and the Role of Urbanicity,
1991–2011: Chinese Diet’s, 1991–2011. Obes. Rev. 2014, 15, 16–26. [CrossRef] [PubMed]
22. Yang, Y. China Food Composition Table. In Peking: China Institute of Nutriton and Food Safety; China CDC: Beijing, China, 2002.
23. Chinese Nutrition Society. Dietary Guidelines Chinese Residents; Xizang People Publisher: Lasa, China, 2013; p. 6. (In Chinese)
24.
On behalf of the China Kadoorie Biobank (CKB) Collaborative Group; Im, P.K.; Millwood, I.Y.; Guo, Y.; Du, H.; Chen, Y.; Bian, Z.;
Tan, Y.; Guo, Z.; Wu, S.; et al. Patterns and Trends of Alcohol Consumption in Rural and Urban Areas of China: Findings from the
China Kadoorie Biobank. BMC Public Health 2019, 19, 217. [CrossRef]
25.
Conklin, A.I.; Forouhi, N.G.; Surtees, P.; Wareham, N.J.; Monsivais, P. Gender and the Double Burden of Economic and Social
Disadvantages on Healthy Eating: Cross-Sectional Study of Older Adults in the EPIC-Norfolk Cohort. BMC Public Health
2015
,
15, 692. [CrossRef]
26.
Meyer, K.B.; Simons, J. Good Attitudes Are Not Good Enough: An Ethnographical Approach to Investigate Attitude-Behavior
Inconsistencies in Sustainable Choice. Foods 2021, 10, 1317. [CrossRef] [PubMed]
27.
Lee, M.J.; Popkin, B.M.; Kim, S.W. The unique aspect of the nutrition transition in South Korea: The retention of healthful
elements in their traditional diet. Public Health Nutr. 2002, 5, 197–203. [CrossRef]
28.
Zhu, Z.; Yang, X.; Fang, Y.; Zhang, J.; Yang, Z.; Wang, Z.; Liu, A.; He, L.; Sun, J.; Lian, Y.; et al. Trends and Disparities of Energy
Intake and Macronutrient Composition in China: A Series of National Surveys, 1982–2012. Nutrients 2020, 12, 2168. [CrossRef]
29.
Nilsen, L.; Hopstock, L.A.; Skeie, G.; Grimsgaard, S.; Lundblad, M.W. The Educational Gradient in Intake of Energy and
Macronutrients in the General Adult and Elderly Population: The Tromsø Study 2015–2016. Nutrients
2021
, 13, 405. [CrossRef]
[PubMed]
30.
Feng, L. New Trends in China’s Regional Economic Development. In Regional Economic Development in China; Saw, S.-H., Wong, J.,
Eds.; ISEAS Publishing: Singapore, 2009; pp. 9–27.
31.
Mukhopadhyay, K.; Thomassin, P.J. Economic Impact of Adopting a Healthy Diet in Canada. J. Public Health
2012
, 20, 639–652.
[CrossRef]
32.
Zhao, L.; Stamler, J.; Yan, L.L.; Zhou, B.; Wu, Y.; Liu, K.; Daviglus, M.L.; Dennis, B.H.; Elliott, P.; Ueshima, H.; et al. Blood Pressure
Differences Between Northern and Southern Chinese: Role of Dietary Factors: The International Study on Macronutrients and
Blood Pressure. Hypertension 2004, 43, 1332–1337. [CrossRef] [PubMed]
33.
Yang, G.; Wang, Y.; Zeng, Y.; Gao, G.F.; Liang, X.; Zhou, M.; Wan, X.; Yu, S.; Jiang, Y.; Naghavi, M.; et al. Rapid Health Transition
in China, 1990–2010: Findings from the Global Burden of Disease Study 2010. Lancet 2013, 381, 1987–2015. [CrossRef]
34.
Hobson, K. Thinking habits into action: The role of knowledge and process in questioning household consumption practices.
Local Environ. 2003, 8, 95–112. [CrossRef]
35.
Shan, Z.; Guo, Y.; Hu, F.B.; Liu, L.; Qi, Q. Association of Low-Carbohydrate and Low-Fat Diets with Mortality among US Adults.
JAMA Intern. Med. 2020, 180, 513. [CrossRef] [PubMed]
36.
Kim, Y.J.; Hwang, J.-Y.; Kim, H.; Park, S.; Kwon, O. Diet Quality, Physical Activity, and Their Association with Metabolic
Syndrome in Korean Adults. Nutrition 2019, 59, 138–144. [CrossRef] [PubMed]
37.
Doak, C.; Adair, L.; Bentley, M.; Fengying, Z.; Popkin, B. The Underweight/Overweight Household: An Exploration of Household
Sociodemographic and Dietary Factors in China. Public Health Nutr. 2002, 5, 215–221. [CrossRef] [PubMed]
