
Page 1 GAO-24-106056 Economic Downturns
During economic downturns, the federal government can use tax and spending
policies to support economic growth and limit the detrimental effects on
individuals and families. The federal budget contains mechanisms—known as
automatic stabilizers— that alter tax and spending levels in response to changes
in economic conditions without direct intervention by policymakers. For example,
in an economic downturn—when incomes and the employment level fall—tax
liabilities may decrease, and more people may become eligible for certain
government benefits, such as unemployment insurance and food assistance.
Conversely, when incomes and the employment level rise, tax liabilities may rise,
and fewer people may be eligible for government benefits.
Given the key role that automatic stabilizers can play in supporting the economy
and the well-being of individuals and families, it is important to understand how
effectively they are operating.
It is also important to understand their impact on
the broader federal budget. We have previously reported that the federal
government faces an unsustainable long-term fiscal future. Debt held by the
public is projected to exceed its historical high of 106 percent of gross domestic
product (GDP) within the next 10 years. Well-designed automatic stabilizers
could help the federal government balance the short-term need to promote
growth during an economic downturn with longer term concerns about fiscal
sustainability.
You asked us to review several issues related to automatic stabilizers. This
report examines the effects of automatic stabilizers on the economy, the well-
being of individuals and families, and the federal government’s fiscal condition,
based on an extensive review of academic and government literature.
• Studies we reviewed showed that automatic stabilizers reduced the
detrimental effects of recent economic downturns. They prevented the
economy from getting worse by generating additional economic activity.
• Studies showed that during economic downturns, programs with an automatic
stabilizer component had various positive effects on the well-being of
individuals and families, such as alleviating poverty and supporting positive
health outcomes including improved nutrition and healthy birth weights.
However, it is difficult to isolate the effects of automatic stabilizers, because
studies frequently did not separately analyze the automatic portions of these
programs and discretionary changes made by policymakers to address
economic downturns.
• Automatic stabilizers contributed to federal deficits in the wake of recent
economic downturns, according to Congressional Budget Office (CBO)
analysis. However, they are not the key driver of debt over the long-term.
U.S. Government Accountability Office
Economic Downturns
: Effects of Automatic
Spending Programs
and Taxes
GAO
-24-106056
Report to Congressional
Requesters
November
16, 2023
Why This Matters
Key Takeaways

Page 2 GAO-24-106056 Economic Downturns
Automatic stabilizers can be taxes or spending programs that automatically
adjust based on economic conditions. Figure 1 provides examples of how tax
provisions and spending programs work as automatic stabilizers and affect the
economy.
Figure 1: Effects of Automatic Stabilizers during Economic Downturns
In general, the economy goes through alternating periods of upswings—or
expansions—and downturns—or contractions. This pattern is commonly referred
to as the business cycle.
1
A recession is a specific type of economic downturn.
The National Bureau of Economic Research (NBER) defines a recession as a
significant decline in economic activity that is spread across the economy and
that lasts more than a few months.
2
According to NBER, while all criteria need to
be met to some degree, extreme conditions in any one criterion may offset
another. For example, in the case of the most recent recession in March and
April 2020, driven by the COVID-19 pandemic, NBER concluded that the drop in
economic activity had been so great and so widely diffused that the downturn
should be classified as a recession despite its brevity. NBER defines an
economic expansion as occurring after the economy reaches its lowest point and
economic activity begins to increase.
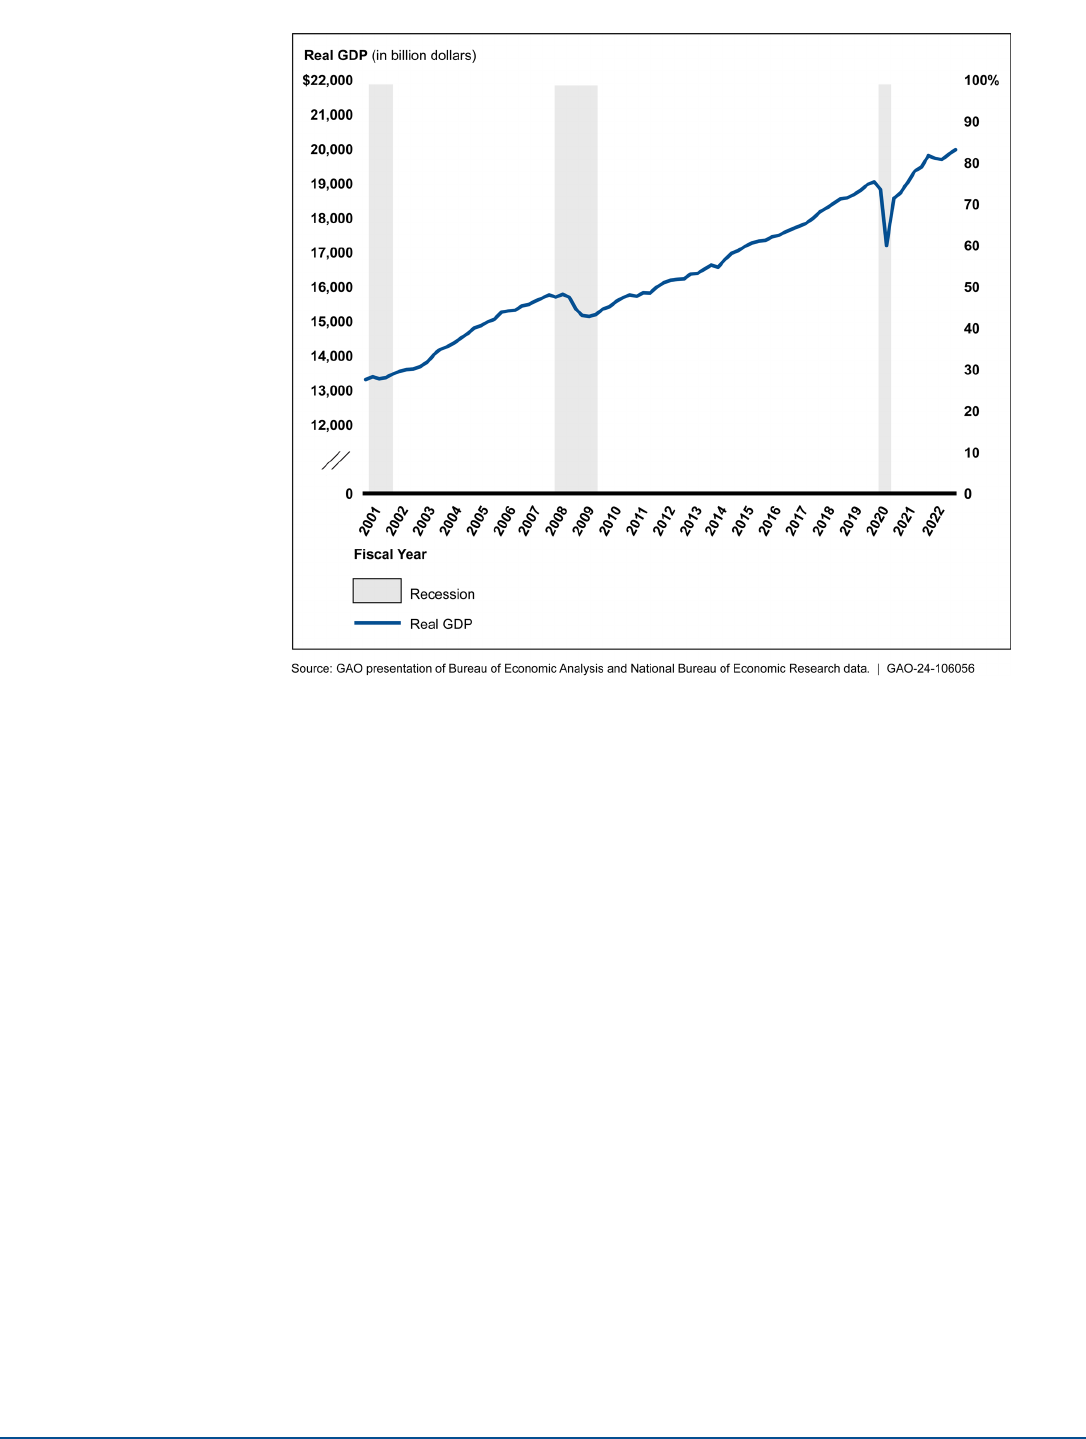
Since 2000, the U.S. economy has experienced three recessions. Figure 2
shows changes in GDP since 2001, as well as the dates of recessions as
determined by NBER. After a recession officially ends, it may take time for the
economy to return to its pre-recession level of activity. For example, after the
Great Recession ended in June 2009, the economy, as measured by GDP, did
not return to its pre-recession level until late 2010.
How do automatic
stabilizers
work?
When is an economic
downturn categorized
as a recession?
Page 3 GAO-24-106056 Economic Downturns
Figure 2: Gross Domestic Product (GDP), Fiscal Years 2001–2022
The effects of a recession on unemployment and wages can also extend beyond
the official recession dates as determined by NBER. For example, the
unemployment rate continued to increase for 5 months after NBER determined
the 2001 recession had ended, as shown in figure 3.

Page 4 GAO-24-106056 Economic Downturns
Figure 3: Seasonally Adjusted Unemployment Rate, Fiscal Year 2001–2022
a
Seasonal adjustment removes seasonal patterns to compare data across months. Monthly unemployment is
generally reported as seasonally adjusted data.
The federal government has two broad sets of tools that it can use to mitigate the
effects of economic downturns and promote growth.
• Monetary policy, such as lowering interest rates, can encourage economic
activity. Monetary policy is directed by the Federal Reserve and includes
policies that affect the money supply, interest rates, and credit availability.
• Fiscal policy, such as increasing government spending, lowering tax
revenue, or some combination of both, can also encourage economic activity.
In addition to automatic stabilizers, Congress and the President can make
temporary changes to taxes or spending programs—referred to as
discretionary fiscal policy. For example, the federal government provided over
$4.6 trillion in response to COVID-19, including for programs aimed at
addressing the rapid and severe economic downturn caused by the
pandemic.
Figure 4 summarizes how these tools are used to promote growth during
economic downturns.
What tools does the
federal government
have to respond to
economic downturns?

Page 5 GAO-24-106056 Economic Downturns
Figure 4: Tools to Counter Economic Downturns
The relative effectiveness of automatic stabilizers in promoting economic growth
depends, in part, on prevailing interest rates in the economy. During economic
downturns, the Federal Reserve can take actions to lower the federal funds rate,
which influences other interest rates in the economy, thereby promoting lending
and economic growth.
3
During the Great Recession and the onset of the COVID-
19 pandemic, the federal funds rate was consistently near zero.
This limited the
Federal Reserve’s ability to use one of its key monetary policy tools to lower
interest rates to promote growth. In such cases, fiscal policy, including automatic
stabilizers, tends to have a comparatively larger impact on economic activity.
Studies we reviewed noted that automatic stabilizers likely played an especially
important role in supporting the economy during periods where the federal funds
rate was consistently near zero, such as during the Great Recession and the
COVID-19 pandemic recession.
4
Once the economy begins to recover,
policymakers may choose to increase interest rates, decrease spending, or
increase tax revenue to prevent the economy from growing too quickly and
causing inflation.
Automatic Tax-Related Functions in Economic Downturns
•
Individual income tax: As taxpayers’ income declines, they owe
less in taxes. Additionally, the tax rates applied to their income
can drop due to the progressive tax rate structure, further
lowering the amount they owe.
•
Payroll tax: As employment and wages fall, workers and
employers pay less in payroll taxes.
• Corporate income tax: As profits decrease, corporations owe less
taxes.
• Production and import taxes: As consumption of goods declines, production and import taxes may
decrease.
Source: GAO analysis of Congressional Budget Office, Congressional Research Service, and Internal Revenue Service information (text); Michael
Flippo/stock.adobe.com (photo). | GAO-24-106056
Multiple taxes act as automatic stabilizers by lowering taxes when incomes fall
and raising taxes when incomes rise. According to CBO, the major types of taxes
that act as automatic stabilizers are (1) individual income tax, (2) payroll taxes
(taxes that pay for Medicare, Social Security, and unemployment insurance), (3)
corporate income tax, and (4) taxes on production and imports. CBO data shows
that these taxes account for nearly all federal revenue.
What are the main tax-
related automatic
stabilizers?

Page 6 GAO-24-106056 Economic Downturns
The individual income tax is the largest automatic stabilizer in the federal budget.
The U.S. has a generally progressive rate structure for its income tax, meaning
that it applies lower tax rates at lower income levels and higher tax rates at
higher income levels. Progressive income tax systems, which have higher tax
rates for higher levels of income, act as automatic stabilizers because they
moderate fluctuations in after-tax income. When a taxpayer’s income declines in
an economic downturn, the top tax rate applied to their income may be reduced.
As a result, they experience less change to after-tax income, which reduces the
effect of income loss on spending.
Social Security and Medicare payroll tax amounts are based on the taxable
earnings of workers. These taxes are paid by employers, employees, and the
self-employed and are generally a percentage of earnings. Unemployment
insurance taxes are paid by employers to states based on worker earnings.
When earnings decline in an economic downturn, the amount of tax paid on
those earnings also declines.
There are three major spending programs in the U.S. that act as automatic
stabilizers, according to CBO analysis:
• Unemployment Insurance (UI),
•
Supplemental Nutrition Assistance Program (SNAP), and
•
Medicaid.
5
Unemployment Insurance
Automatic Unemployment Insurance Functions in
Economic Downturns
•
Enrollment increases as more individuals lose jobs and become
eligible for UI.
•
Eligibility period lengthens when state unemployment rate meets
the trigger for Extended Benefits.
Source: GAO analysis of Congressional Research Service and Department of Labor information (text); Lane Erickson/stock.adobe.com (photo). |
GAO-24-106056
UI is a joint federal-state program that provides temporary financial assistance to
eligible workers who have become unemployed through no fault of their own. UI
benefits are funded primarily through taxes that states levy on employers.
According to the Department of Labor, UI program administration is financed
through a federal tax on employers, and the benefits replace a portion of a
claimant’s previous employment earnings.
6
UI use surged at the onset of the
COVID-19 pandemic, as initial UI claims rose nearly 3,000 percent from about
200,000 per week to more than 6 million per week during late-March and early-
April 2020.
7
The UI program also includes an Extended Benefits program where states
extend unemployment insurance benefits for up to an additional 13 weeks when
their unemployment rates meet a certain threshold.
8
The federal government
funds 50 percent of payments under the Extended Benefits program as part of
normal UI operation. However, federal funding for UI claims and Extended
Benefits can vary depending on temporary changes in law enacted in response
to economic downturns.
9
What are the main
spending
-related
automatic stabilizers?

Page 7 GAO-24-106056 Economic Downturns
Supplemental Nutrition Assistance Program
Automatic Supplemental Nutrition Assistance Program
Functions in Economic Downturns
• Enrollment increases as incomes fall and more people become
eligible and apply for SNAP.
•
Benefits are calibrated to income, so as incomes fall, benefit
amounts can increase (up to maximum threshold).
Source: GAO analysis of U.S. Department of Agriculture information (text); https://www.fns.usda.gov/snap/logo-guidance (image). | GAO-24-106056
SNAP provides food benefits to low-income families to supplement income and
benefits so they can afford nutritious food. The benefit is funded by the federal
government, with administrative costs shared by states.
10
Average participation
in SNAP rose by 16.6 percent during the economic downturn caused by the
COVID-19 pandemic, from 35.7 million for fiscal year 2019 to 41.6 million for
fiscal year 2021.
11
SNAP benefit eligibility and amounts are determined by a
household’s income and assets.
Medicaid
Automatic Medicaid Functions in Economic Downturns
•
Enrollment increases as incomes fall and more people become
eligible.
•
Enrollment may increase as people become unemployed and lose
employer-provided health insurance.
Source: GAO analysis of Congressional Research Service and Health and Human Services information(text); WDnet Studio/stock.adobe.com
(photo). | GAO-24-106056
Medicaid finances health care coverage for millions of low-income and medically
needy people.
12
Medicaid is jointly funded by the federal government and states,
with the federal government matching state expenditures based on a statutory
formula that covers at least half of states’ expenditures. Enrollment for Medicaid
rose by 15.7 percent from before the economic downturn caused by the COVID-
19 pandemic, from nearly 64.1 million in February 2020 to more than 74.1 million,
in the aftermath of this economic downturn, in February 2021.
13
Temporary Changes to Automatic Stabilizer Programs
Discretionary fiscal policy during recent economic downturns included temporary
changes to automatic stabilizer programs.
14
For example, during the Great
Recession and the COVID-19 pandemic, Congress and the president made the
following temporary changes:
• UI. Increased benefit amounts, expanded benefits to new groups, and
extended the length of time a person could receive benefits.
15
• Medicaid. Increased federal share of funding. To receive the increased
funding, states and territories were required to meet certain conditions, such
as maintaining Medicaid enrollment during the COVID-19 public health
emergency.
• SNAP. Suspended certain eligibility and state recertification requirements
and increased benefit amounts.
16

Page 8 GAO-24-106056 Economic Downturns
Preventing Further Economic Decline
Studies we reviewed found that, overall, automatic stabilizers limited the depth of
economic downturns.
17
• One such study found that between 1970 and 2015, automatic stabilizers
helped smooth fluctuations in economic activity.
18
Specifically, annual GDP
growth would have been 0.82 percentage points lower during recessions
without automatic stabilizers.
19
Conversely, during periods of economic
expansion, annual GDP growth would have been 0.13 percentage points
higher without automatic stabilizers.
20
• Another study found that over 2008–2009, U.S. GDP would have been 0.75
percent lower without automatic stabilizers.
21
• Both studies considered the total effect of automatic stabilizers at the federal,
state, and local levels of government, which exceeds the effect of federal
automatic stabilizers alone. Moreover, their findings are sensitive to
assumptions regarding the spending and saving behavior of households and
businesses affected by automatic stabilizers.
Generated Additional Economic Activity
There is some evidence that automatic stabilizers can generate a larger
economic effect than the amount initially spent—known as a multiplier effect. The
multiplier is the ratio of the resulting economic activity to the change in program
spending. For example, as program enrollees spend SNAP and UI benefits,
additional income is generated for individuals and business involved in the
production and distribution of goods and services. This dynamic can create a
cycle of increased spending in the economy, particularly when the economy is
not operating at full capacity.
One study we reviewed estimated the one-year multiplier of SNAP spending
during economic downturns to be 1.5.
22
In other words, every $1 spent on SNAP
during the year would generate $1.50 in economic activity. Another study—
focused on the Great Recession—estimated a slightly larger SNAP multiplier
early in the recession. The study pointed out that multipliers tend to be larger
when the economy is operating far below its potential.
Other studies we reviewed found UI multipliers between 1 and 1.9.
23
Multiplier
estimates vary, in part, because the studies all relied on different economic
models and assumptions. Moreover, some of the studies made no distinction
between automatic and discretionary SNAP or UI spending and others focused
exclusively on discretionary increases.
The effects of UI on unemployment rates are influenced by multiple factors. For
example, UI benefits can potentially create a disincentive for individuals to seek
employment, which could increase the unemployment rate. However, by
sustaining consumption by households that suffered job loss, UI benefits can
also increase demand for goods and services, thus bolstering economic activity
and reducing the unemployment rate. At the same time, UI tax penalties levied
on employers that have laid off workers in the past can help prevent additional
layoffs. We reviewed a number of studies that measured how changes to UI
benefits affected the unemployment rate during the Great Recession, but we did
not find any focused on the more recent COVID-19 pandemic recession at the
time of our review.
How have automatic
stabilizers affected the
economy during recent
economic downturns?
How has
unemployment
insurance affected
the
un
employment rate?

Page 9 GAO-24-106056 Economic Downturns
UI benefits had mixed but generally limited effects on the unemployment rate,
based on studies that we reviewed. One study used labor market data to
compare adjacent counties in neighboring states and found no evidence that
state-level UI benefit extensions substantially affected employment during the
Great Recession.
24
This study estimated that UI benefit extensions did not
change the county-level employment to population ratio by more than 0.35
percentage points. We also reviewed studies that were more dependent on
assumptions about economic behavior to estimate these effects; the results were
mixed, ranging from reducing unemployment by 0.4 percentage points to
increasing the unemployment rate by 1.4 percentage points.
25
These estimates
vary in part due to differences in the assumptions applied.
Unemployment Insurance Taxes
Employers’ state UI tax rates can vary depending in part on their past
experience laying off workers who subsequently receive UI benefits, commonly
called their experience rating. A higher experience rating leads to higher UI tax
rates.
Source: GAO analysis. | GAO-24-106056
One study found that UI taxes may also affect the unemployment rate.
26
The
study showed that states where firms faced higher UI tax penalties for dismissing
workers saw smaller employment responses to national economic shocks
between 2001 and 2019. The study estimated that, because tax increases
associated with higher experience ratings create a disincentive for firms to lay off
workers, experience ratings prevented an additional rise in unemployment during
the Great Recession.
27
Studies we reviewed found that expansions to UI benefits during the early 2000s
recession and Great Recession, including increases to benefit amounts and
duration, had limited to modest effects on the length of unemployment spells and
could lead to better job matches. For example, studies:
• found that a 10-week extension in UI benefits increased average periods of
unemployment for eligible workers by 1.5 weeks, with little variation between
the Great Recession and the early 2000s recession;
28
• estimated that increasing the UI maximum duration by 20 weeks lead to a
2.5-week increase in unemployment duration;
29
and
• estimated that a 10 percentage point increase in the share of workers’
income replaced by UI benefits increased unemployment duration by 0.5
weeks.
30
Two studies we reviewed developed models that assessed how changes to UI
benefit amounts and duration potentially affect unemployment duration.
31
Namely, as UI generosity (maximum benefit and duration) increases, eligible,
unemployed workers have reduced incentives to search for jobs, which may
increase their duration of unemployment. However, these models rely on a set of
simplifying assumptions that may not completely capture all the impacts of
increased UI generosity. For example, as UI recipients spend benefits and
stimulate the local economy, individuals not eligible for UI may be more likely to
find employment than if UI had not been expanded.
Another study noted that UI extensions that took place from 2000-2013 allowed
individuals to search longer, eventually leading to job matches of better quality.
32
This study’s estimates suggest that UI benefit extensions increased earnings for
workers transitioning out of unemployment. This outcome was especially true for
Do adjustments to
unemployment
insurance
during
economic downturns
affect
individuals’
unemployment
outcomes
?

Page 10 GAO-24-106056 Economic Downturns
workers with less access to credit, who saw an even higher match quality and an
increased probability of staying at their eventual job following reemployment.
These findings are consistent with our June 2022 report, which examined studies
that analyzed the relationship between expanded UI benefits and workers’
incentives to return to work.
33
We found that expanded UI benefits had limited
disincentive effects on workers’ decisions to return to work. Specifically, the
studies we reviewed for that report either found that expanded UI had no
disincentive effects or, if they found some effect, it was limited to a small group of
workers.
Researchers found that UI, SNAP, and other social safety net programs helped
prevent rises in poverty and declines in income during recent economic
downturns.
34
However, these studies typically did not separate discretionary
changes in program benefits from regular benefits. The studies also did not
typically account for behavioral responses from benefit recipients, such as
decisions about spending versus saving or the number of hours worked, in
evaluating what outcomes would have occurred in the absence of these
programs.
35
Social Safety Net. Programs that assist low-income individuals and families with cash
aid, food, shelter, health care, and other supports. While studies we reviewed varied in
the set of programs considered as part of the social safety net, they all included SNAP,
UI, and the Earned Income Tax Credit (EITC).
Source: GAO analysis of relevant literature. | GAO-24-106056
Alleviated Poverty
Studies we reviewed found that SNAP and UI—both regular benefits and
discretionary changes—helped prevent rises in poverty and helped moderate
income fluctuations during recent recessions.
• SNAP helped the poorest households moderate income fluctuations and,
during the Great Recession, was particularly effective in reducing deep
poverty (an income at or below 50 percent of the poverty line) as well as
poverty among households with children.
36
• UI also helped keep people out of poverty. One study looking at the poverty
rate during the COVID-19 pandemic found this rate declined by 1.5
percentage points between January and June 2020.
37
The study found that,
without regular and expanded UI benefits, poverty would have instead risen
by 0.8 percentage points. Another study found that, across the 2001
recession and the Great Recession, workers who exhausted UI benefits saw
family poverty rates rise substantially and other social safety net programs
only made up for a small fraction of lost UI income.
38
One study we reviewed found that UI replaced earnings during economic
downturns, but the effect varied over time.
39
Specifically, a study found that in
2020, during the COVID-19 pandemic, UI payments replaced all the earnings lost
for over half of UI beneficiaries. In comparison, in 2009, amid the Great
Recession, UI payments replaced all the earnings lost for 19 percent of UI
beneficiaries.
40
How have automatic
stabilizer programs
affected income,
poverty, and wealth?

Page 11 GAO-24-106056 Economic Downturns
Effects Varied Across Demographic Groups
Studies we reviewed found that the effects of social safety net programs varied
more broadly across demographic groups and income levels.
41
For example,
studies found
• the reduction in household income variability after receiving benefits was the
largest among the following types of families: low-income, female-headed,
Black, and those with less education; and
42
• the social safety net reduced the extent to which income in households with
children changed as the unemployment rate changed.
43
However, the social safety net seemed to have had no mitigating effect on
poverty for children in households with immigrant heads.
44
Sustained Home Values
Studies we reviewed found that more generous UI benefits during the Great
Recession reduced mortgage delinquency and foreclosures.
45
These studies
compared housing market outcomes across states with varying UI generosity.
One study found that longer extended UI duration reduced mortgage delinquent
balances as long as homes had not lost value.
46
Another study found that higher maximum extended UI benefits reduced
mortgage delinquency and foreclosures among displaced workers.
47
Consequently, the expansion of UI benefits during the Great Recession stabilized
the housing market by moderating the decline in home values in areas with rising
unemployment. Specifically, while states with the least generous UI benefits saw
home values decline with rising county-level unemployment rates, this did not
occur in states with the most generous UI benefits.
Automatic stabilizer programs generally limited the rise of food insecurity (lack of
access to enough food for an active, healthy life) during economic downturns but
did not fully address increased need.
48
Studies we reviewed suggested that
SNAP helped protect against food insecurity during the Great Recession and
COVID-19 pandemic.
49
For example, one study estimated that if SNAP were not
available, self-reported food hardship would have increased by as much as 8.4
percentage points during the Great Recession, relative to the observed increase
of 2.6 percentage points.
50
In addition, another study showed that, during the
COVID-19 pandemic, self-reported food insufficiency rates declined following a
discretionary 15 percent increase to SNAP benefits in January 2021.
51
Medicaid expansion—as authorized by the Patient Protection and Affordable
Care Act—was also associated with a reduced risk of food insecurity during the
pandemic.
52
Specifically, one study found that newly unemployed workers in
states that expanded Medicaid were less likely to experience moderate or severe
food insecurity following job loss relative to unemployed workers in states that did
not expand Medicaid.
53
However, it is unclear whether Medicaid expansion
caused lower rates of food insecurity, in part because other social safety net
programs may be present in states that expanded Medicaid.
Social safety net programs did not fully address food insecurity during the
COVID-19 pandemic. For example, in October 2021, following the September
2021 expiration of more generous UI payments, the number of households that
reported not having enough to eat began to rise steadily.
54
One study found three
explanations of why social safety net programs did not fully address food
insecurity and other measures of economic hardship during the pandemic:
55
How have automatic
stabilizer programs
affected food
insecurity?

Page 12 GAO-24-106056 Economic Downturns
• Barriers to early financial relief, such as delays resulting from overwhelmed
state UI systems, slow implementation of discretionary changes in programs
by the states, and application requirements.
56
• The relatively small magnitude of SNAP spending compared to UI spending.
For example, the study identified that UI payments had increased to an
average of $23.5 billion per week from May through July 2020. During the
same time frame, SNAP payments increased to an average of about $1
billion per week.
• Coverage gaps for some groups that were excluded from social safety net
programs, including unemployed workers who did not receive UI.
Provided Health Insurance
Studies consistently found higher rates of health insurance coverage following
job loss in states with expanded or more generous Medicaid benefits.
57
Specifically, studies found
• during the COVID-19 pandemic, the rate of increase in the number of people
without health insurance due to job loss was lower in states that expanded
Medicaid (2.9 percent increase in uninsurance) than in states that did not
expand Medicaid (10.7 increase in uninsurance).
58
• during the Great Recession, as unemployment rates increased, individuals in
states with less generous Medicaid eligibility guidelines were more likely to
become uninsured.
59
Comparing insurance outcomes across states may partially reflect systematic
differences across states that are not directly related to Medicaid generosity,
such as state-level differences in the administration of other safety net programs.
Supported Positive Health Outcomes
Studies found more generous Medicaid, UI, and SNAP benefits to be associated
with better health outcomes.
Medicaid. In one study, during the COVID-19 pandemic, individuals who recently
lost jobs and lived in states that expanded Medicaid were more likely to be
covered by Medicaid and less likely to suffer from severe mental distress relative
to those living in states that did not expand Medicaid.
60
One study examined the
role of Medicaid in mitigating the association between unemployment and
adverse birth outcomes during the 2001 recession and Great Recession.
61
This
study found that Medicaid generosity reduced the degree to which
unemployment was associated with adverse birth outcomes, and this reduction
was strongest among Black mothers.
62
UI. Another study found that higher discretionary UI generosity was associated
with better birth outcomes, especially among less educated and unmarried
mothers.
63
This study, using data from 1970–2019, estimated that a one standard
deviation increase in benefit caps was associated with a 3.4 percent increase in
average birth weight.
64
A separate study found that when UI replaces a greater
share of recipients’ former income, recipients are more likely to have health
insurance coverage and use health care.
65
During economic downturns, these
effects were stronger and accompanied by improvements in self-reported health
status.
How have automatic
stabilizer programs
affected people’s
health?

Page 13 GAO-24-106056 Economic Downturns
SNAP. Two studies we reviewed explored the benefits of SNAP in improving
health outcomes. In one study, individuals living in states where SNAP was more
generous and easier to access were more likely to be in better overall self-
reported health.
66
Another study summarized a round table discussion of federal,
think tank, and academic researchers.
67
Round table participants discussed
findings from their research that linked SNAP to improved health outcomes, such
as a reduction in childhood obesity, through better nutrition and reduced stress.
Earned Income Tax Credit (EITC)
The EITC supplements earnings for low- to moderate-income workers and working
families by providing a tax credit based on earnings from work. The amount of the
credit grows with additional earnings up to a maximum threshold, plateaus, and then
decreases with earnings beyond that threshold. The EITC is neither available for
families that did not earn any income in a given tax year, nor for high-income workers.
Source: GAO analysis of Internal Revenue Service information. | GAO-24-106056
Studies we reviewed found that the EITC has a mixed record as an automatic
stabilizer.
68
Specifically, two studies found that overall, more low-income workers
became eligible for the EITC during economic downturns.
69
However, these
studies also found that certain types of families and individuals, such as highly
educated individuals, were more likely to become eligible for the credit, while
others lost eligibility.
One study used tax and census data from 2005 to 2011 and found that workers
with reduced income from employment may gain eligibility for the credit or qualify
for a larger tax credit than they would have received otherwise.
70
The study also
found that unmarried women with less education were less likely than those with
more education to become eligible due to a decrease in earnings. The study also
found that married taxpayers where one working spouse lost employment could
become eligible. On average, less educated single mothers with children were
more likely to lose employment for an entire tax year and therefore lose eligibility
for the credit.
The other study analyzed state and federal data from 1996 to 2008 and found
that, overall, more taxpayers claim the EITC during economic downturns.
71
This
study found that married taxpayers who may have seen reduced earnings for one
spouse may become eligible for the EITC. The study also found that highly
skilled individual taxpayers with reduced earnings may become eligible for the
EITC during economic downturns.
As with most federal programs, automatic stabilizer programs operate throughout
the business cycle. They represent expenditures in the federal budget even when
the economy is doing well. When the economy is not operating at its full
potential, more people become eligible for UI, SNAP, and Medicaid, and the
government spends more on these programs.
Similarly, federal tax revenues are higher when the economy is operating at its
full potential and lower when it is not. For example, revenues from individual
income taxes dropped 22 percent amid the Great Recession and its aftermath,
from $1.1 trillion in 2008 to $899 billion in 2010.
72
Automatic stabilizers increased the federal budget deficit in all but 5 years
between 2001 and 2022, in amounts ranging from 0.1 to 2.2 percent of GDP (see
fig. 5.) Automatic stabilizers helped increase the budget surplus in 2001 and
reduced the deficit in 2006 and 2007 by amounts ranging from 0.1 to 0.3 percent
To what extent does the
EITC
act as a stabilizer
d
uring economic
downturns
?
How do automatic
stabilize
rs affect the
federal budget
?

Page 14 GAO-24-106056 Economic Downturns
of GDP. In 2005 and 2008, automatic stabilizers did not significantly increase or
decrease the deficit.
CBO projects that automatic stabilizers will continue to increase federal deficits
through 2033, though their effects will be strongest in the first half of that period.
In the second half of that period, CBO projects that economic conditions will
reach their long-run historical average values, which will reduce the effects of
automatic stabilizers on the federal budget deficit.
Figure 5: Contribution of Automatic Stabilizers to the Federal Budget Deficit as a Share of
Potential Gross Domestic Product (GDP), Fiscal Years 2001–2033
The full effect of automatic stabilizers on the federal budget is not known
because the studies we reviewed do not capture all ways in which the economic
changes that result from automatic stabilizers may affect federal spending and
revenues. As noted above, studies find that during economic downturns,
automatic stabilizers support income, employment, and economic output. These
effects can then lead to improved budgetary conditions as revenue increases and
the need for spending is reduced. Therefore, there may be fiscal effects of
automatic stabilizers that have not been precisely measured.
73
While automatic stabilizers have contributed to budget deficits in recent years,
they are not the key driver of federal debt over the long term. In May 2023, we
reported that increasingly large budget deficits were driving unsustainable debt
levels.
74
Large annual budget deficits occur because spending is increasing more
than revenue and the government is spending more on interest to service its
growing debt.
In fiscal year 2022, automatic stabilizers contributed $67 billion to the federal
budget deficit, according to CBO. However, the federal budget deficit was almost
$1.4 trillion that year, the fourth-largest recorded nominal federal deficit in history
To what extent do
automatic stabilizers
contr
ibute to federal
debt over the
long
term
?

Page 15 GAO-24-106056 Economic Downturns
behind the budget deficits in fiscal years 2021, 2020, and 2009, all periods of
economic distress.
The gap between revenue and spending is expected to increase in the coming
years, in large part because of the projected increases in Medicare, other federal
health care, and Social Security program spending, and net interest spending
compared to relatively lower projected increases in revenue.
75
Federal health
care and Social Security spending are rising because the population is aging and
health care is getting more expensive. As a result of these factors, debt held by
the public is expected to exceed its historical high of 106 percent of GDP within
the next 10 years. We have previously suggested that Congress develop a plan
to address the government’s fiscal outlook and promote fiscal sustainability.
76
We provided excerpts of a draft of this report to CBO for review and comment.
CBO staff provided technical comments, which we incorporated as appropriate.
We also provided informational copies of a draft of this report to the Department
of the Treasury and the Office of Management and Budget.
This report examines the effects of automatic stabilizers on the economy, the
well-being of individuals and families, and the federal government’s fiscal
condition.
To describe automatic stabilizers, relevant federal programs, and economic
concepts, we reviewed our prior reports, federal agency information, and CBO
and Congressional Research Service publications.
To identify the economic and well-being effects of automatic stabilizers, we
conducted a literature review, beginning with a literature search for studies that
analyzed the relationship between automatic stabilizer programs and the
economy or well-being. We focused our search on articles that analyzed the
effects of automatic stabilizers during recent economic downturns or intervening
periods of economic growth, from 2001 to 2022.
We also used keyword searches to identify well-being outcomes associated with
key automatic stabilizer programs. Key words included wealth, poverty,
employment, health insurance, hunger, and food security. We searched multiple
databases to identify relevant articles, including Scopus, EconLit, Proquest
Sociology Collection, Proquest SciTech Premium Collection, Proquest Policy File
Index, Proquest Dialog Social SciSearch and the U.S. Department of Commerce
National Technical Reports Library. Our searches identified 319 documents from
peer reviewed journals, government-issued reports, working papers, and
publications from nongovernmental organizations.
We also identified 69 documents based on expert recommendations, searches
for related CBO, Congressional Research Service, and inspector general work;
relevant article citations; and our own prior work. Overall, our literature search
contained 388 documents. To assess the relevance of these documents, a policy
analyst and an economist or methodologist separately reviewed each article to
agree on relevance. We considered articles relevant if the articles (1) described
automatic stabilizers’ effect on the U.S. economy or the well-being of individuals
or families in the U.S., or (2) described how automatic stabilizers have affected
the federal government’s fiscal condition from 2001 through 2020.
To assess methodological quality and determine whether an article was
appropriate to include in the literature review, two economists independently
conducted in-depth reviews. These in-depth reviews entailed an assessment of
each study’s research methodology, including its data quality (when applicable),
research design, and analytic techniques, as well as a summary of each study’s
Agency Comments and
Third
-Party Views
How GAO Did This
Study

Page 16 GAO-24-106056 Economic Downturns
major findings and conclusions. We also assessed the extent to which each
study’s data and methods supported its findings and conclusions. We prioritized
studies based on their methodological soundness and use of empirical data
analysis. We determined that 41 articles were relevant and appropriate for our
analysis. See the bibliography for a full list of relevant articles.
Our report presents findings from the body of knowledge included in these
articles. To the extent that findings from these articles vary, we mention the
differences in our report. All studies have limitations and to varying extents make
assumptions about behaviors and how the economy works. Despite these
limitations, we determined that the studies we included provide reliable
information about the effects of automatic stabilizers.
To describe changes in economic conditions over time and periods of economic
downturn, we reviewed data on the business cycle, GDP, and unemployment
rate. Specifically, we used data from 2001 to 2022 from the National Bureau of
Economic Research, Bureau of Economic Analysis, and Bureau of Labor
Statistics.
To describe the extent to which automatic stabilizers have affected the federal
government’s fiscal condition since 2001, we reviewed data and analysis
published by CBO, reviewed research from the Federal Reserve System, and
spoke with CBO and Federal Reserve System staff.
We assessed the reliability of all sources of data and found them to be
sufficiently reliable for the purposes of this report.
We conducted this performance audit from May 2022 to November 2023 in
accordance with generally accepted government auditing standards. Those
standards require that we plan and perform the audit to obtain sufficient,
appropriate evidence to provide a reasonable basis for our findings and
conclusions based on our audit objectives. We believe that the evidence
obtained provides a reasonable basis for our findings and conclusions based on
our audit objectives.
The Honorable Ron Wyden
Chairman
Committee on Finance
United States Senate
The Honorable Michael F. Bennet
United States Senate
As agreed with your offices, unless you publicly announce the contents of this
report earlier, we plan no further distribution until 30 days from the report date. At
that time, we will send copies to the appropriate congressional committees, the
Secretary of the Treasury, the Director of the Office of Management and Budget,
and other interested parties. In addition, the report is available at no charge on
the GAO website at https://www.gao.gov.
4800.
A. Nicole Clowers, Managing Director, Congressional Relations,
[email protected], (202) 512-4400.
List of Addressees
GAO Contact
Information

Page 17 GAO-24-106056 Economic Downturns
Staff Acknowledgments: Thomas McCabe (Assistant Director), Laurel Plume
(Analyst-in-Charge), Yiwen (Eva) Cheng, Samantha Lalisan, Alec McQuilkin, Ed
Nannenhorn, and Rachel Schultz made key contributions to this report.
Connect with GAO on Facebook, Flickr, Twitter, and YouTube. Subscribe to our
RSS Feeds or Email Updates. Listen to our Podcasts.
Visit GAO on the web at https://www.gao.gov.
This work of the United States may include copyrighted material, details at
https://www.gao.gov/copyright.

Page 18 GAO-24-106056 Economic Downturns
This appendix contains credit, copyright, and other source information for figures
in this product when that information was not listed adjacent to the figure.
Aizer, Anna and Claudia Persico, “Lessons Learned from the COVID-19 Policy Response
and Child Well-Being.” Recession Remedies: Lessons Learned from the U.S. Economic
Policy Response to COVID-19 (Washington, D.C.: The Hamilton Project and the Hutchins
Center on Fiscal & Monetary Policy, Brookings Institution, 2022).
Appendix I Additional
Source Information for
Graphics
Bibliography

Page 19 GAO-24-106056 Economic Downturns
Benitez, Joseph, “Comparison of Unemployment-Related Health Insurance Coverage
Changes in Medicaid Expansion vs Nonexpansion States During the COVID-19
Pandemic,” JAMA Health Forum, vol. 3 no. 6 (2022).
Benitez, Joseph A., Victoria E. Perez, and Jie Chen. “Did Medicaid Slow Declines in
Access to Health Care During the Great Recession?” Health Services Research, vol. 56
(2021): 655–667.
Benitez, Joseph, Victoria Perez, and Eric Seiber. “Medicaid Access During Economic
Distress: Lessons Learned From the Great Recession.” Medical Care Research and
Review, vol. 78, no. 5 (2021): 490–501.
Bitler, Marianne and Hilary Hoynes. “The More Things Change, the More They Stay the
Same? The Safety Net and Poverty in the Great Recession.” Journal of Labor
Economics, vol. 34, no. 1, pt. 2 (2016): S403–S444.
Bitler, Marianne, Hilary Hoynes, and Elira Kuka. “Child Poverty, the Great Recession, and
the Social Safety Net in the United States.” Journal of Policy Analysis and Management,
vol. 36, no. 2 (2017): 358–389.
Bitler, Marianne, Hilary Hoynes, and Elira Kuka. “Do In-Work Credits Serve as a Safety
Net?” The Journal of Human Resources, vol. 52 no. 2, Spring (2017): 319–350.
Bitler, Marianne P., Hilary W. Hoynes, and Diane Whitmore Schanzenbach. “The Social
Safety Net in the Wake of COVID-19.” Brookings Papers on Economic Activity, Summer
(2020): 119–145.
Blinder, Alan S. and Mark Zandi. The Financial Crisis: Lessons for the Next One.
(Washington, D.C.: Center on Budget and Policy Priorities, Oct. 15, 2015).
Boone, Christopher, Arindrajit Dube, Lucas Goodman, and Ethan Kaplan.
“Unemployment Insurance Generosity and Aggregate Employment.” American Economic
Journal: Economic Policy, vol. 13 no. 2 (2021): 58–99.
Canning, Patrick and Brian Stacy. The Supplemental Nutrition Assistance Program
(SNAP) and the Economy: New Estimates of the SNAP Multiplier, Economic Research
Report Number 265. U.S. Department of Agriculture Economic Research Service, July
2019.
Cashin, David, Jamie Lenney, Byron Lutz, and William Peterman. “Fiscal Policy and
Aggregate Demand in the USA Before, During, and Following the Great Recession.”
International Tax and Public Finance, vol. 25 (2018):1519–1558.
Chalom, René, Fatih Karahan, Kurt Mitman, and Benjamin Pugsley. Liquidity Effects of
Unemployment Insurance Benefit Extensions: Evidence from Consumer Credit Data.
Paper presented at a meeting of the Society for Economic Dynamics, 2019.
Congressional Budget Office. Automatic Stabilizers in the Federal Budget: 2023 to 2033.
Washington, D.C.: 2023.
Davig, Troy and Michael Redmond. Accounting for Changes in the U.S. Budget Deficit.
Federal Reserve Bank of Kansas City. Kansas City, M.O.: 2014.
Di Maggio, Marco and Amir Kermani. The Importance of Unemployment Insurance as an
Automatic Stabilizer. Working Paper No. 22625 (Cambridge, M.A.: National Bureau of
Economic Research, Sep. 2016).
Duggan, Mark, Andrew C. Johnston, and Audrey Guo, Experience Rating As An
Automatic Stabilizer. Working paper 30651 (Cambridge, M.A.: National Bureau of
Economic Research, Nov. 2022).
Farooq, Ammar, Adriana D. Kugler, and Umberto Muratori. Do Unemployment Insurance
Benefits Improve Match and Employer Quality? Evidence from Recent U.S. Recessions.

Page 20 GAO-24-106056 Economic Downturns
Working Paper 27574, (Cambridge, M.A.: National Bureau of Economic Research, rev.
Apr. 2022).
Follette, Glenn and Byron Lutz. Fiscal Policy in the United States: Automatic Stabilizers,
Discretionary Fiscal Policy Actions, and the Economy. Finance and Economics
Discussion Series No. 43, Federal Reserve Board. Washington, D.C.: 2010.
Hamersma, Sarah, Yilin Hou, Yusun Kim, and Douglas Wolf. “Business Cycles, Medicaid
Generosity, and Birth Outcomes.” Population Research and Policy Review, vol. 37
(2018): 729–749.
Han, Jeehoon, Bruce D. Meyer, and James X. Sullivan. “Income and Poverty in the
COVID-19 Pandemic.” Brookings Papers on Economic Activity, Summer (2020): 85–118.
Hanson, Kenneth. The Food Assistance National Input-Output Multiplier (FANIoM) Model
and Stimulus Effects of SNAP, Economic Research Report Number 103, U.S.
Department of Agriculture, October 2010.
Hardy, Bradley L. “Income Instability and the Response of the Safety Net.” Contemporary
Economic Policy, vol.35, no.2 (2017): 312–330.
Hsu, Joanne W., David A. Matsa, and Brian T. Melzer. “Unemployment Insurance as a
Housing Market Stabilizer.” American Economic Review, vol. 108 no. 1 (2018): 49–81.
Jones, Maggie R. “The EITC Over the Great Recession: Who Benefited?” National Tax
Journal, vol. 70, no. 4 (2017): 709–736.
Kekre, Rohan. “Unemployment Insurance in Macroeconomic Stabilization.” Review of
Economic Studies, vol. 90 (2023): 2439-2480.
Kuka, Elira. “Quantifying the Benefits of Social Insurance: Unemployment Insurance and
Health.” The Review of Economics and Statistics, vol. 102, no. 3 (2020): 490–505.
Larrimore, Jeff, Jacob Mortenson, and David Splinter. “Earnings Shocks and Stabilization
During COVID-19.” Journal of Public Economics, vol. 206 (2022): 1–9.
Mandal, Bidisha, Nilton Porto;,D. Elizabeth Kiss, Soo Hyun Cho, and Lorna Saboe-
Wounded Head. “Health Insurance Coverage during the COVID-19 Pandemic: The Role
of Medicaid Expansion.” Journal of Consumer Affairs (2022): 1–24.
McKay, Alisdair and Ricardo Reis. “The Role of Automatic Stabilizers in the U.S.
Business Cycle.” Econometrica, vol. 84, no. 1 (2016): 141–194.
Meyer, Bruce D. and Derek Wu. “The Poverty Reduction Of Social Security And Means-
Tested Transfers.” ILR Review, vol. 71, no. 5 (2018): 1106–1153.
Miller, Daniel P. and Taryn W. Morrissey. “SNAP Participation and the Health and Health
Care Utilisation of Low-income Adults and Children.” Public Health Nutrition, vol. 24, no.
18 (2021): 6,543–6,554.
Mukhopadhyay, Sankar. “The Effects of Medicaid Expansion on Job Loss Induced Mental
Distress During the COVID-19 Pandemic in the US.” SSM – Population Health, vol. 20
(2022): 1–14.
Nakajima, Makoto. “A Quantitative Analysis of Unemployment Benefit Extensions.”
Journal of Monetary Economics, vol. 59 (2012): 686–702.
Noghanibehambari, Hamid and Mahmoud Salari. “The Effect of Unemployment
Insurance on the Safety Net and Infant Health in the USA.” Economic Annals, vol. LXVII,
no. 234 (2022): 7–28.
Pei, Yun and Zoe Xie. “A Quantitative Theory of Time-Consistent Unemployment
Insurance.” Journal of Monetary Economics, vol. 117 (2021): 848–870.

Page 21 GAO-24-106056 Economic Downturns
Pilkauskas, Natasha V., Janet Currie, and Irwin Garfinkel. “The Great Recession, Public
Transfers, and Material Hardship.” Social Service Review, vol. 86 no. 3 (2012): 401–427.
Rothstein, Jesse and Robert G. Valletta. “Scraping by: Income and Program Participation
After the Loss of Extended Unemployment Benefits.” Journal of Policy Analysis and
Management, vol. 36, no. 4 (2017): 880–908.
Russek, Frank and Kim Kowalewski. How CBO Estimates Automatic Stabilizers. Working
Paper 2015-07, Congressional Budget Office. (Washington, D.C.: 2015).
Valletta, Robert G. “Recent Extensions of US Unemployment Benefits: Search
Responses in Alternative Labor Market States.” IZA Journal of Labor Policy, vol. 3, no. 18
(2014): 1–25.
Zedlewski, Sheila, Elaine Waxman, and Craig Gundersen. Round Table on SNAP’s Role
in the Great Recession and Beyond. The Urban Institute, 2012.
1
A business cycle refers to the period where overall economic activity fluctuates between a high
point (peak) and a low point (trough). When the economy begins to rise out of a trough, it marks the
beginning of a new cycle. Business cycles vary in length and magnitude.
2
Recessions are designated by a committee of experts within the NBER, a private nonprofit
research organization that focuses on understanding the U.S. economy. The NBER committee
uses indicators such as employment, personal income, industrial production, and quarterly GDP
growth to calculate monthly data on recessions.
3
The federal funds rate is the interest rate at which depository institutions lend federal funds
(balances held at Federal Reserve Banks) with each other overnight.
4
Rohan Kekre, “Unemployment Insurance in Macroeconomic Stabilization,” Review of Economic
Studies, vol. 00 (2023): 2; Glenn Follette and Byron Lutz, “Fiscal Policy in the United States:
Automatic Stabilizers, Discretionary Fiscal Policy Actions, and the Economy,” Finance and
Economics Discussion Series No. 43, Federal Reserve Board. (Washington, D.C.: 2010),16;
Alisdair McKay and Ricardo Reis, “The Role of Automatic Stabilizers in the U.S. Business Cycle,”
Econometrica, vol. 84, no. 1 (2016): 1.
5
According to CBO officials, CBO considers programs automatic stabilizers for the purposes of its
budget estimates when the level of spending is most affected by the business cycle. Officials said
that CBO excludes programs that are too small to be considered a major program or are not
affected by the business cycle. For the purposes of this report, we limited our analysis to the
spending programs CBO identified as automatic stabilizers. Frank Russek and Kim Kowalewski,
How CBO Estimates Automatic Stabilizers, Congressional Budget Office (Washington, D.C.: Nov.
2015).
6
There are 53 different UI programs operated in the states, the District of Columbia (D.C.), Puerto
Rico, and the U.S. Virgin Islands (USVI). UI benefits are based on a percentage of an individual’s
earnings over a recent 52-week period up to a state maximum amount. See Department of Labor
UI Tax Fact Sheet, accessed Oct. 11, 2023; and UI Fact Sheet, accessed June 29, 2023
(https://oui.doleta.gov/unemploy/aboutui.asp).
7
An initial claim is the first claim filed by a person, and is used to determine eligibility for benefits. A
state UI office reviews each initial claim and either accepts or rejects it, with benefits paid to those
claims that are accepted. Department of Labor, Bureau of Labor Statistics, Applying for and
Receiving Unemployment Insurance Benefits during the Coronavirus Pandemic (Washington, D.C.:
Sept. 2021), https://www.bls.gov/opub/mlr/2021/article/applying-for-and-receiving-unemployment-
insurance-benefits-during-the-coronavirus-pandemic.htm
8
All states pay up to 13 weeks of extended benefits if the unemployment rate among those eligible
for UI for a specified 13-week period is at least 5 percent and is 120 percent of the average of the
rates for the same 13-week period in each of the two previous years. States can also choose to pay
an additional 7 weeks of extended benefits if the unemployment rate among those eligible reaches
certain thresholds.
9
For example, the CARES Act temporarily provided an additional $600 benefit that augmented
weekly UI benefits, and the Families First Coronavirus Response Act temporarily provided 100
Endnotes

Page 22 GAO-24-106056 Economic Downturns
percent federally financed Extended Benefits for certain states. Pub. L. No. 116-136, § 2104, 134
Stat. 281, 318 (2020); Pub. L. No. 116-127, § 4105, 134 Stat. 178, 195 (2020).
10
SNAP covers the 50 states, D.C., USVI, and Guam. Also, in lieu of SNAP, Nutrition Assistance
Program (NAP) block grant funding is provided to Puerto Rico, the Commonwealth of the Northern
Marianas Islands, and American Samoa. Additionally, the Food Distribution Program on Indian
Reservations provides, in lieu of SNAP benefits, food commodities to low-income households on
Indian reservations and to Native American families residing in Oklahoma or in designated areas
near Oklahoma.
11
According to NBER, the recession driven by the COVID-19 pandemic took place from March to
April of 2020. Annual data on SNAP are used to compare pre-recession average participation in
2019 to post-recession average participation in 2021. U.S. Department of Agriculture Food and
Nutrition Service, SNAP Data Tables National Level Annual Summary on Participation and Costs
(data as of June 9, 2023), accessed July 11, 2023, https://www.fns.usda.gov/pd/supplemental-
nutrition-assistance-program-snap
12
Mandatory eligibility for Medicaid is extended to certain groups, such as qualified pregnant
women and children. States can also develop a “medically needy program” for those with
significant health needs who do not meet low-income thresholds. All states, the District of
Columbia, and the U.S. territories participate in Medicaid; however, the federal government’s
financing of Medicaid in the territories is subject to a capped allotment and coverage requirements
vary from those applicable to the states and the District of Columbia.
13
Health and Human Services, Centers for Medicare and Medicaid Services, March 2023 Medicaid
and CHIP Enrollment Trends Snapshot, accessed July 5, 2023,
https://www.medicaid.gov/medicaid/program-information/medicaid-chip-enrollment-data/medicaid-
and-chip-enrollment-trend-snapshot/index.html. According to the National Bureau of Economic
Research, the COVID-19 recession took place in March and April of 2020.
14
For the purposes of this report, discretionary fiscal policy refers to actions taken by policymakers
to adjust taxes and spending on a short-term basis in response to emerging issues that affect the
level, composition, and distribution of national income and output. Discretionary fiscal policy may
include actions taken to adjust discretionary spending, mandatory spending (i.e., budget authority
generally provided by laws other than appropriations acts), or revenues. The budget process is a
major vehicle for determining and implementing federal fiscal policy. Discretionary spending refers
to budget authority, outlays, or other budgetary resources that are provided and controlled by
appropriations acts.
15
Temporary changes to UI during the COVID-19 pandemic included (1) Pandemic Unemployment
Assistance, which authorized UI benefits to individuals not otherwise eligible who could not work for
COVID-19 related reasons; (2) Federal Pandemic Unemployment Compensation, which
generally authorized additional weekly benefits; (3) Pandemic Emergency Unemployment
Compensation, which generally authorized additional weeks of UI benefits for those who had
exhausted their regular UI benefits; and (4) the Mixed Earner Unemployment Compensation
program, which authorized additional UI benefits for those whose benefits did not account for
significant self-employment income and who thus may have received a lower regular UI benefit
than they would have received had they been eligible for Pandemic Unemployment Assistance.
16
Temporary changes to SNAP during the COVID-19 pandemic included issuing emergency
allotments and allowing the Department of Agriculture to adjust federal requirements for SNAP
related to issuing benefits, reviewing applications, and reporting requirements. Pub. L. No. 116-
127, § 1101(a)-(i), 134 Stat. 178, 179-80 (2020).
17
These studies first estimate the size of automatic stabilizers as the change of government
revenues and expenditures in response to economic shocks. Then, they derive the impact of
stabilizers on economic activity either using a macroeconomic model or by applying estimates of
the marginal propensity to consume of households and businesses to the revenue and expenditure
changes. David Cashin, Jamie Lenney, Byron Lutz, William Peterman, “Fiscal Policy and
Aggregate Demand in the USA Before, During, and Following the Great Recession.” International
Tax and Public Finance, vol. 25 (2018) and Follete and Lutz, “Fiscal Policy in the United States.”
18
Cashin et al., “Fiscal Policy and Aggregate Demand,”1538.
19
The rate of GDP growth may be positive or negative. In particular, GDP growth may be negative
during a recession.

Page 23 GAO-24-106056 Economic Downturns
20
At the federal level, the stabilizers considered in this study include personal (individual) and
corporate income, payroll, production and import taxes, and unemployment insurance taxes on the
revenue side, as well as UI, SNAP, and Medicaid on the expenditure side. At the state and local
level, stabilizers include cyclical responses for personal and corporate income taxes and sales
taxes.
21
At the federal level, the stabilizers considered in this study include personal (individual) and
corporate income taxes, social insurance contributions (such as Social Security and Medicare
payroll taxes), excise taxes, and custom duties on the revenue side, as well as UI, SNAP, and
Medicaid, and federal welfare payments before 1996 on the expenditure side. The authors also
considered federal welfare payments post 1996, which were not cyclically sensitive, as well as
Social Security Old Age and Survivors Insurance and Disability Insurance, which had negligible
cyclical effects. At the state and local level, stabilizers include cyclical responses for personal and
corporate income taxes, federal grants for Medicaid and Assistance for Families with Dependent
Children (since replaced by the Temporary Assistance for Needy Families program), and other
small transfers. Follette and Lutz, “Fiscal Policy in the United States,” 17.
22
Specifically, it found that a $1 billion increase in SNAP spending due to new enrollment during a
downturn would generate $1.5 billion in GDP. This study used a social accounting matrix multiplier
model that relates production input to output. It assumed that new SNAP benefit recipients have the
same spending and saving behavior as the average existing SNAP household. It also assumed that
prices and interest rates are fixed in the one-year horizon and that government spending does not
crowd out private spending, which is less likely during an economic downturn. A related study from
2010 estimated the SNAP multiplier to be 1.79. This study assumed new SNAP recipients’ behavior
to match the observed average instead of marginal propensities to save and consume, which tends
to bias the multiplier estimate upward. Patrick Canning and Brian Stacy, The Supplemental
Nutrition Assistance Program (SNAP) and the Economy: New Estimates of the SNAP Multiplier,
Economic Research Report Number 265, U.S. Department of Agriculture Economic Research
Service (Washington, D.C.: July 2019).
23
Marco Di Maggio and Amir Kermani, “The Importance of Unemployment Insurance as an
Automatic Stabilizer,” Working Paper No. 22625 (Cambridge, M.A.: National Bureau of Economic
Research, 2016): 2; Kenneth Hanson, The Food Assistance National Input-Output Multiplier
(FANIoM) Model and Stimulus Effects of SNAP, Economic Research Report Number 103, U.S.
Department of Agriculture (Washington, D.C.: Oct. 2010), iv; Kekre, “Unemployment Insurance in
Macroeconomic Stabilization,” 24; Alan S. Blinder and Mark Zandi, The Financial Crisis: Lessons
for the Next One, (Washington, D.C.: Center on Budget and Policy Priorities, Oct. 15, 2015): 18.
24
Christopher Boone, Arindrajit Dube, Lucas Goodman, and Ethan Kaplan. “Unemployment
Insurance Generosity and Aggregate Employment,” American Economic Journal: Economic Policy,
vol. 13 no. 2 (2021):60.
25
Kekre, “Unemployment Insurance in Macroeconomic Stabilization,”2439; Yun Pei and Zoe Xie, “A
Quantitative Theory of Time-Consistent Unemployment Insurance,” Journal of Monetary
Economics, 117 (2021): 849; Makoto Nakajima, “A Quantitative Analysis of Unemployment Benefit
Extensions,” Journal of Monetary Economics, vol. 59 no. 7 (2012): 686.
26
Mark Duggan, Andrew C. Johnston, and Audrey Guo, Experience Rating As An Automatic
Stabilizer, Working Paper No. 30651 (Cambridge, M.A.: National Bureau of Economic Research,
Nov. 2022): 2.
27
This study did not holistically examine the economic effects of experience rating, including
potential effects on firms’ decisions to hire.
28
The author noted that his estimates lie in the middle-to-upper end of the range of past estimates.
He also assumed that state-level job search behavior and outcomes are unrelated to state-level UI
extensions, except through factors that trigger the extensions. Robert G. Valletta, “Recent
Extensions of US Unemployment Benefits: Search Responses in Alternative Labor Market States,”
IZA Journal of Labor Policy, vol. 3, no. 18 (2014): 20.
29
Nakajima, “A Quantitative Analysis of Unemployment Benefit Extensions,” 698.
30
Nakajima, “A Quantitative Analysis of Unemployment Benefit Extensions,” 697.
31
Pei and Xie, “A Quantitative Theory of Time-Consistent Unemployment Insurance” and Nakajima,
“A Quantitative Analysis of Unemployment Benefit Extensions.”

Page 24 GAO-24-106056 Economic Downturns
32
Ammar Farooq, Adrianna D. Kugler, Umberto Muratori, “Do Unemployment Insurance Benefits
Improve Match and Employer Quality? Evidence from Recent U.S. Recessions,” Working Paper,
No. 27574 (Cambridge, M.A.: National Bureau of Economic Research, rev. April 2022), 20-21.
33
GAO, Unemployment Insurance: Pandemic Programs Posed Challenges, and DOL Could Better
Address Customer Service and Emergency Planning, GAO-22-104251 (Washington, D.C.: June 7,
2022).
34
Marianne Bitler and Hilary Hoynes, “The More Things Change, the More They Stay the Same?
The Safety Net and Poverty in the Great Recession,” Journal of Labor Economics, vol. 34, no. 1, pt.
2 (2016); Jeff Larrimore, Jacob Mortenson, and David Splinter, “Earnings Shocks and Stabilization
during COVID-19,” Journal of Public Economics, vol. 206 (2022). Bruce Meyer and Derek Wu, “The
Poverty Reduction of Social Security and Means-Tested Transfers,” ILR Review, vol. 71, no. 5
(2018). Marianne Bitler, Hilary Hoynes, and Elira Kuka, “Child Poverty, the Great Recession, and
the Social Safety Net in the United States,” Journal of Policy Analysis and Management, vol. 36,
no. 2 (2017); Bradley L. Hardy, “Income Instability and the Response of the Safety Net,”
Contemporary Economic Policy, vol.35, no.2 (2017).
35
Bitler and Hoynes, “The More Things Change, the More They Stay the Same?;” Meyer and Wu,
“The Poverty Reduction of Social Security and Means-Tested Transfers;” Hardy, “Income Instability
and the Response of the Safety Net;” Bitler, Hoynes, and Kuka, “Child Poverty, the Great
Recession, and the Social Safety Net in the United States.”
36
Bitler and Hoynes, “The More Things Change, the More They Stay the Same?,” S422.; Meyer
and Wu, “The Poverty Reduction of Social Security and Means-Tested Transfers,” 1136. Bitler and
Hoynes (2016) also found SNAP and UI to be marginally more countercyclical during the Great
Recession than in previous cycles since 1980.
37
Jeehoon Han, Bruce D. Meyer, and James X. Sullivan, “Income and Poverty in the COVID-19
Pandemic,” Brookings Papers on Economic Activity, Summer (2020): 87.
38
Jesse Rothstein and Robert G. Valletta, “Scraping by: Income and Program Participation After the
Loss of Extended Unemployment Benefits,” Journal of Policy Analysis and Management, vol. 36,
no. 4 (2017): 880, 882.
39
Larrimore et al., “Earnings Shocks and Stabilization during COVID-19,” 104,602.
40
The study notes that this finding is consistent with the supplemental UI benefits provided by the
CARES Act in 2020. Because these benefits were a fixed weekly amount and not tied to wages
while working, lower-earning beneficiaries were the most likely to replace their earnings. The study
defined earnings as wages and salaries, excluding self-employment.
41
While these studies varied in the set of programs considered as part of the social safety net, they
all included SNAP and UI. Bitler and Hoynes, “The More Things Change, the More They Stay the
Same?;” Hardy, “Income Instability and the Response of the Safety Net;” Bitler, Hoynes, and Kuka,
“Child Poverty, the Great Recession, and the Social Safety Net in the United States.”
42
This study also mentions that despite being effective at reducing poverty, since 1980 the safety
net appears less responsive to instability for the same demographic groups. Hardy, “Income
Instability and the Response of the Safety Net,” 327.
43
Bitler, Hoynes, and Kuka, “Child Poverty, the Great Recession, and the Social Safety Net in the
United States,” 358.
44
According to the study, immigrants are not able to access a large share of the safety net due to
lack of eligibility (for unauthorized immigrants) or because access is more limited. Bitler, Hoynes,
and Kuka. “Child Poverty, the Great Recession, and the Social Safety Net in the United States,”
380.
45
René Chalom, Fatih Karahan, Kurt Mitman, and Benjamin Pugsley, “Liquidity Effects of
Unemployment Insurance Benefit Extensions: Evidence from Consumer Credit Data,” Paper
presented at a meeting of the Society for Economic Dynamics (2019); Joanne W Hsu, David A.
Matsa, and Brian T. Melzer, “Unemployment Insurance as a Housing Market Stabilizer,” American
Economic Review, vol. 108 no. 1 (2018).
46
According to the study, this finding implies that as long as home prices maintain their values,
mortgage holders receiving UI benefits may use their benefits to pay down housing debts. There
may be less incentive to pay down mortgage debt in a time when house prices are depressed.

Page 25 GAO-24-106056 Economic Downturns
Chalom et al., “Liquidity Effects of Unemployment Insurance Benefit Extensions,” 7.
47
Hsu, et al., “Unemployment Insurance as a Housing Market Stabilizer,” 50.
48
We use the term “food insecurity” to refer to multiple measures of food scarcity used in different
studies, to include “food insufficiency” and “food hardship.”
49
Natasha Pilkauskas, Janet Currie, and Irwin Garfinkel, “The Great Recession, Public Transfers,
and Material Hardship,” Social Service Review, vol. 86 no. 3 (2012): 12; Anna Aizer and Claudia
Persico, “Lessons Learned from the COVID-19 Policy Response and Child Well-Being,” Recession
Remedies: Lessons Learned from the U.S. Economic Policy Response to COVID-19 (Washington,
D.C.: The Hamilton Project and the Hutchins Center on Fiscal & Monetary Policy, Brookings
Institution, 2022): 273; Marianne Bitler, Hilary Hoynes, and Diane Schanzenbach, “The Social
Safety Net in the Wake of COVID-19,” Brookings Papers on Economic Activity, Summer (2020):
121.
50
The authors defined food hardship based on self-reported responses to whether, in the past 12
months, the household received free food or meals or whether household members experienced
hunger due to not being able to afford enough food. Pilkauskas et al., “The Great Recession, Public
Transfers, and Material Hardship,” 12.
51
Consolidated Appropriations Act, 2021, Pub. L. No. 116-260, div. N, tit. VII, § 702, 134 Stat. 1182,
2092 (2020). “Food insufficiency” is a measure used for the Census Bureau’s Household Pulse
Survey. Specifically, households were considered food insufficient if they reported sometimes or
often not having enough food to eat in the past 7 days. Aizer and Persico, Recession Remedies,
273.
52
The Patient Protection and Affordable Care Act gave states the option to expand their Medicaid
programs by covering nearly all adults with incomes at or below 133 percent of the federal poverty
level. Pub. L. No. 111-148, 124 Stat. 119 (2010), as amended by the Health Care and Education
Reconciliation Act of 2010, Pub. L. No. 111-152, 124 Stat. 1029 (2010). States that expanded
Medicaid eligibility criteria made individuals that lost employment-sponsored health insurance more
likely to be eligible to enroll in Medicaid.
53
Sankar Mukhopadhyay, “The Effects of Medicaid Expansion on Job Loss Induced Mental Distress
during the COVID-19 Pandemic in the US,” SSM – Population Health, vol. 20, 101279 (2022): 9.
54
This study used self-reported food insufficiency data from the Census Bureau’s Household Pulse
Survey. Aizer and Persico, Recession Remedies, 274.
55
Bitler, et al., “The Social Safety Net in the Wake of COVID-19,” 121.
56
We previously reported that selected states faced challenges managing the surge in UI claims
and implementing program expansions during the COVID-19 pandemic. We also reported that
staffing challenges and persistent demand hampered selected states’ abilities to process Pandemic
Unemployment Assistance claims. See GAO-22-104251 and GAO, Pandemic Unemployment
Assistance: Federal Program Supported Contingent Workers amid Historic Demand, but DOL
Should Examine Racial Disparities in Benefit Receipt, GAO-22-104438 (Washington, D.C.: June 7,
2022).
57
Joseph Benitez, “Comparison of Unemployment-Related Health Insurance Coverage Changes in
Medicaid Expansion vs Nonexpansion States During the COVID-19 Pandemic,” JAMA Health
Forum, vol. 3 no. 6 (2022); Joseph A Benitez, Victoria E. Perez, Jie Chen, “Did Medicaid Slow
Declines in Access to Health Care during the Great Recession?,” Health Services Research, vol.
56 (2021); Bidisha Mandal, Nilton Porto, D. Elizabeth Kiss, Soo Hyun Cho, and Lorna Saboe-
Wounded Head, “Health Insurance Coverage during the COVID-19 Pandemic: The Role of
Medicaid Expansion,” Journal of Consumer Affairs (2022): 11.
58
Benitez, “Comparison of Unemployment-Related Health Insurance Coverage,” 1.
59
Benitez, Perez, and Chen, “Did Medicaid Slow Declines in Access to Health Care,” 655; Joseph A
Benitez, Victoria Perez, and Eric Seiber, “Medicaid Access During Economic Distress: Lessons
Learned From the Great Recession,” Medical Care Research and Review, vol. 78, no. 5 (2021):
494.
60
Mukhopadhyay, “The Effects of Medicaid Expansion on Job Loss Induced Mental Distress,” 2.

Page 26 GAO-24-106056 Economic Downturns
61
Sarah Hamersma, Yilin Hou, Yusun Kim, and Douglas Wolf, “Business Cycles, Medicaid
Generosity, and Birth Outcomes,” Population Research and Policy Review, vol. 37 (2018): 742.
62
Medicaid generosity was based on state-level eligibility criteria.
63
UI generosity was proxied by the maximum benefit that eligible unemployed individuals can
receive. Hamid Noghanibehambari and Mahmoud Salari, “The Effect of Unemployment Insurance
on the Safety Net and Infant Health in the USA,” Economic Annals, vol. LXVII, no. 234 (2022): 12.
64
The standard deviation is a measure of the amount of variation in the data from the mean. A
larger standard deviation indicates more variability.
65
This analysis is based on data from the Survey of Income and Program Participation in years
1996-2013 and the Behavioral Risk Factor Surveillance System in years 1996-2015. Elira Kuka,
“Quantifying the Benefits of Social Insurance: Unemployment Insurance and Health,” The Review
of Economics and Statistics, vol. 102, no. 3 (2020).
66
SNAP generosity was based on several state-level SNAP administration characteristics, including
eligibility guidelines and program spending. Daniel P. Miller and Taryn W. Morrissey, “SNAP
Participation and the Health and Health Care Utilisation of Low-Income Adults and Children,” Public
Health Nutrition, vol. 24, no. 18 (2021): 6,548.
67
Sheila Zedlewski, Elaine Waxman, and Craig Gundersen, The Urban Institute, Round Table on
SNAP’s Role in the Great Recession and Beyond (Washington, D.C.: The Urban Institute, 2012): 5.
68
We previously reported on the design and administration of refundable tax credits, including the
EITC. See GAO, Refundable Tax Credits: Comprehensive Compliance Strategy and Expanded
Use of Data Could Strengthen IRS’s Efforts to Address Noncompliance, GAO-16-475 (Washington,
D.C.: May 27, 2016).
69
Marianne Bitler, Hilary Hoynes, and Elira Kuka, “Do In-Work Tax Credits Serve as a Safety Net?,”
The Journal of Human Resources, vol. 52 no. 2, March (2017); Maggie R. Jones, “The EITC Over
the Great Recession: Who Benefited?,” National Tax Journal, vol. 70, no. 4 (2017).
70
Jones, “The EITC Over the Great Recession: Who Benefited?” 724.
71
Bitler et al., “Do In-Work Tax Credits Serve as a Safety Net?,” 320.
72
According to the National Bureau of Economic Research, the Great Recession started in January
2008 and ended in June 2009. Annual individual income tax revenue peaked in 2008, as the Great
Recession began, and reached a low point in 2010, shortly after it ended. This change in revenue
was not caused by automatic stabilizers alone. Multiple factors, including tax law changes, affect
the amount of revenue collected in any given year.
73
CBO captures net changes in automatic stabilizers on the spending and revenue sides
associated with unemployment and output gaps, respectively. According to CBO staff, these
estimates reflect initial responses as well as feedback effects that the initial changes might have
through affecting unemployment or output in the current quarter. We note that CBO’s methodology
does not allow separate analysis of initial changes in stabilizers and subsequent feedback effects,
the latter of which could partly offset the former, particularly during economic downturns. We also
note that automatic stabilizers may impact the fiscal condition in ways that fall outside the scope of
CBO’s methodology, such as through reducing losses to government-sponsored mortgage
companies.
74
GAO, The Nation’s Fiscal Health: Road Map Needed to Address Projected Unsustainable Debt
Levels, GAO-23-106201 (Washington, D.C.: May 8, 2023).
75
Medicaid is a large federal health care program. As an automatic stabilizer, the program’s costs
can fluctuate in the near-term with changes in the economy. However, like other federal health care
programs, its long-term costs are driven by an aging of the population and increases in the cost of
health care. Enrollees over 65 have much higher per capita costs than children and adults under
65, and Medicaid plays a large role in funding long-term care, such as nursing homes, for aged
persons.
76
See GAO-23-106201.
