
Page 1 of 10
Measuring Biodiversity: Microsoft Excel Tutorial
INTRODUCTION
This database contains a subset of data from Snapshot Wisconsin cameras deployed in two different
Wisconsin ecoregions: Southern Wisconsin Till Plains (SWTP) and Northern Lakes and Forests (NLF). The
columns of the spreadsheet refer to different pieces of metadata, metadata is defined as a set of data
describing and giving information about other data (in this case the trail camera photos). The metadata
describes the compass bearing of the trail camera, height from the ground, height from the trail, trigger
ID (the name that the photo is stored as), camera number, animal, number of animals, data the photo
was taken, time, and temperature.
These step-by-step instructions are designed to help students take a raw dataset and convert it into a
series of Pivot Tables. The Pivot Tables will allow students to view the abundance of species for specific
ecoregions, and calculate biodiversity indices.
PART I: ACCESSING THE DATABASE
1. Download “Measuring Biodiversity Database.xlsx” file and open on your computer in Microsoft
Excel.
Step 1. View of Measuring Biodiversity Database in Microsoft Excel.
PART II: CONDENSING THE DATA

Page 2 of 10
Measuring Biodiversity: Microsoft Excel Tutorial
2. Highlight the “Camera Number” column by clicking on the “E” button above the heading. Under
the Data tab, click the Filter tool. A downward facing arrow will now appear on the “Camera
Number” heading. Click on the downward facing arrow, click “Clear” and then select the
cameras appropriate for the ecoregion of interest (Southern Wisconsin Till Plains or Northern
Lakes and Forests, whichever you start with – you will calculate the other later). Click “OK”.
Step 2. Filtering the data for only cameras from ecoregion of interest, in this case Southern Wisconsin Till Plains.
3. Google Sheets will now show a condensed version of the data only displaying the ecoregion of
interest. Highlight the filtered data by clicking in the upper left corner of the Microsoft Excel (to
the left of the A column, above row 1). Use Ctrl + C to copy the data. Navigate to the Workspace
sheet, click in the upper left corner (to the left of the A column, above row 1) and paste the data
in the Workspace sheet using Ctrl + V.
This will allow you to manipulate the data that you want, while leaving the original dataset
intact. In the original Database sheet, select the Data tab and select the Filter tool again (which
should be grayed out) to restore the original dataset.

Page 3 of 10
Measuring Biodiversity: Microsoft Excel Tutorial
Step 3. Where to click in upper left corner to highlight entire sheet of data, and to paste in Workspace sheet.
4. For this exercise, we are only interested in the abundance of animals in each ecoregion. In the
Workspace sheet delete all columns, except for “Animal” and “Number of animal”, by right
clicking on the column heading letter and selecting “Delete.” You can select multiple columns to
delete by using the Ctrl button while you select columns.

Page 4 of 10
Measuring Biodiversity: Microsoft Excel Tutorial
Step 4. View of condensed data of interest in Workspace sheet.
PART III: CREATING A PIVOT TABLE
5. The next step is to create a Pivot Table to summarize the data. Highlight the “Animal” column by
clicking on the “A” column heading. While these column is highlighted, click on the Insert tab
and select “Recommended Pivot Tables.” Choose the second option, “Sum of Number of animals
by Animal.” (if you select the first option, “Count of Animal” this will not take into consideration
if a camera trigger has multiple individuals for example, if a trail camera shows three deer will
only appear as one under these settings).

Page 5 of 10
Measuring Biodiversity: Microsoft Excel Tutorial
Step 5. Under “Recommended Pivot Tables” select the second option, “Sum of Number of animals by Animal.”

Page 6 of 10
Measuring Biodiversity: Microsoft Excel Tutorial
Step 5. Example of what your Pivot Table should look like.
PART IV: PERFORMING CALCULATIONS IN MICROSOFT EXCEL
6. A Pivot Table will be created in a new sheet, your Pivot Table should display each species and
the total number of sighting on the trail cameras. Rename the headings to “Species” and
“Abundance”, and create new headings for P
i
, ln(P
i
), and P
i
*ln(P
i
) in the adjacent columns.
7. To have Microsoft Excel calculate the P
i
value, enter in =(CELL_LOCATION / Total Abundance).
For this exercise, the Grand Total value reflects the total number of individuals, do not reference
the cell of the total abundance, or the following step will not work correctly. For example, enter
=(B4/1750). (Be aware of where Microsoft Excel has created the Pivot Table, this will impact
what cell number you are using, for example B4). To autofill the P
i
value for each species, click
on the calculated cell and drag down green square in the bottom right corner.

Page 7 of 10
Measuring Biodiversity: Microsoft Excel Tutorial
Step 7. Example of what your Pivot Table should look like with added columns for Microsoft Excel to help organize
calculations, the red circles show the total abundance and equation for calculating P
i
.
8. Use Microsoft Excel to calculate ln(P
i
) by typing in the equation =ln(CELL_LOCATION) into the
corresponding cell. For example, =ln(C4) (these cell locations may vary based on your dataset)

Page 8 of 10
Measuring Biodiversity: Microsoft Excel Tutorial
Step 8. Calculation for ln(P
i
).
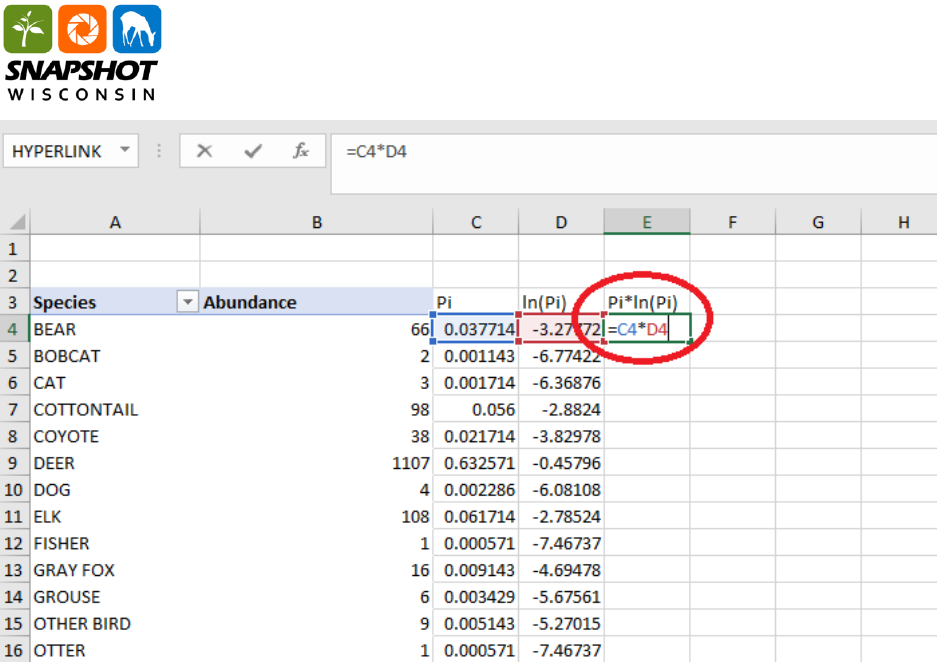
9. Calculate P
i
*ln(P
i
) using the equation =(CELL_LOCATION * CELL_LOCATION). For example,
=(C4*D4) (these cell locations may vary based on your dataset)
Page 9 of 10
Measuring Biodiversity: Microsoft Excel Tutorial
Step 9. Calculation for P
i
* ln(P
i
).
10. Calculate the Shannon diversity index using the equation H = -SUM (P
i
* ln(P
i
)). You can perform
this calculation in Microsoft Excel using the equation
=-SUM(FIRST_CELL_LOCATION:LAST_CELL_LOCATION). For example, =-SUM(E4:E26) (these cell
locations may vary based on your dataset).

Page 10 of 10
Measuring Biodiversity: Microsoft Excel Tutorial
Step 10. Calculation for finding the Shannon diversity index.
11. You can use a calculator to calculate Evenness (E), or take advantage of Microsoft Excel to do
this calculation for you! Use some of the techniques that you have learned in this tutorial.
12. Repeat these steps for the next ecoregion. Record your answers in your Student Worksheet.
