
Youth and the Juvenile
Justice System
2022 NATIONAL REPORT

Youth and the Juvenile Justice System: 2022 National Report
i
Charles Puzzanchera, Sarah Hockenberry, and Melissa Sickmund
National Center for Juvenile Justice
December 2022
Youth and the Juvenile Justice System:
2022 National Report

Youth and the Juvenile Justice System: 2022 National Report
ii
This report was prepared by the National Center for Juvenile Justice, the research division of the
National Council of Juvenile and Family Court Judges, and was supported by cooperative agree-
ment #2019–JX–FX–K001, awarded and managed by the National Institute of Justice with funding
support provided by the Office of Juvenile Justice and Delinquency Prevention, Office of Justice
Programs, U.S. Department of Justice.
The opinions, findings, and conclusions or recommendations expressed in this publication are
those of the authors and do not necessarily reflect those of the Department of Justice.
Copyright 2022
National Center for Juvenile Justice
3700 S. Water Street, Suite 200
Pittsburgh, PA 15203
Suggested citation: Puzzanchera, Charles, Hockenberry, Sarah, and Sickmund, Melissa. 2022.
Youth
and the Juvenile Justice System: 2022 National Report
. Pittsburgh, PA: National Center for Juvenile
Justice.

Youth and the Juvenile Justice System: 2022 National Report
iii
Preface
Youth and the Juvenile Justice System:
2022 National Report
is the fifth edi-
tion of a comprehensive report on
youth victimization, offending by
youth, and the juvenile justice system.
With this release, the report series has
adopted a new name (the series was
previously known as “Juvenile Offend-
ers and Victims”), but the focus of the
report remains unchanged: the report
consists of the most requested infor-
mation on youth and the juvenile jus-
tice system in the United States. De-
veloped by the National Center for
Juvenile Justice (NCJJ) for the Office
of Juvenile Justice and Delinquency
Prevention and the National Institute
of Justice, the report draws on reliable
data and relevant research to provide a
comprehensive and insightful view of
youth victims and offending by youth,
and what happens to youth when they
enter the juvenile justice system in the
U.S.
The report offers—to Congress, state
legislators, other state and local policy-
makers, educators, juvenile justice pro-
fessionals, and concerned citizens—
empirically based answers to frequently
asked questions about the nature of
youth victimization and offending and
the justice system’s response. The ju-
venile justice system must react to the
law-violating behaviors of youth in a
manner that not only protects the
community and holds youth account-
able but also enhances youth’s ability
to live productively and responsibly in
the community. The system must also
intervene in the lives of abused and
neglected children who lack safe and
nurturing environments.
To respond to these complex issues,
juvenile justice practitioners, policy-
makers, and the public must have ac-
cess to useful and accurate information
about the system and the youth it
serves. At times, such information is
not available or, when it does exist, it
is often too scattered or inaccessible to
be useful.
This report bridges that gap by pulling
together the most requested informa-
tion on youth and the juvenile justice
system in the United States. The re-
port draws on numerous national data
collections to address the specific in-
formation needs of those involved
with the juvenile justice system. The
report presents important and, at
times, complex information using
clear, nontechnical writing and easy-
to-understand graphics and tables. It is
structured as a series of briefing papers
on specific topics, short sections that
can be read independently from other
parts of the report.
The material in this report represents
the most reliable information on
youth and their involvement with the
justice system through the 2019 data
year. Given the range of information
covered by the report, a data-year cut-
off had to be established. We elected

Youth and the Juvenile Justice System: 2022 National Report
iv
2019 as a common anchoring point
because all the major data sets required
for the report were current through
2019 at the time we began writing.
The onset of COVID-19 in 2020
caused some data collections to be sub-
stantially delayed and thus unavailable
during the writing of the report. Fur-
ther, the various coronavirus mitigation
efforts introduced across the country,
such as school closures and stay-at-
home orders, likely impacted the type
and volume of behaviors that came to
the attention of the justice system, and
simultaneously necessitated changes to
policies and practices within youth-
serving agencies. Therefore, 2019 re-
flects the experiences of youth and the
juvenile justice system unencumbered
by the impacts of the pandemic.
We expect that this report will be used
mainly as a reference document, with
readers turning to the pages on specific
topics when the need arises. However,
we encourage you to explore other sec-
tions when time permits. In each sec-
tion, you will probably discover some-
thing new, something that will expand
your understanding, confirm your
opinions, or make you question what
you believe to be true.
It has been more than 20 years since
the first edition of this report. Since
that seminal publication, this report
has become a primary source of infor-
mation on youth victimization, offend-
ing by youth, and the justice system’s
response, and it will provide a context
for debates over the direction to take
to respond to these important social
issues.

Youth and the Juvenile Justice System: 2022 National Report
v
Acknowledgments
This report is the result of an ongo-
ing effort that has benefited from
the assistance of many individuals.
Authors at the National Center for
Juvenile Justice (NCJJ) for various
chapters and sections include:
Q Charles Puzzanchera (chapters on
youth population characteristics,
youth victims, offending by
youth, law enforcement and
youth crime, youth in juvenile
court, and youth in corrections).
Q Sarah Hockenberry (sections on
major depressive disorders, edu-
cation, victims of serious violence,
school crime, self-reported drug
use, chapters on youth in juvenile
court and youth in corrections).
Q Melissa Sickmund (chapter on
juvenile justice system structure
and process).
In addition to authors’ contribu-
tions, the following NCJJ staff pro-
vided assistance and review: Kristy
Bach (data collection activities on bul-
lying and self-reported drug use); Mo-
riah Taylor (foster care and adoption);
and Hunter Hurst IV (upper age of
juvenile court jurisdiction and transfer
statutes). Anthony Sladky, Jason
Smith, and Greg Chamberlin provided
computer programming and data anal-
ysis support. Nancy Tierney was re-
sponsible for report production (desk-
top publishing, graphics design,
layout, copy editing, and review).
Within the National Institute of Jus-
tice (NIJ), senior advisor Benjamin
Adams and social science research ana-
lyst Kaitlyn Sill, who serve as the proj-
ect monitors under NIJ Director
Nancy La Vigne, provided careful and
thoughtful review.
Finally, this work would not be possi-
ble without the efforts of the many in-
dividuals who collect and report the
data at the local, state, and national
levels—data that are the essence of this
report.

Youth and the Juvenile Justice System: 2022 National Report
vii
Table of Contents
Chapter 1: Youth population characteristics 1
Youth population demographics ....................................................................... 2
Youth in poverty ............................................................................................... 7
Living arrangements of youth ......................................................................... 10
Major depressive episodes in adolescence ........................................................ 12
Births to teens ................................................................................................ 14
School dropout rates ...................................................................................... 16
Chapter 1 sources ........................................................................................... 18
Chapter 2: Youth victims 21
Child maltreatment reporting by child protective services agencies .................. 22
Child maltreatment demographics .................................................................. 25
Child maltreatment perpetrators ..................................................................... 26
Child maltreatment fatalities ........................................................................... 27
Children in foster care .................................................................................... 28
Family reunification and adoption ................................................................... 30
Victimization survey of youth ......................................................................... 31
Victims of school crime .................................................................................. 33
Victims of bullying ......................................................................................... 34
Youth victims of reported violent crimes ......................................................... 36
Youth victims of violence and those that harm them ....................................... 38
Time-of-day analyses of youth victimization .................................................... 39
Location of youth victimization ...................................................................... 41
Youth homicide victims .................................................................................. 42
Firearm-related homicides of youth ................................................................ 45
Youth suicide victims ...................................................................................... 47
Chapter 2 sources ........................................................................................... 51
Chapter 3: Offending by youth 53
Self-reports vs. official data ............................................................................. 54
School crime ................................................................................................... 55
Drug and alcohol use by school students ......................................................... 58
Drug and alcohol use trends ........................................................................... 62
Serious violent crime committed by youth ...................................................... 64
Homicides by youth ....................................................................................... 65
Time-of-day analyses of youth offending ......................................................... 70
Chapter 3 sources ........................................................................................... 75

Youth and the Juvenile Justice System: 2022 National Report
viii
Chapter 4: Juvenile justice system structure and process 77
History and overview of the juvenile justice system ......................................... 78
U.S. Supreme Court cases and the juvenile justice system ............................... 83
State definitions of juvenile court jurisdiction ................................................. 87
Juvenile justice system case processing ............................................................ 88
Public access to juvenile proceedings .............................................................. 93
State provisions for trying youth as adults ....................................................... 95
State criteria for transferring youth to adult court ............................................ 97
Changes to transfer laws between 2004 and 2019 ........................................ 100
Youth in the federal justice system ................................................................ 101
Chapter 4 sources ......................................................................................... 102
Chapter 5: Law enforcement and youth 105
Introduction to youth arrest data .................................................................. 106
Gender, age, and racial variations in youth arrests ......................................... 108
Youth proportion of total arrests .................................................................. 109
Youth arrest 10-year trends ........................................................................... 110
Female youth arrest trends ............................................................................ 111
Arrest trends of youth younger than age 13 .................................................. 113
Violent crime arrest trends ............................................................................ 115
Murder arrest trends ..................................................................................... 116
Robbery arrest trends ................................................................................... 117
Aggravated assault arrest trends .....................................................................118
Property Crime Index arrest trends ............................................................... 119
Burglary arrest trends ................................................................................... 120
Larceny-theft arrest trends ............................................................................ 121
Motor vehicle theft arrest trends ................................................................... 122
Arson arrest trends ....................................................................................... 123
Simple assault arrest trends ........................................................................... 124
Weapons law violation arrest trends .............................................................. 125
Drug abuse violation arrest trends ................................................................ 126
Disorderly conduct arrest trends ................................................................... 127
Age-specific arrest rate trends ....................................................................... 128
Clearance statistics ........................................................................................ 130
Violent crime arrest rates by state .................................................................. 132
Property crime arrest rates by state ............................................................... 133
Police disposition of youth arrests ................................................................. 134
Chapter 5 sources ......................................................................................... 135
Chapter 6: Youth in juvenile court 137
Introduction to
Juvenile Court Statistics
....................................................... 138
Delinquency caseload ................................................................................... 139
Delinquency case trends ............................................................................... 140
Gender variations in delinquency cases .......................................................... 142
Offense profiles by gender ............................................................................ 144
Racial/ethnic variations in delinquency cases ................................................ 145
Age variations in delinquency cases ............................................................... 148
Detention ..................................................................................................... 150
Detention variations by demographics .......................................................... 151
Formal vs. informal case processing .............................................................. 153
Adjudication ................................................................................................. 155
Disposition ................................................................................................... 156
Delinquency case processing ......................................................................... 158

ix
Judicial waiver .............................................................................................. 161
Racial and ethnic disparities in the juvenile justice system ............................. 163
Status offense cases ....................................................................................... 168
Status offense case processing ....................................................................... 171
Youth and subsequent referrals to juvenile court ........................................... 172
Chapter 6 sources ......................................................................................... 175
Chapter 7: Youth in corrections 177
Introduction to residential placement data .................................................... 178
Youth and residential facility operation trends ............................................... 180
Facility size trends ........................................................................................ 182
Offense characteristics and youth demographics ............................................ 183
State residential placement rates .................................................................... 185
Detained and committed populations ........................................................... 186
Offense profiles of detained youth by state ................................................... 188
Offense profiles of committed youth by state ................................................ 189
Offense profiles for detained youth and committed youth ............................. 190
Gender and age variations in the residential placement population ................ 191
Racial/ethnic variations in the residential placement population ................... 192
Racial/ethnic variations in residential placement rates by state .......................193
Length of stay for youth in residential placement .......................................... 194
Residential placement facility classifications ................................................... 196
Security features in residential placement facilities ......................................... 197
Crowding in residential placement facilities ................................................... 198
Screening for educational, substance abuse, and mental health needs ............ 199
Education evaluation in residential placement facilities .................................. 200
Substance abuse evaluation in residential placement facilities ......................... 201
Mental health needs evaluation in residential placement facilities ................... 202
Suicide risk evaluation in residential placement facilities ................................ 203
Deaths reported in residential placement facilities ......................................... 204
Tribal residential placement facilities ............................................................. 206
Sexual victimization in residential placement facilities .................................... 207
Youth in adult jails ........................................................................................ 210
Youth in adult prisons ................................................................................... 211
Chapter 7 sources ......................................................................................... 212

Youth and the Juvenile Justice System: 2022 National Report
1
Chapter 1
Youth population
characteristics
1
Problems experienced by children
today are the products of multiple
and sometimes complex causes. Data
presented in this chapter show that
prevalence estimates for certain risk
factors associated with delinquency
have decreased while others have been
on the rise. For example, teenage
birth rates have declined to historical-
ly low levels; however, fewer children
are being raised in two-parent fami-
lies. The proportion of youth living in
poverty has decreased since 2010, and
was at its lowest level since 1975, but
the proportion of youth experiencing
major depressive episodes has in-
creased in recent years. Although high
school dropout rates have fallen for
most demographic groups, the rates
are still too high, especially in an em-
ployment market where unskilled
labor is needed less and less.
This chapter serves to document the
status of the U.S. youth population
on several indicators of child well-be-
ing and presents an overview of some
of the more commonly requested de-
mographic, economic, and sociological
statistics on youth. These statistics per-
tain to factors that may be directly or
indirectly associated with youth crime
and victimization. Although these fac-
tors may be correlated with youth
crime and/or victimization, they may
not be the immediate cause but may
be linked to the causal factor. The sec-
tions in this chapter summarize demo-
graphic, poverty, and living arrange-
ment data developed by the U.S.
Census Bureau, depression data from
the Federal Interagency Forum on
Child and Family Statistics, birth sta-
tistics from the National Center for
Health Statistics, and education data
from the National Center for Educa-
tion Statistics.

Youth and the Juvenile Justice System: 2022 National Report
2
The race/ethnicity profile of the youth population will change
considerably by 2050
In 2019, about 1 in 5 residents in the United States was
younger than 18
Q Between 2020 and 2050, the number of non-Hispanic Black youth is projected to
increase 7%, the number of non-Hispanic Asian/Pacific Islander youth is projected
to increase 44%, the number of multi-racial youth is expected to grow 77%, and
the number of youth of Hispanic ethnicity is expected to increase 28%. Conversely,
the number of non-Hispanic White youth will decrease 16%.
Q As a result of these changes, the race/ethnicity profile of U.S. youth will shift: by
2050, nonwhite youth will account for 61% of the youth population under age 18.
Note: The proportion of American Indian youth is too small to label and was 1% in each year.
Source: Author's adaptation of U.S. Census Bureau's
Annual Estimates of the Resident Population by
Sex, Age, Race, and Hispanic Origin for the United States: April 1, 2010 to July 1, 2019
and
Projected
Population by Single Year of Age, Sex, Race, and Hispanic Origin for the United States: July 2016 to
July 1, 2060
[machine-readable data files].
2010 2020 2030 2040 2050
0%
20%
40%
60%
80%
100%
54%
14%
23%
4%
50%
14%
26%
5%
47%
14%
26%
6%
43%
14%
29%
7%
39%
14%
31%
7%
8%
White Black Hispanic Amer. Indian
Asian
Multi-race
Proportion of youth population ages 0−17
5%
6%
5%
7%
After a period of decline, the
youth population is expected to
increase through 2050
For 2019, the U.S. Census Bureau es-
timated that 73,088,675 persons in the
United States—22% of the popula-
tion—were under the age of 18. The
youth population reached a low point
in 1984 at 62.5 million, increased 19%
through 2010, and then declined 1%
through 2019.
Population projections from the Cen-
sus Bureau suggest that the decline in
the population under age 18 will soon
reverse, and the youth population will
increase through the middle of the
21st century, albeit slowly. Compared
with 2020, the youth population is ex-
pected to increase 2% by 2030 and 6%
by 2050. However, as Vespa and his
colleagues note, the U.S. is a graying
country: the growth in the population
ages 65 and older will outpace all other
age groups through 2050. In fact, by
the mid-2030s, persons age 65 and older
will outnumber the population under
age 18 for the first time in history.
The race/ethnicity profile of the
youth population has changed
In response to the Office of Manage-
ment and Budget’s 1997 revisions to
the federal data collection standards on
race and ethnicity, the 2000 decennial
census adopted revised racial classifica-
tions. Prior to the 2000 census, re-
spondents were asked to classify them-
selves into a single racial group: (1)
White, (2) Black or African American,
(3) American Indian or Alaska Native,
or (4) Asian or Pacific Islander. Start-
ing with the 2000 Census, Native Ha-
waiians and Other Pacific Islanders
were separated from Asians. In addi-
tion, respondents could classify them-
selves into more than one racial group.
Information about Hispanic ethnicity is
collected separately from race.
Not all national data systems have
reached the Census Bureau’s level of
detail for racial coding—and historical
data cannot support this new coding
structure, especially the multi-race cat-
egories.* Therefore, this report gener-
ally uses the four-race coding structure.
For ease of presentation, the terms
White, Black, American Indian, and
Asian are used.
When viewed through the lens of race
and ethnicity, the youth population has
undergone a sizeable shift.
Race/ethnicity profile, youth ages 0–17:
Pct. change
Race/ethnicity 2000 2019 2000–2019
Non-Hispanic
White 62% 52% –15%
Black 15 15 –1
American Indian 11 –9
Asian 46 57
Hispanic 17 25 49
In 2019, just over half (52%) of the
youth population was classified as non-
Hispanic White, down from 62% in
2000, while the proportion classified as
*The National Center for Health Statistics
modifies the Census Bureau’s population data
to convert the detailed racial categories to the
traditional four-race categories. This bridging
is accomplished by estimating a single racial
group classification of multi-race persons
based on responses to the National Health In-
terview Survey, which asked respondents to
classify themselves using both the old and new
racial coding structures.
Chapter 1: Youth population characteristics
3
non-Hispanic Black and non-Hispanic
American Indian changed little since
2000. Conversely, the proportion of
the youth population classified as non-
Hispanic Asian and Hispanic increased
between 2000 and 2019.
In 2019, one-fourth (25%) of youth in
the U.S. were of Hispanic ethnicity, up
from 17% in 2000. Population projec-
tions from the Census Bureau suggest
that the number of Hispanic youth in
the U.S. will increase between 2020
and 2050, bringing the Hispanic pro-
portion of the youth population to
31%.
Juvenile justice systems serve
populations that vary greatly in
racial/ethnic composition
In 2019, at least 9 of every 10 youth
in Maine, Vermont, and West Virginia
were non-Hispanic and White. In con-
trast, more than half of California’s and
New Mexico’s youth populations were
Hispanic (52% and 62%, respectively).
Other states with large Hispanic youth
populations were Arizona (45%), Ne-
vada (41%), and Texas (49%).
In 2019, American Indian/Alaskan
Natives accounted for at least 10% of
the youth population in five states:
Alaska (22%), Montana (10%), New
Mexico (10%), Oklahoma (12%), and
South Dakota (14%).
The states with the greatest proportion
of Black youth in their populations in
2019 were Alabama (30%), Georgia
(35%), Louisiana (38%), Maryland
(33%), Mississippi (43%), and South
Carolina (31%). The Black proportion
of the youth population was highest in
the District of Columbia (55%).
In 2019, non-Hispanic White youth accounted for less than half of
the 0–17 population in 11 states
Percent
change
2010–
2019
Racial/ethnic profile, 2019
2019
population
ages 0–17
Non-Hispanic
State White Black
American
Indian Asian Hispanic
U.S. total 73,088,700 –1% 52% 15% 1% 6% 25%
Alabama 1,088,700 –4 59 30 0 2 8
Alaska 180,400 –4 54 6 22 9 10
Arizona 1,641,700 1 40 6 5 4 45
Arkansas 701,300 –1 65 19 1 3 13
California 8,881,100 –4 28 6 1 14 52
Colorado 1,256,700 2 58 6 1 4 32
Connecticut 727,300 –11 56 13 0 6 25
Delaware 204,300 –1 50 28 0 5 17
Dist. of Columbia 128,000 26 24 55 0 3 17
Florida 4,234,000 6 44 21 0 3 31
Georgia 2,505,400 1 45 35 0 5 15
Hawaii 299,400 –1 20 3 0 57 20
Idaho 448,100 4 77 2 1 2 19
Illinois 2,817,300 –10 53 17 0 6 25
Indiana 1,569,400 –2 72 13 0 3 12
Iowa 728,000 0 78 7 0 3 11
Kansas 701,500 –4 68 8 1 3 19
Kentucky 1,004,300 –2 80 11 0 2 7
Louisiana 1,089,900 –2 52 38 1 2 7
Maine 249,600 –9 90 4 1 2 3
Maryland 1,338,200 –1 44 33 0 7 16
Massachusetts 1,353,600 –5 63 10 0 8 19
Michigan 2,144,300 –8 68 18 1 4 9
Minnesota 1,303,200 2 70 12 2 7 9
Mississippi 700,000 –7 50 43 1 1 5
Missouri 1,374,700 –3 74 15 1 3 7
Montana 228,900 2 80 2 10 1 7
Nebraska 476,000 4 70 8 1 3 18
Nevada 694,700 5 37 13 1 8 41
New Hampshire 255,800 –11 86 3 0 4 7
New Jersey 1,943,600 –6 47 14 0 11 27
New Mexico 477,200 –8 24 3 10 1 62
New York 4,031,900 –7 50 16 0 9 25
North Carolina 2,304,600 1 54 24 1 4 17
North Dakota 180,600 20 77 5 8 2 7
Ohio 2,581,400 –5 73 18 0 3 7
Oklahoma 953,900 2 57 10 12 3 18
Oregon 864,800 0 67 4 1 6 23
Pennsylvania 2,635,800 –5 68 15 0 4 13
Rhode Island 203,900 –9 59 9 1 4 27
South Carolina 1,113,700 3 56 31 0 2 10
South Dakota 217,800 7 73 4 14 2 7
Tennessee 1,511,000 1 67 21 0 2 10
Texas 7,406,800 8 33 13 0 5 49
Utah 929,900 6 76 2 1 4 18
Vermont 114,300 –11 91 3 0 3 3
Virginia 1,868,700 1 56 22 0 8 14
Washington 1,661,000 5 59 7 2 11 22
West Virginia 360,400 –7 91 5 0 1 3
Wisconsin 1,267,900 –5 71 11 1 4 13
Wyoming 133,600 –1 79 2 3 1 16
Note: Detail may not total 100% because of rounding.
Source: Authors’ analyses of Puzzanchera et al.’s.
Easy Access to Juvenile Populations
[online analysis].

Youth and the Juvenile Justice System: 2022 National Report
4
Proportion of non-Hispanic Black youth in the youth population (ages 0–17), 2019
Proportion of non-Hispanic White youth in the youth population (ages 0–17), 2019
0% to 50%
50% to 75%
75% to 90%
90% or more
Percent White,
non-Hispanic
0% to 2%
2% to 10%
10% to 30%
30% or more
Percent Black,
non-Hispanic
Source: Authors’ adaptation of National Center for Health Statistics’
Vintage 2020 Postcensal Estimates of the Resident Population of the United States (April
1, 2010, July 1, 2010–July 1, 2020), by Year, County, Single-year of Age (0, 1, 2, .., 85 Years and Over), Bridged Race, Hispanic Origin, and Sex
.

Chapter 1: Youth population characteristics
5
Proportion of non-Hispanic Asian youth in the youth population (ages 0–17), 2019
Proportion of non-Hispanic American Indian/Alaska Native youth in the youth population (ages 0–17), 2019
0% to 1%
1% to 2%
2% to 10%
10% or more
Percent American
Indian, non-Hispanic
0% to 1%
1% to 3%
3% to 10%
10% or more
Percent Asian,
non-Hispanic
Source: Authors’ adaptation of National Center for Health Statistics’
Vintage 2020 Postcensal Estimates of the Resident Population of the United States (April
1, 2010, July 1, 2010–July 1, 2020), by Year, County, Single-year of Age (0, 1, 2, .., 85 Years and Over), Bridged Race, Hispanic Origin, and Sex
.

Youth and the Juvenile Justice System: 2022 National Report
6
Proportion of Hispanic youth in the youth population (ages 0–17), 2019
Change in the juvenile population (ages 0–17), 2000–2019
0% to 5%
5% to 10%
10% to 35%
35% or more
Percent Hispanic
–10% and less
–10% to 0%
0% to 10%
10% and greater
Percent change,
2010–2019
Source: Authors’ adaptation of National Center for Health Statistics’
Vintage 2020 Postcensal Estimates of the Resident Population of the United States (April
1, 2010, July 1, 2010–July 1, 2020), by Year, County, Single-year of Age (0, 1, 2, .., 85 Years and Over), Bridged Race, Hispanic Origin, and Sex
.

Chapter 1: Youth population characteristics
7
The proportion of children living in poverty in 2019 was at its
lowest level since 1975
Exposure to poverty at an early
age is linked to delinquency
Research has often supported a con-
nection between poverty and involve-
ment in crime. Youth who grow up in
families or communities with limited
resources are at a higher risk of offend-
ing than those who are raised under
more privileged circumstances. Those
who are very poor or chronically poor
seem to be at an increased risk of seri-
ous delinquency. The timing of expo-
sure to poverty is especially important.
A meta-analysis by Hawkins et al. of
several studies found that family socio-
economic status at ages 6–11 is a
stronger predictor of serious and vio-
lent delinquency at ages 15–25 than
family socioeconomic status at ages
12–14. Similarly, Jarjoura, Triplett, and
Brinker found that poverty experienced
within the first five years of life signifi-
cantly increased subsequent delinquen-
cy involvement.
The linkage between poverty and de-
linquency, however, may not be direct.
Some argue that the problems associat-
ed with low socioeconomic status (e.g.,
inability to meet basic needs, low ac-
cess to support resources) are stronger
predictors of delinquency than socio-
economic status alone. For example,
Agnew et al. found that self-reported
delinquency was highest among indi-
viduals who experienced several eco-
nomic problems.
The child poverty rate has been
on the decline
The U.S. Census Bureau assigns each
person and family a poverty threshold
according to the size of the family and
ages of its members.* The national
poverty thresholds are used through-
out the U.S. and are updated for infla-
tion annually. In 2010, the poverty
threshold for a family of four with two
children was $22,113. In 2019, this
75 79 83 87 91 95 99 03 07 11 15 19
0%
5%
10%
15%
20%
25%
Year
Percent in poverty
Under age 18
Ages 18−64
Age 65 and over
With the exception of multi-racial youth, the proportion of children living
in poverty in 2019 was at its lowest level since 2002 for all race/ethnicity
groups
Q More than one-third (37%) of the nearly 10.5 million youth younger than 18 living in
poverty in 2019 were Hispanic, while White youth accounted for 29% of all youth in
poverty, and Black youth accounted for 25%.
Q In 2019, the proportion of Black, American Indian, and Hispanic youth in poverty
was more than twice the proportion of White and Asian youth.
Notes: Race groups exclude persons of Hispanic ethnicity. Persons of Hispanic ethnicity can be of any
race.
Source: Author’s analysis of the U.S. Census Bureau’s
Current Population Survey (CPS) Table Creator
(for 2002-2017) and
Microdata Access, CPS Annual Social and Economic Supplement
201903/202003
(for 2018-2019).
03 05 07 09 11 13 15 17 19
0%
10%
20%
30%
40%
50%
Year
Percent under age 18 in poverty
Black
Hispanic
White
Asian
American Indian
Multi-race
Following a decade long decline, the proportion of children younger
than 18 living in poverty reached a new low in 2019
Q Between 2010 and 2019, the child poverty rate declined 8 percentage points while
the rate for persons ages 18–64 fell 4 percentage points. As a result, the proportion
of children living in poverty in 2019 was at its lowest level since 1975 and the pro-
portion of persons ages 18–64 in poverty reached its lowest level in two decades.
Source: Author’s adaptation of the U.S. Census Bureau’s
Current Population Survey. Historical Pov-
erty Tables. Table 3: Poverty Status of People, by Age, Race, and Hispanic Origin: 1959–2019.
* Family members are defined as being related
by birth, marriage, or adoption.

Youth and the Juvenile Justice System: 2022 National Report
8
threshold was $25,926. In comparison,
the poverty threshold for a family of six
with four children was $34,161 in
2019.
Although the thresholds in some sense
reflect families’ needs, they are not in-
tended to be a complete description of
what individuals and families need to
live.
In 2019, 10% of all persons in the U.S.
lived at or below their poverty thresh-
olds. This proportion was greater for
persons under age 18 (14%) than for
those ages 18–64 (9%) and those above
age 64 (9%). The youngest children
were more likely to live in poverty than
their older peers: while 14% of children
ages 5–17 lived in households with re-
sources below established poverty
thresholds, 16% of children under age
5 did so.
Many children live far below poverty
thresholds in what is labeled as extreme
poverty. One technique for gaining a
perspective on the frequency of ex-
treme poverty is to look at the propor-
tion of children who are living below
50% of the poverty level—e.g., in
2019, how many children lived in fam-
ilies of four with two children and in-
comes less than $12,963, half the pov-
erty threshold. In 2019, 6% of persons
under age 18 were living below 50% of
the poverty level, higher than the pro-
portion of persons ages 18–64 and
persons over age 64 (4% each). This
proportion was once again highest for
children under age 5 (7%). In all, more
than 45% of children living in poverty
in 2019 lived in what can be character-
ized as extreme poverty.
In 2019, the proportion of children living in poverty ranged from a low of 3.6% in New Hampshire to a high
of 27.4% in Mississippi
Percent of persons living
below the poverty threshold, 2019
Percent of persons living
below the poverty threshold, 2019
State
All
ages
Ages
0–17
Ages
18–64
Over
age 64 State
All
ages
Ages
0–17
Ages
18–64
Over
age 64
U.S. total 10.5% 14.4% 9.4% 8.9% Missouri 9.4% 12.7% 8.0% 9.7%
Alabama 12.9 18.1 11.0 12.6 Montana 9.7 11.9 9.7 7.3
Alaska 10.2 14.2 9.7 5.0 Nebraska 8.7 15.4 6.7 5.8
Arizona 9.9 14.5 8.4 9.1 Nevada 10.4 14.4 9.2 9.3
Arkansas 14.1 18.8 12.8 12.4 New Hampshire 3.7 3.6 3.5 4.0
California 10.1 13.9 9.1 8.6 New Jersey 6.3 6.8 5.0 10.2
Colorado 9.3 11.8 9.3 5.4 New Mexico 15.3 22.0 13.7 11.9
Connecticut 8.3 10.8 7.3 8.8 New York 12.5 17.4 11.4 10.6
Delaware 6.5 10.2 6.0 4.1 North Carolina 12.7 19.9 11.3 8.4
Dist. of Columbia 12.5 14.6 11.4 15.1 North Dakota 8.1 8.7 7.9 8.2
Florida 11.5 13.3 10.8 11.6 Ohio 12.4 19.5 11.3 6.9
Georgia 12.1 15.8 10.9 10.7 Oklahoma 10.8 12.8 10.6 8.5
Hawaii 8.4 11.0 7.9 7.0 Oregon 8.1 9.9 7.6 7.7
Idaho 7.1 8.5 7.5 3.3 Pennsylvania 8.7 12.1 8.0 7.0
Illinois 9.3 12.9 8.6 6.9 Rhode Island 9.2 13.8 7.3 10.4
Indiana 10.1 14.4 8.9 8.5 South Carolina 15.1 22.1 14.2 9.7
Iowa 9.5 13.7 9.2 4.9 South Dakota 10.6 17.2 8.7 7.0
Kansas 9.5 14.4 8.2 6.7 Tennessee 13.1 19.6 11.2 11.3
Kentucky 13.6 17.1 12.0 14.5 Texas 11.1 15.0 9.5 10.7
Louisiana 17.9 26.0 15.4 15.1 Utah 7.3 8.0 7.5 4.8
Maine 10.4 13.9 10.0 8.6 Vermont 8.6 13.1 8.7 4.5
Maryland 7.0 11.1 5.6 7.0 Virginia 8.8 11.7 8.0 8.3
Massachusetts 7.5 9.6 7.4 5.7 Washington 7.0 10.0 6.5 4.5
Michigan 10.2 14.3 9.8 6.7 West Virginia 13.9 18.6 13.3 10.9
Minnesota 5.7 7.4 5.4 4.2 Wisconsin 8.4 11.3 7.3 8.2
Mississippi 19.2 27.4 18.2 10.7 Wyoming 9.2 11.9 8.7 7.5
Q Nationally, 14.4% of youth under age 18—nearly 10.5 million—were living in poverty in 2019; the proportion of children living
in poverty exceeded the national average in 17 states and the District of Columbia.
Source: Author’s adaptation of the U.S. Census Bureau’s
Current Population Survey, 2019 Annual Social and Economic Supplement, POV46, Poverty
Status by State
.

Chapter 1: Youth population characteristics
9
In 2019, more than 1 in 4 Black children were living in poverty, and 1 in 8 were living in extreme poverty
(incomes less than half the poverty threshold)
Living below the poverty level Living below 50% of the poverty level
Age All White Black
Amer.
Indian Asian
Multiple
races Hispanic All White Black
Amer.
Indian Asian
Multiple
races Hispanic
All ages 10% 7% 19% 18% 7% 12% 16% 5% 3% 8% 9% 4% 6% 6%
Under age 18 14 8 27 21 8 14 21 6 4 12 11 4 8 8
Under age 5 16 9 31 25 6 20 21 7 4 14 11 3 10 9
Ages 5–17 14 8 26 20 8 12 20 6 4 11 11 4 7 7
Ages 18–64 9 7 16 16 7 11 13 4 4 7 9 4 5 5
Over age 64 9 2 19 21 10 6 16 4 3 7 9 5 2 7
Q There was little difference between the proportions of children in poverty compared with adults ages 18–64 in poverty for either White
or Asian populations in 2019. Children under age 18 in poverty and adults ages 18–64 in poverty differed by 8 percentage points in
the Hispanic population and 11 percentage points in the Black population.
Note: Racial categories (White, Black, American Indian, Asian, and multiple) do not include persons of Hispanic ethnicity. The Asian racial category in-
cludes Native Hawaiian and Other Pacific Islanders.
Source: Author’s adaptation of the U.S. Census Bureau’s
Microdata Access, CPS Annual Social and Economic Supplement 201903/202003
.
Proportion of youth (ages 0–17) living in poverty, 2019
0% to 10%
10% to 20%
20% to 30%
30% or more
Percent living
in poverty
Source: Authors analysis of the U.S. Census Bureau’s
Small Area Income and Poverty Estimates (SAIPE) Program: 2019 Poverty and Median Household
Income Estimates - Counties, States, and National.

Youth and the Juvenile Justice System: 2022 National Report
10
The proportion of children living in single-parent homes more
than doubled between 1970 and 2019
Children living with two parents
generally report less delinquency
Research by Johnson, Hoffman, and
Gerstein as well as Hemovich and
Crano found that adolescents ages
12–17 living with two parents were
less likely to use alcohol, cigarettes,
and illicit drugs than their counterparts
not living in two-parent families. Like-
wise, a review by Kroese and colleagues
notes that existing research links grow-
ing up in a single-parent household
with an increased likelihood of crime
among adolescents. However, it is im-
portant to note that family structure
may not be the proximate cause of
problem behaviors. Rather, conditions
within the family, such as poor supervi-
sion and low levels of parental involve-
ment, are risk factors.
More than one-third of children
living with only their mothers were
in poverty
The economic well-being of children is
related to family structure. In 2019, 14%
of all children lived below the poverty
level. However, children living in mar-
ried couple families were less likely to
live in poverty (6%) than children liv-
ing with only their fathers (16%) or
only their mothers (36%). Family struc-
ture is also related to the proportion of
children in households receiving public
assistance or food stamps. Overall, 3%
of children in 2019 lived in households
receiving public assistance and 17%
lived in households receiving food
stamps, but the proportions were far
greater for children living in single-
mother families.
Percent of children receiving assistance,
2019:
Living
arrangement
Food
stamps
Public
assistance
All types 17% 3%
Two parents 10 1
Married 8 1
Unmarried 29 5
Single parent 35 6
Mother only 39 6
Father only 18 2
Neither parent 27 10
Q Between 1970 and 2019, the proportion of children living with their mothers in
single-parent homes increased from 8% to 17% for White children and from 30%
to 48% for Black children. For children of Hispanic ethnicity, the proportion in-
creased from 20% in 1980 to 24% in 2019.
Notes: Beginning with 2007, estimates for two-parent homes include married or unmarried parents
(biological, step, or adoptive). Persons of Hispanic ethnicity can be of any race; however, most are
White. Race proportions include persons of Hispanic ethnicity.
Source: Author’s analysis of the U.S. Census Bureau’s
Current Population Survey, Families and Living
Arrangements, Historical Tables
.
71 77 83 89 95 01 07 13 19
0%
10%
20%
30%
40%
50%
60%
Percent of youth under age 18 living with mother only
White
Black
Hispanic
Year
The proportion of children living in single-parent homes more than
doubled between 1970 and 2019
Q In 2019, 70% of children were living in two-parent families—a level that has
changed little since 2007. Most other children live in single-parent households.
Q Most children in single-parent families lived with their mothers in 2019, but a grow-
ing proportion were living with their fathers. Since 1970, the proportion of children
in single-parent homes living with their fathers grew from 1% to 4% in 2019.
Despite a recent decline, Black children were more likely than White or
Hispanic children to live with only their mother in a single-parent home
71 77 83 89 95 01 07 13 19
0%
20%
40%
60%
80%
100%
Year
Percent of children (under 18) in living arrangement
Two parent
One parent
71 77 83 89 95 01 07 13 19
0%
5%
10%
15%
20%
25%
Year
Percent of children (under 18) in living arrangement
Mother only
Father only

Chapter 1: Youth population characteristics
11
In 2019, 51% of children receiving
public assistance and 49% receiving
food stamps lived in single-mother
families. Two-parent families accounted
for 30% of children receiving public
assistance and 40% of those receiving
food stamps.
Seven in ten children lived in two-
parent families in 2019
Based on the Census Bureau’s Current
Population Survey, 85% of children
under age 18 were living in two-parent
families in 1970. The proportion de-
clined into the mid-2000s, where it fell
to 67% in 2005. By 2019, 70% of chil-
dren were living in two-parent (married
or unmarried) families. Most other
children lived in one-parent households.
The proportion of children living in
single-parent households increased
from 9% in 1960 to 25% in 2019.
Beginning with the 2007 Current Pop-
ulation Survey, more accurate data are
available to document the proportion
of children who live with married or
unmarried parents. In 2019, 4% of
children under age 18 were living with
two unmarried parents, up slightly from
3% in 2007. In 2019, 66% of children
under age 18 lived with married par-
ents. This proportion was highest for
Asian (86%) and White children (75%),
lower for Hispanic children (68%), and
lowest for Black children (42%).
Most children who live in single-parent
households live with their mothers. In
fact, this was the second most common
living arrangement of children in 2019.
The proportion of children living with
their mothers in single-parent house-
holds grew from 8% of the child popu-
lation in 1960 to 21% in 2019. In
1970, the mothers of 7% of the chil-
dren living in single-mother house-
holds had never been married; this
proportion grew to 49% in 2019.
The proportion of children living with
their fathers in one-parent households
grew from 1% in 1970 to 4% in 2019.
In 1970, the fathers of 4% of the chil-
dren living in single-father households
had never been married; this propor-
tion grew to 39% in 2019, a pattern
similar to the mother-only households.
The Census Bureau found a major dif-
ference between mother-only and fa-
ther-only households: cohabitation was
much more common in father-only
households. A living arrangement is
considered to be cohabitation when
there is an unrelated adult of the oppo-
site gender, who is not one’s spouse,
living in the household. In 2019, chil-
dren living in single-parent households
were more likely to have a cohabiting
father (28%) than a cohabiting mother
(9%).
Some children live in households head-
ed by other relatives or by nonrelatives.
In 2019, 3% of children lived in house-
holds headed by other relatives, and
about half of these children were living
in the home of a grandparent. (Across
all household types, 10% of children
lived in households that included a
grandparent.) In 2019, 1% of all chil-
dren lived with nonrelatives.
Most children live in a household
with at least one parent in the
labor force
Overall, 88% of children in 2019 lived
in families with one or both parents in
the labor force, i.e., employed or ac-
tively looking for work. Of all children
living with two parents, 97% had at
least one parent in the labor force, and
62% had both parents in the labor
force. When just one parent in two-
parent families was in the labor force,
87% of the time it was the father.
Among children living in single-parent
households, those living with fathers
only were more likely to have the par-
ent in the labor force than those living
with mothers only (87% vs. 78%).
In 2019, Asian youth were most likely to live with two parents while
Black youth were least likely
Notes: Persons of Hispanic ethnicity can be of any race; however, most are White. Race proportions
include persons of Hispanic ethnicity.
Source: Author’s analysis of the U.S. Census Bureau’s
Current Population Survey, 2019 Annual Social
and Economic Supplement
.
Hispanic
Asian
Black
White
non-Hispanic
White
All races
0% 10% 20% 30% 40% 50% 60% 70% 80% 90% 100%
68% 24% 4% 4%
86% 10% 2% 2%
42% 46% 5% 7%
78% 14% 5% 3%
75% 17% 4% 3%
70% 21% 4% 4%
Percent of children (ages 0–17), 2019
Two parents, including unmarried parents
Mother only
Father only
Neither parent

Youth and the Juvenile Justice System: 2022 National Report
12
In 2019, 3.8 million youth ages 12–17 reported experiencing
a major depressive episode
Major depressive episodes in
adolescence can have long lasting
effects
The Substance Abuse and Mental
Health Services Administration (SAM-
HSA) annually conducts the National
Survey on Drug Use and Health to
collect information from persons ages
12 and older in the U.S. In addition to
gathering information about substance
use behaviors, the survey also collects
information about depression; specifi-
cally, respondents are asked to report
whether they have had a major depres-
sive episode (MDE) in the 12 months
prior to the survey. According to the
American Psychiatric Association, an
MDE is defined as a period of at least
2 weeks when a person experiences a
depressed mood or loss of interest or
In 2019, 16% of youth ages 12–17 reported a major depressive
episode in the past 12 months, and 43% of these youth received
treatment
Percentage of youth (ages 12–17) reporting
occurrence in the last 12 months
Demographic
Major depressive
episode (MDE)
MDE with severe
impairment
MDE and received
treatment
Total 16% 11% 43%
Age
Ages 12–13 11 7 38
Ages 14–15 16 12 44
Ages 16–17 20 15 46
Gender
Male 9 6 37
Female 23 17 46
Race/ethnicity
White, non-Hispanic 16 11 50
Black, non-Hispanic 11 8 36
Hispanic 17 12 37
American Indian 12 12 NA
Asian 15 11 NA
Two or more races 21 15 NA
Q In 2019, youth ages 16–17, females, and multi-racial youth were more likely to
report an MDE than their counterparts.
* Treatment refers to seeing or talking to a medical doctor or other professional or using prescrip-
tion medication for depression.
NA: Data not available.
Source: Author’s adaptation of the Federal Interagency Forum on Child and Family Statistics’
America’s Children: Key National Indicators of Well-being, 2021
.
pleasure in daily activities, plus at least
4 additional symptoms of depression
(e.g., problems with sleep, eating, en-
ergy, concentration, and feelings of
self-worth).
Depression is known to have effects
not only on mental health but also on
physical health and can affect adoles-
cent development. As noted in the
2021 America’s Children: Key Nation-
al Indicators of Well-Being
report, fa-
milial and peer relationships may be-
come strained, depressive episodes
may continue into adulthood, academ-
ic performance may suffer, and youth
who reported at least one major de-
pressive episode in the prior 12 months
are more likely to begin using alcohol
or other drugs and are at greater risk
for suicide.
The likelihood of experiencing a
major depressive episode varied
by demographics
In 2019, 1 in 6 (16%) youth ages
12–17 reported having at least one
MDE in the prior 12 months. Older
youth (youth ages 16–17) and females
were more likely to report an MDE
compared with their counterparts. The
proportion of youth who reported hav-
ing an MDE was similar for White and
Hispanic youth and was higher than
the proportion for Black youth.
Approximately 1 in 10 (11%) youth
ages 12–17 reported having at least
one MDE that involved severe impair-
ment in the prior 12 months. That is,
the MDE adversely impacted the re-
spondent’s life in relation to home
management, work, close relationships
with others, and social life. Fewer than
half (43%) of youth who had at least
one MDE in the prior 12 months re-
ceived treatment. Compared with their
counterparts, youth ages 14 and older,
females, and White youth were more
likely to have received treatment.
A small proportion of youth
experienced an MDE and a
substance use disorder
According to SAMHSA, 2.7% of youth
reported having a substance abuse dis-
order (SUD) in the prior 12 months.
SUDs are characterized by impairment
caused by routine use of alcohol and/
or other drugs, that results in health
problems and failure to meet responsi-
bilities at home, work, or school.
Fewer than 2 in 100 youth (1.7%) re-
ported having both an MDE and SUD
in the prior 12 months. A similar pro-
portion of youth (1.4%) reporting an
SUD also reported having an MDE
with severe impairment. Compared
with youth who did not experience an
MDE in the prior 12 months, MDE
youth were more likely to have used il-
licit drugs, marijuana, or opioids, to
binge drink alcohol, or to smoke ciga-
rettes in the prior month.

Chapter 1: Youth population characteristics
13
The proportion of youth ages 12–17 experiencing at least one major depressive episode has increased for all
demographic groups in recent years
2005 2007 2009 2011 2013 2015 2017 2019
0%
5%
10%
15%
20%
25%
Percent of youth (ages 12−17) reporting a major depressive
episode (MDE) in the last 12 months
Female
Male
Total
2005 2007 2009 2011 2013 2015 2017 2019
0%
10%
20%
30%
40%
50%
Of youth reporting MDE, percent reporting receivng
treatment in the last 12 months
Female
Male
Total
Q The proportion of youth reporting an MDE in 2019 (16%) increased 7 percentage points since 2004. Females (+10%), youth ages
16–17 (+8%), and White youth (+7%) had the largest percentage point increases between 2004 and 2019.
Q Overall, the likelihood of receiving treatment following an MDE increased 3 percentage points between 2004 and 2019, but the
level of increase varied by youth demographics.
Source: Author’s adaptation of the Federal Interagency Forum on Child and Family Statistics’
America’s Children: Key National Indicators of Well-being,
2021
.
2005 2007 2009 2011 2013 2015 2017 2019
0%
5%
10%
15%
20%
25%
Percent of youth (ages 12−17) reporting a major depressive
episode (MDE) in the last 12 months
Ages 16−17
Ages 12−13
Ages 14−15
2005 2007 2009 2011 2013 2015 2017 2019
0%
10%
20%
30%
40%
50%
Of youth reporting MDE, percent reporting receivng
treatment in the last 12 months
Ages 16−17
Ages 12−13
Ages 14−15
2005 2007 2009 2011 2013 2015 2017 2019
0%
4%
8%
12%
16%
20%
Percent of youth (ages 12−17) reporting a major depressive
episode (MDE) in the last 12 months
Hispanic
White
Black
2005 2007 2009 2011 2013 2015 2017 2019
0%
10%
20%
30%
40%
50%
60%
Of youth reporting MDE, percent reporting receivng
treatment in the last 12 months
Black
Hispanic
White

Youth and the Juvenile Justice System: 2022 National Report
14
The teenage birth rate declined considerably since the early
1990s
Teen birth rates reached a new
low point in 2019
Research suggests (see Martin et al.,
Ely and Driscoll, Hoffman and May-
nard, and Driscoll) that giving birth
during adolescence brings long-term
difficulties for the teen mother and her
child. Compared with babies born to
older mothers, babies born to adoles-
cent mothers, particularly younger ad-
olescent mothers, are at higher risk for
low birthweight and infant mortality.
In addition, giving birth during adoles-
cence is linked to limited educational
attainment for the teen mom, which
can adversely impact their employment
opportunities and future earnings, and
children born to teen moms are them-
selves less likely to complete high
school.
In 2019, the birth rate for older youth
(i.e., females ages 15–17) was 6.7 live
births for every 1,000 females in the
age group. In the same year, the birth
rate for young adults (i.e., women ages
18 and 19) was more than 4 times
greater (31.1). Conversely, the birth
rate for females ages 10–14 (0.2) was
well below the rates of older teens.
Teen birth rates have been on the de-
cline since 1991, but the decline for fe-
males ages 15–17 (83%) outpaced the
decline for young adults (67%)
through 2019. The rate for both age
groups in 2019 reached their lowest
levels since 1970. Birth rates for older
teens and young adults varied by race
and Hispanic ethnicity.
Births per 1,000 females, 2019:
Race/ethnicity
Ages
15–17
Ages
18–19
All races 6.7 31.1
White 3.8 22.3
Black 11.1 46.4
Hispanic 11.5 46.2
American Indian 13.5 51.8
Asian 0.9 5.2
Native Hawaiian/
Other Pacific Islander
7.7 53.8
Note: Race groups exclude persons of
Hispanic ethnicity. Hispanic youth can be
of any race.
The birth rate for White females ages
15–17 in 2019 was about one-third
the rates of Hispanic, Black, and Amer-
ican Indian females of the same age,
and about half the rate of Native Ha-
waiian/Other Pacific Islander females.
Across race/ethnicity groups, the birth
rate for females ages 15–17 declined
70% or more between 1991 and 2019,
and reached their lowest level since
1990.
Birth rates in 2019 for both females ages 15–17 and young adults ages
18–19 were at their lowest level since 1970
55 59 63 67 71 75 79 83 87 91 95 99 03 07 11 15 19
0
10
20
30
40
50
60
70
80
90
100
0%
10%
20%
30%
40%
50%
60%
70%
80%
90%
100%
Year
Births per 1,000 females ages 15−19
Birth rate
Births to unmarried females
Percent of births to females ages 15−19
71 77 83 89 95 01 07 13 19
0
20
40
60
80
100
120
Year
Births per 1,000 females in age group
Ages 15−17
Ages 18−19
71 77 83 89 95 01 07 13 19
0
10
20
30
40
Year
Births per 1,000 females in age group
Ages 15−17
Q The birth rate for teens ages 15–17 fell 21% between 1970 and 1986 and then in-
creased over the next 5 years back to its 1970 level. The birth rate for young adult
females ages 18–19 dropped even more than the rate for teens ages 15–17 be-
tween 1970 and 1986, falling 31%. Although the rate for young adults also in-
creased through 1991, the rate did not return to its 1970 level.
Q Since 1991, teen birth rates declined considerably; by 2019, the rates for both age
groups reached their lowest level since at least 1970.
The annual birth rate for females ages 15–19 declined substantially
between 1955 and 2019, while the proportion of these births that were
to unmarried women increased
Q In 1955, about 14% of births to females ages 15–19 were to unmarried women. By
2019, that proportion grew to 91%.
Source: Authors’ adaptation of Martin et al.’s Births: Final Data for 2019,
National Vital Statistics Re-
ports
, 70(2); National Center for Health Statistics’ annual series, Births: Final Data,
National Vital Statis-
tics Reports
, for the years 2000–2009; and Ventura et al.’s Births to Teenagers in the United States,
1940–2000,
National Vital Statistics Reports
, 49(10).

Chapter 1: Youth population characteristics
15
Birth rates for females ages 15–17 varied greatly across states in
2019, ranging from 1.7 in New Hampshire to 12.6 in Mississippi
Births per 1,000 females in age group, 2019
Ratio of ages
15–17 to 18–19State Age 15–19 Ages 15–17 Ages 18–19
United States 16.7 6.7 31.1 22%
Alabama 25.6 10.1 47.8 21
Alaska 18.3 6.2 39.9 16
Arizona 18.5 8.3 33.0 25
Arkansas 30.0 11.2 58.3 19
California 12.4 5.0 23.1 22
Colorado 13.9 6.1 25.7 24
Connecticut 7.7 3.3 13.5 24
Delaware 14.9 6.7 25.8 26
Dist. of Columbia 16.8 11.8 20.2 58
Florida 16.2 6.1 31.3 19
Georgia 19.7 8.0 36.8 22
Hawaii 15.7 5.4 32.0 17
Idaho 14.9 5.0 30.7 16
Illinois 14.6 5.8 28.0 21
Indiana 20.8 7.9 39.5 20
Iowa 14.1 5.1 26.5 19
Kansas 19.2 7.3 36.8 20
Kentucky 24.9 9.4 47.6 20
Louisiana 27.8 10.9 53.9 20
Maine 9.1 2.7 18.0 15
Maryland 13.9 6.0 25.5 24
Massachusetts 6.9 3.0 11.3 27
Michigan 15.1 5.5 28.9 19
Minnesota 10.1 3.7 19.9 19
Mississippi 29.1 12.6 53.1 24
Missouri 20.3 7.6 39.2 19
Montana 16.3 6.1 32.0 19
Nebraska 15.3 6.7 27.8 24
Nevada 18.9 7.0 39.5 18
New Hampshire 6.6 1.7 13.2 13
New Jersey 10.0 4.1 19.6 21
New Mexico 24.4 10.8 44.8 24
New York 11.4 4.7 20.6 23
North Carolina 18.2 7.7 32.6 24
North Dakota 15.6 5.3 29.5 18
Ohio 18.8 6.9 36.0 19
Oklahoma 27.4 11.0 52.1 21
Oregon 12.1 4.1 24.0 17
Pennsylvania 13.3 6.0 23.1 26
Rhode Island 10.0 4.7 15.6 30
South Carolina 21.6 8.5 39.8 21
South Dakota 19.2 8.6 34.9 25
Tennessee 23.7 8.9 46.6 19
Texas 24.0 10.7 44.6 24
Utah 12.0 3.8 24.9 15
Vermont 7.6 3.0 12.3 24
Virginia 13.6 5.3 25.1 21
Washington 12.7 4.5 25.4 18
West Virginia 25.2 9.1 49.3 18
Wisconsin 12.5 4.5 24.0 19
Wyoming 19.4 6.6 39.2 17
Q
Comparing birth rates for females ages 15–17 with those of young adults (ages 18
and 19) shows that the 15–17-year-old rate ranged from 13% of the young adult rate
in New Hampshire to 30% of the young adult rate in Rhode Island and 58% in the
District of Columbia.
Source: Authors’ adaptation of Martin et al.’s Births: Final Data for 2019,
National Vital Statistics
Reports
, 70(2).
The teenage birth rate in the
U.S. ranks among the highest
of industrialized nations
Birth rates for a large number of
countries are collected and dissemi-
nated by the World Health Organi-
zation. The most recent data avail-
able for industrialized countries
were not available for a common
year but ranged from 2016 to 2019.
Births per 1,000 females ages 15–19
Country
Birth
rate
Data
year
Russian Federation 21.5 2016
United States 16.7 2019
New Zealand 13.3 2019
United Kingdom 11.9 2018
Australia 9.4 2018
France 8.6 2018
Greece 8.6 2018
Israel 8.2 2018
Portugal 7.3 2018
Germany 7.2 2018
Canada 6.6 2018
Ireland 6.2 2018
Spain 6.2 2018
Austria 5.5 2018
Belgium 5.5 2018
Finland 4.3 2018
Sweden 4.2 2018
Italy 4.1 2018
Japan 3.1 2018
Netherlands 2.6 2018
Norway 2.6 2018
Switzerland 2.3 2018
Denmark 2.0 2019
Source: Authors’ adaptation of the
World Health Organization’s Global
Health Observatory, Adolescent Birth
Rate (per 1000 Women Aged 15-19
Years).
The birth rate for U.S. females ages
15–19 remained one of the highest
among industrialized nations. In
2010, however, the U.S. birth rate
for females ages 15–19 occupied
the top spot on this list. Following a
50% decline since 2010, the U.S.
rate now ranks second, more than
20% below the most recent rate for
the Russian Federation, but about
25% above the rate for New Zea-
land.

Youth and the Juvenile Justice System: 2022 National Report
16
The high school dropout rate declined in the last 5 years, yet
more than 470,000 youth left high school in 2019
The dropout rate varies across
demographic groups
The National Center for Education
Statistics (NCES) publishes annual sta-
tistics of (1) the number of persons in
grades 10–12 who dropped out of
school in the preceding 12 months,
and (2) the percent of persons ages
16–24 who were dropouts. The first
statistic (the event dropout rate) pro-
vides an estimate of flow into the
dropout pool. The second statistic (the
status dropout rate) provides an esti-
mate of the proportion of dropouts in
the young adult population. Event
dropout rates are based on data from
the annual October Current Popula-
tion Survey (CPS). The CPS and the
American Community Survey (ACS)
are the sources for the status dropout
estimates.
Approximately 4 of every 100 persons
(4%) enrolled in high school in Octo-
ber 2018 left school before October
2019 without successfully completing a
high school program—in other words,
in the school year 2018-2019, about
470,000 youth dropped out and the
event dropout rate was 4.3%. The
2019 event dropout rate for males
(4.1%) was slightly lower than for fe-
males (4.5%), and the rates for White
(4.0%) and Black (4.1%) youth, were
less than the rate for Hispanic (5.7%)
youth.
Dropout rates are greater for
institutionalized youth than
noninstitutionalized youth
Over the years, demographic disparities
in annual event dropout rates have ac-
cumulated to produce noticeable dif-
ferences in status dropouts rates—i.e.,
the proportion of young adults (person
ages 16–24) who are not enrolled in
school and have not completed high
school (or received an equivalency cer-
tificate). The status dropout rate mea-
sure typically includes civilian, nonin-
Notes: Race groups exclude persons of Hispanic ethnicity. Persons of Hispanic ethnicity can be of any
race.
Source: Author’s adaptation of National Center for Education Statistics,
Digest of Education Statistics:
2019
, Table 219.55.
In 2019, dropout rates were highest for females, Hispanic youth, and
students living in western states
Total Male Female White Black Hispanic North-
east
Mid-
west
South West
0%
1%
2%
3%
4%
5%
6%
7%
4.3%
4.1%
4.5%
4.0%
4.1%
5.7%
4.5%
3.2%
3.7%
6.0%
Percent of youth who dropped out of grades 10−12 in the preceeding 12 months
Notes: Race groups exclude persons of Hispanic ethnicity. Persons of Hispanic ethnicity can be of any
race.
Source: Author’s adaptation of National Center for Education Statistics,
Digest of Education Statistics:
2019
, Table 219.55.
Dropout rates for White youth have remained below the rates of Black
and Hispanic youth
91 93 95 97 99 01 03 05 07 09 11 13 15 17 19
0%
2%
4%
6%
8%
10%
12%
14%
Percent of youth who dropped out of grades 10−12 in the preceding 12 months
Hispanic
Black
White
Total
Year

Chapter 1: Youth population characteristics
17
stitutionalized 16–24-year-olds. Youth,
such as those who are incarcerated or
in the military, are not included. How-
ever, the ACS allows for comparisons
of status dropout rates for 16–24-year-
olds living in households and noninsti-
tutionalized group quarters (i.e., col-
lege housing or military housing
located within the U.S.) with those liv-
ing in institutionalized group quarters
(i.e., prisons, nursing facilities, or other
healthcare facilities). Regardless of
race/ethnicity, status dropout rates
were substantially higher for institu-
tionalized youth than for other youth.
In 2019, the status dropout rate was
30% for institutionalized youth and 5%
for those living in households and non-
institutional group quarters.
Educational failure is linked to
unemployment
The Bureau of Labor Statistics (BLS)
estimates that 38% of the 2018-2019
school year dropouts ages 16–24 were
in the labor force (employed or actively
looking for work), though 15% of
those dropouts were unemployed. In
comparison, 72% of the 2019 high
school graduates who were not in col-
lege were in the labor force, and a
greater proportion of this workforce
(18%) was unemployed.
Failing to complete high school
results in lower earnings
According to the Career Outlook re-
port by BLS, persons ages 25 and
older with less than a high school di-
ploma had the lowest median weekly
earnings and the highest unemploy-
ment rate. In 2019, for example, the
median weekly earnings among persons
ages 25 and older was 20% less for
those without a high school diploma
than those who completed high
school, and more than 50% less than
persons with a bachelor’s degree.
Q Among 25–34-year-olds who worked full-time, year-round in 2019, the median
earnings of those whose highest level of education was a high school diploma was
about 20% higher than those who did not complete high school, and the median
earnings of those who completed a bachelor’s or higher degree was more than
twice that of persons who did not complete high school.
*Includes equivalency credentials, such as the GED.
Source: Author’s adaptation of Irwin et al’s
Report on the Condition of Education
.
In 2019, persons who completed high school earned about $5,700 more
than those who did not complete high school
All
education
levels
Less than
high school
completion
High
school
completion*
Some
college,
no degree
Associate’s
degree
Bachelor’s
degree
or higher
$0
$10,000
$20,000
$30,000
$40,000
$50,000
$60,000
$70,000
$46,700
$29,300
$35,000
$39,700
$40,000
$59,700
Median annual earnings of full-time, year-round workers ages 25−34, 2019
The status dropout rate decreased for both noninstitutionalized and
institutionalized youth between 2010 and 2019
Status dropout rate
Noninstitutionalized Institutionalized
Race/ethnicity 2010 2019 2010 2019
Total 8% 5% 37% 30%
White, non-Hispanic 5 4 29 22
Black, non-Hispanic 9 5 42 35
Hispanic 16 7 44 35
American Indian/Alaskan Native 15 9 39 26
Asian 3 2 28 31
Two or more races, non-Hispanic 6 5 23 25
Q Among noninstitutionalized youth, American Indian/Alaskan Native and Hispan-
ic youth had higher status dropout rates than all other racial groups in 2010
and 2019. For institutionalized youth, Black and Hispanic youth had higher sta-
tus dropout rates in both years.
Q The status dropout rate among institutionalized youth decreased among most
racial groups between 2010 and 2019.
Notes: Status dropouts are 16–24-year-olds who are not enrolled in school and who have not
completed a high school program (including equivalency credentials, such as the GED). Noninsti-
tutionalized persons include those living in households, college housing, or military housing located
within the U.S. and institutionalized persons include those living in prisons, nursing facilities, or
other healthcare facilities.
Source: Author’s adaptation of the National Center for Education Statistics’
Digest of Education
Statistics: 2019
, Table 219.80.

Youth and the Juvenile Justice System: 2022 National Report
18
Sources
Agnew, R., Matthews, S., Bucher, J.,
Welcher, A., and Keyes, C. 2008. So-
cioeconomic status, economic prob-
lems, and delinquency.
Youth and Soci-
ety
, 40(2).
American Psychiatric Association.
2000.
Diagnostic and Statistical Manu-
al of Mental Disorders
(4th ed.).
Driscoll, A. 2014. Adult outcomes of
teen mothers across birth cohorts.
De-
mographic Research
, 30(44).
Ely, D. M., and Driscoll, A. K. 2020.
Infant mortality in the United States,
2018: Data from the period linked
birth/infant death file.
National Vital
Statistics Reports
, 69(7). Washington,
DC: National Center for Health Statis-
tics.
Federal Interagency Forum on Child
and Family Statistics.
America’s Chil-
dren: Key National Indicators of Well-
being, 2021
. Health tables 4.A, 4.B,
and 4.C. Available from www.
childstats.gov/americaschildren/tables.
asp.
Hawkins, J., Herrenkohl, T., Far-
rington, D., Brewer, D., Catalano, R.,
Harachi, T., and Cothern, L. 2000.
Predictors of Youth Violence
. Washing-
ton, DC: U.S. Department of Justice,
Office of Justice Programs, Office of
Juvenile Justice and Delinquency Pre-
vention.
Hemovich, V., and Crano, W. 2009.
Family structure and adolescent drug
use: An exploration of single-parent
families.
Substance Use & Misuse
,
44(1).
Hoffman, S., and Maynard, R. (Eds.).
2008.
Kids Having Kids: Economic
Costs and Social Consequences of
Teen Pregnancy
. Washington, DC:
Urban Institute Press.
Irwin, V., Zhang, J., Wang, X., Hein,
S., Wang, K., Roberts, A., York, C.,
Barmer, A., Bullock Mann, F., Dilig,
R., and Parker, S. 2021.
Report on the
Condition of Education 2021
. Wash-
ington, DC: National Center for Edu-
cation Statistics, U.S. Department of
Education.
Jarjoura, G., Triplett, R., and Brinker,
G. 2002. Growing up poor: Examining
the link between persistent childhood
poverty and delinquency.
Journal of
Quantitative Criminology
, 18(2).
Johnson, R., Hoffman, D., and Ger-
stein, D. 1996.
The Relationship Be-
tween Family Structure and Adolescent
Substance Use
. Washington, DC: Sub-
stance Abuse and Mental Health Ser-
vices Administration, U.S. Department
of Health and Human Services.
Kroese, J., Bernasco, W., Liefbroer, C.,
and Rouwendal, J. 2021. Growing up
in single-parent families and the crimi-
nal involvement of adolescents: A sys-
tematic review.
Psychology, Crime &
Law
, 27(1).
Martin, J., Hamilton, B., Osterman,
M., and Driscoll, A. 2021. Births:
Final data for 2019.
National Vital Sta-
tistics Reports
, 70(2). Washington,
DC: National Center for Health Statis-
tics.
National Center for Education Statis-
tics. 2020.
Digest of Education Statis-
tics
. Table 219.80, Total number 16-
to 24-year-old high school dropouts
(status dropouts) and percentage of
dropouts among persons 16 to 24
years old (status dropout rate), by se-
lected characteristics: 2007 through
2019. Available from nces.ed.gov/pro-
grams/digest/d20/tables/
dt20_219.80.
National Center for Education Statis-
tics. 2021.
Digest of Education Statis-
tics
. Table 219.55, Among 15- to
14-year-olds enrolled in grades 10
through 12, percentage who dropped
out (event dropout rate), by sex and
race/ethnicity: 1972 through 2019.
Available from nces.ed.gov/programs/
digest/d20/tables/dt20_219.55.
National Center for Health Statistics
2012.
Intercensal Estimates of the Res-
ident Population of the United States
for July 1, 2000–July 1, 2009, by Year,
County, Single-year of Age (0, 1, 2, ..,
85 Years and Over), Bridged Race,
Hispanic Origin, and Sex
. Prepared
under a collaborative arrangement with
the U.S. Census Bureau. Available
from www.cdc.gov/nchs/nvss/
bridged_race.htmas of October 26,
2012, following release by the U.S.
Census Bureau of the unbridged inter-
censal estimates by 5-year age group
on October 9, 2012. [Retrieved Octo-
ber 26, 2012].
National Center for Health Statistics
2021.
Vintage 2020 Postcensal Esti-
mates of the Resident Population of
the United States (April 1, 2010, July
1, 2010–July 1, 2020), by Year, Coun-
ty, Single-year of Age (0, 1, 2, .., 85
Years and Over), Bridged Race, His-
panic Origin, and Sex
. Prepared under
a collaborative arrangement with the
U.S. Census Bureau. Available from
www.cdc.gov/nchs/nvss/bridged_
race.htm as of September 22, 2021,
following release by the U.S. Census
Bureau of the unbridged Vintage 2020
postcensal estimates by 5-year age
groups on June 17, 2021. [Retrieved
September 23, 2021].
Puzzanchera, C., Sladky, A., and Kang,
W. 2021.
Easy Access to Juvenile Pop-
ulations: 1990-2020
. Available from
www.ojjdp.gov/ojstatbb/ezapop.

Chapter 1: Youth population characteristics
19
Substance Abuse and Mental Health
Services Administration. 2020.
Key
substance use and mental health indi-
cators in the United States: Results
from the 2019 National Survey on
Drug Use and Health
(HHS Publica-
tion No. PEP20-07-01-001, NSDUH
Series H-55). Rockville, MD: Center
for Behavioral Health Statistics and
Quality, Substance Abuse and Mental
Health Services Administration. Avail-
able from www.samhsa.gov/data.
U.S. Bureau of Labor Statistics. 2020.
Learn more, earn more: Education
leads to higher wages, lower unem-
ployment.
Career Outlook
. Available
from www.bls.gov/careeroutlook/
2020/data-on-display/education-pays.
htm.
U.S. Census Bureau.
Current Popula-
tion Survey, 2019 Annual Social and
Economic Supplement
. Table C8: Pov-
erty status, food stamp receipt, and
public assistance for children under 18
years. Available from www2.census.
gov/programs-surveys/demo/tables/
families/2019/cps-2019. [Released
November 2019].
U.S. Census Bureau.
Current Popula-
tion Survey, 2019 Annual Social and
Economic Supplement
. Table POV46:
Poverty status by state. Available from
www.census.gov/data/tables/
time-series/demo/income-poverty/
cps-pov/pov-46.2019.html.
U.S. Census Bureau.
Current Popula-
tion Survey, Historical Poverty Tables
.
Table 3: Poverty status of people by
age, race, and Hispanic origin: 1959–
2019. Available from www.census.gov/
data/tables/time-series/demo/
income-poverty/historical-poverty-
people.html.
U.S. Census Bureau.
Current Popula-
tion Survey (CPS) Table Creator
.
Available from www.census.gov/cps/
data/cpstablecreator.html. [Retrieved
November 2018].
U.S. Census Bureau.
Microdata Access,
CPS Annual Social and Economic
(March) Supplement 201903/202003
.
Available from data.census.gov/
mdat/#. [Retrieved April 2021].
U.S. Census Bureau.
Poverty Thresh-
olds for 2019 by Size of Family and
Number of Related Children Under 18
Years
. Available from www.census.gov/
data/tables/time-series/demo/
income-poverty/historical-poverty-
thresholds.html.
U.S. Census Bureau.
Small Area In-
come and Poverty Estimates (SAIPE)
Program: 2019 Poverty and Median
Household Income Estimates - Coun-
ties, States, and National
. Available
from www.census.gov/library/
publications/020/demo/p30-08.html.
[Released December 2020].
U.S. Census Bureau.
U.S. Pop u la tion
Es ti mates by Age, Sex, Race, and His-
pan ic Origin: 1980 to 1999
. Available
from www.census.gov/popest/
archives/1990s/nat-detail-layout.txt.
[Re leased April 11, 2000].
Vespa, J., Median, L., and Armstrong,
D. 2020. Demographic turning points
for the United State: Population pro-
jections for 2020 to 2060.
Current
Population Reports
, P25-114. Wash-
ington, DC: U.S. Census Bureau.
Available from www.census.gov/
content/dam/Census/library/
publications/2020/demo/p25-1144.
pdf.
World Health Organization.
The Glob-
al Health Observatory, Adolescent
Birth Rate (per 1000 Women Aged
15-19 Years)
. Available from www.
who.int/data/gho/data/indicators/
indicator-details/GHO/adolescent-
birth-rate-(per-1000-women-aged-15-
19-years).

Youth and the Juvenile Justice System: 2022 National Report
21
Chapter 2
Youth victims
2
This chapter summarizes what is
known about the prevalence and inci-
dence of youth victimizations. It an-
swers important questions to assist
policy makers, practitioners, research-
ers, and concerned citizens in devel-
oping policies and programs to ensure
the safety and well-being of children.
How many children are abused and
neglected? What are the trends in
child maltreatment? How often are
youth the victims of crime? How
many children are victims of crime at
school and what are the characteristics
of school crime? When and where are
youth most likely to become victims
of crime? How many youth are mur-
dered each year? How often are fire-
arms involved in youth murders and
who are their offenders? How many
youth commit suicide?
Research has shown that child victim-
ization and abuse are linked to nega-
tive outcomes, such as antisocial and
criminal behavior. So an understanding
of childhood victimization and its
trends may lead to a better under-
standing of youth offending.
Data sources include child maltreat-
ment data reported by the National
Child Abuse and Neglect Data System,
and foster care and adoption informa-
tion from the Adoption and Foster
Care Analysis and Reporting System.
Self-reported victimization data are
presented from the Bureau of Justice
Statistics’ National Crime Victimiza-
tion Survey and it’s School Crime
Supplement, the National Center for
Education Statistics, and the Youth
Risk Behavior Survey. Official victim-
ization data is reported by the Federal
Bureau of Investigation’s National In-
cident-Based Reporting System and its
Supplementary Homicide Reporting
Program. Suicide information is pre-
sented from the National Center for
Health Statistics.

Youth and the Juvenile Justice System: 2022 National Report
22
In 2019, child protective services agencies received about
84,600 maltreatment referrals each week
The National Child Abuse and
Neglect Data System monitors
child protective services caseloads
In response to the 1988 amendments
to the Child Abuse Prevention and
Treatment Act, the Children’s Bureau
in the U.S. Department of Health and
The National Child Abuse and Neglect Data System counts
several different aspects of child maltreatment
Referral: Notification to the CPS
agency of suspected child maltreat-
ment. This can include more than one
child. This is a measure of “flow” into
the CPS system.
Report: A referral of child maltreat-
ment that was accepted, or “screened
in,” for an investigative response or
an alternative response by a CPS
agency.
Investigation: The gathering and as-
sessment of objective information to
determine if a child has been or is at
risk of being maltreated and to deter-
mine if a CPS response is needed. An
investigation typically involves an in-
person meeting with the alleged child
victim and results in a disposition as
to whether or not the alleged mal-
treatment occurred.
Assessment: The process by which
the CPS agency determines if a child
or other person involved in a report of
alleged maltreatment needs services.
Alleged victim: Child about whom a
referral regarding maltreatment has
been made to a CPS agency.
Alleged perpetrator: Person who is
named in a referral to have caused or
knowingly allowed the maltreatment
of a child.
Victim: A child having a maltreatment
disposition of substantiated or indi-
cated. This includes a child who died
and the death was confirmed to be
the result of child abuse and neglect.
Perpetrator: Person who has been de-
termined to have caused or knowingly
allowed the maltreatment of a child.
Substantiated: An investigation dispo-
sition that concludes that the allega-
tion of maltreatment (or risk of mal-
treatment) was supported by or
founded on state law or state policy.
This is the highest level of finding by a
CPS agency.
Unsubstantiated: An investigation dis-
position that determines that there is
insufficient evidence under state law
to conclude or suspect that the child
has been maltreated or is at risk of
maltreatment.
Indicated: A disposition that con-
cludes that maltreatment could not be
substantiated under state law or poli-
cy, but there is reason to suspect that
the child may have been maltreated or
was at risk of maltreatment. Few
states distinguish between substanti-
ated and indicated dispositions.
Alternative response: The provision of
a response other than an investigation
that determines a child or family is in
need of services. A determination of
maltreatment is not made and a per-
petrator is not determined.
Court action: Legal action initiated by
the CPS agency on behalf of the child.
This includes authorization to place
the child in foster care, filing for tem-
porary custody or dependency, or ter-
mination of parental rights. As used
here, it does not include criminal pro-
ceedings against a perpetrator.
Human Services developed the Nation-
al Child Abuse and Neglect Data Sys-
tem (NCANDS) to collect child mal-
treatment data voluntarily submitted
by state child protective services (CPS)
agencies. The Children’s Bureau annu-
ally collects and analyzes both summa-
ry and case-level data reported to
NCANDS. For 2019, 50 states, the
District of Columbia, and Puerto Rico
reported case-level data on all children
who received an investigation or assess-
ment by a CPS agency. The case-level
data provide descriptive information on
cases referred to CPS agencies during
the year, including:
Q Characteristics of the referral of
abuse or neglect made to CPS.
Q Characteristics of the victims.
Q Alleged maltreatments.
Q Disposition (or findings).
Q Risk factors of the child and the
caregivers.
Q Services provided.
Q- Characteristics of the perpetrators.
In 2019, referrals were made to
CPS agencies at a rate of 59 per
1,000 children
In 2019, CPS agencies in the U.S. re-
ceived an estimated 4.4 million refer-
rals alleging that children were abused
or neglected. An estimated 7.9 million
children were included in these refer-
rals. This translates to a rate of 59 re-
ferrals for every 1,000 children young-
er than 18 in the U.S. population. The
2019 rate was 14% above the referral
rate in 2015 (52.3).
Professionals were the most
common source of maltreatment
reports
Professionals who come into contact
with children as a part of their occupa-
tion (e.g., teachers, police officers,
doctors, childcare providers) are re-
quired by law in most states to notify
CPS agencies of suspected maltreat-
ment. Thus, professionals are the most
common source of maltreatment re-
ports (69%).

Chapter 2: Youth victims
23
Profile of maltreatment reports, 2019:
Source
Percent
of reports
Professional 68.5%
Educator 21.0
Law enforcement 19.1
Medical 11.0
Social services 10.3
Mental health 6.0
Child daycare provider 0.7
Foster care provider 0.4
Family and community 21.8
Parents 5.9
Other relatives 5.9
Friend or neighbor 3.5
Anonymous 6.5
Other* 9.6
*Includes alleged victims, alleged perpetrators,
and sources not otherwise identified.
Note: Detail may not sum to 100% because of
rounding.
The typical CPS response time
was 4 days in 2019
CPS agencies receive referrals of vary-
ing degrees of urgency; therefore, the
time from referral to investigation var-
ies widely. State response time stan-
dards also vary. Some states set a single
standard and others set different stan-
dards depending on the priority or ur-
gency of the case. Many specify a high-
priority response as within 24 hours;
some specify 1 hour. Lower priority re-
sponses range from 24 hours to several
days. In 2019, the average response
time for states that reported this infor-
mation was 4.3 days.
CPS investigated or provided an
alternative response to more than
half of all referrals
In 2019, CPS agencies screened in
54% of all referrals received. Thus, CPS
agencies conducted investigations or
alternative responses for more than 1.9
million reports in 2019. Once a report
is investigated or assessed and a deter-
mination is made as to the likelihood
that maltreatment occurred or that the
child is at risk of maltreatment, CPS
assigns a finding to the report—known
as a disposition. States’ dispositions
and terminology vary but generally fall
into the following categories: substan-
tiated, indicated, alternative response
(victim and nonvictim), and unsubstan-
tiated (see the box on the previous
page).
Most subjects of reports are found
to be nonvictims
Of children who were the subject of at
least one report of maltreatment, most
were found to be nonvictims: 56.5%
had dispositions of unsubstantiated,
10.6% had dispositions of no alleged
maltreatment, and 13.8% had disposi-
tions of alternative response. About
one in six (17%) children who were the
subject of at least one report were
found to be victims of maltreatment.
The most common disposition for vic-
tims of maltreatment was substantiated
(16%), and 1% of victims received a
disposition of indicated.
The average CPS investigator
handled about 71 reports in 2019
In most sizable jurisdictions, different
CPS personnel perform screening and
investigation functions. In smaller
agencies, one staff person may perform
both functions. In 2019, the average
yearly number of investigations or as-
sessments per investigation worker was
71. Among states with specialized
screening and investigation workers,
the investigation workers outnumbered
2005 2007 2009 2011 2013 2015 2017 2019
0
10
20
30
40
50
Number per 1,000 children ages 0−17
Child maltreatment investigation/assessment recipients
Maltreatment victims
The child maltreatment response rate increased 17% in the last 10
years, while the maltreatment victimization rate changed little
Q In 2019, CPS agencies responded to reports involving nearly 3.5 million unique
child victims, or 47.2 per 1,000 children ages 0–17 in the United States. These re-
sponses included formal investigations, family assessments, and other alternative
responses.
Q An estimated 656,000 unique children were found to be victims—19% of all chil-
dren who received an investigation or assessment in 2019.
Q The national child victimization rate in 2019 was 8.9 victims per 1,000 children ages
0–17, 4% below the rate 10 years prior.
Note: a child was counted once regardless of the number of times they received a CPS response or
the number of times they were found to be a victim during the reporting year.
Sources: Authors’ adaptation of the Children’s Bureau’s (U.S. Department of Health and Human Servic-
es) annual
Child Maltreatment Reports
for 2009, 2010, 2012, and 2015–2019.

Youth and the Juvenile Justice: 2022 National Report
24
the screening workers nearly 6 to 1.
Even in locations with specialized per-
sonnel, CPS staff typically perform nu-
merous other activities, and some CPS
workers may be responsible for more
than one function.
Neglect was the most common
type of maltreatment for victims
in 2019
Many children were the victims of
more than one type of maltreatment,
but if categories of maltreatment are
considered independently, 61% of vic-
tims experienced neglect, 10% were
physically abused, 7% were sexually
abused, 2% psychologically or emotion-
ally maltreated, and 4% experienced
other forms of maltreatment, such as
threats of harm, abandonment, and
congenital drug addiction. Child vic-
tims of multiple forms of maltreatment
accounted for about 16% of victims in
2019. Thirty states and the District of
Columbia reported that more than
50% of victims experienced neglect in
2019.
1.8 to 5.4 (13 states)
5.5 to 8.9 (13 states)
9.0 to 15.6 (14 states)
15.7 and above (11 states)
Maltreatment victims per
1,000 children ages 0–17, 2019
DC
Child victimization rates varied considerably by state in 2019
Q State-level child maltreatment victimization rates ranged from a low of 1.8 per 1,000
children ages 0–17 in Pennsylvania to a high of 20.1 in Kentucky.
Q 26 states had child maltreatment victimization rates below the national average (8.9).
Note: a child was counted once regardless of the number of times they received a CPS response or
the number of times they were found to be a victim during the reporting year.
Source: Authors’ adaptation of the Children’s Bureau’s (U.S. Department of Health and Human Servic-
es) annual
Child Maltreatment Reports
for 2019.
There are several different types of child maltreatment
Child maltreatment occurs when a
caretaker (a parent or parental substi-
tute, such as a babysitter) is respon-
sible for, or permits, the abuse or ne-
glect of a child. The maltreatment can
result in actual physical or emotional
harm, or it can place the child in dan-
ger of physical or emotional harm. A
child may be a victim of multiple
types of maltreatment. The following
types of maltreatment are collected
as part of NCANDS.
Medical neglect: caused by failure of
the caregiver to provide for the ap-
propriate health care of the child al-
though financially able to do so, or
offered financial or other resources to
do so.
Neglect or deprivation of necessities:
failure by the caregiver to provide
needed, age-appropriate care al-
though financially able to do so or of-
fered financial or other means to do
so. This includes not meeting a child’s
educational needs.
Physical abuse: includes physical acts
that caused or could have caused
physical injury to the child, including
excessive corporal punishment.
Psychological or emotional maltreat-
ment: acts or omissions, other than
physical abuse or sexual abuse, that
caused or could have caused con-
duct, cognitive, affective, or other be-
havioral or mental disorders. Frequent-
ly occurs as verbal abuse or excessive
demands on a child’s performance.
Sexual abuse: the involvement of the
child in sexual activity to provide sexu-
al gratification or financial benefit to
the perpetrator, including contacts for
sexual purposes, molestation, statuto-
ry rape, prostitution, pornography, ex-
posure, incest, or other sexually ex-
ploitative activities.
Sex trafficking: refers to the recruit-
ment, harboring, transportation, provi-
sion, or obtaining of a person for the
purpose of a commercial sex act.
States have the option to report to
NCANDS any sex trafficking victim
who is younger than 24 years. Prior to
2018, sex trafficking was reported as a
form of sexual abuse.
Source: Authors’ adaptation of the Children’s Bureau’s (U.S. Department of Health and Human Services) annual
Child Maltreatment Reports
for 2019.

Chapter 2: Youth victims
25
Maltreatment victimization rates were highest for girls,
children under age 1, and American Indian children
Girls are more likely to experience
maltreatment than boys
More than half (51%) of victims of
child maltreatment in 2019 were fe-
male. The victimization rate for girls
was 9.4 per 1,000 girls younger than
age 18, and the rate for boys was 8.4
per 1,000 boys younger than age 18.
White children accounted for the
largest share of maltreatment
victims
In 2019, most victims of maltreatment
were White (44%) children, followed
by Hispanic (23%) and Black (21%).
Children of multiple races (5%), Asian/
Pacific Islander (1.2%) and American
Indian/Alaska Native (1%) children ac-
counted for a substantially smaller pro-
portion of victims.
American Indian/Alaskan Native chil-
dren had the highest child maltreat-
ment victimization rate in 2019, 14.8
per 1,000 children, followed closely by
Black children (13.8). The rate for
American Indian/Alaskan Native chil-
dren was nearly twice the rate for His-
panic (8.1) and White children (7.8).
<11234567891011121314151617
0%
2%
4%
6%
8%
10%
12%
14%
16%
Victim age
Percent of maltreatment victims, 2019
More than one-third of child victims of maltreatment in 2019 were
younger than age 4
Q In 2019, infants younger than 1 accounted for 15% of victims of maltreatment,
1-year-olds accounted for 7%, and youth ages 2–6 each accounted for 6%—about
the proportion expected if victimizations were spread evenly over all ages. Youth
ages 16 and 17 accounted for relatively small proportions (3% and 2%, respectively).
Q Victimization rates for infants younger than age 1 (25.7 per 1,000 children) were
twice the rates for youth ages 1–6, triple the rates for youth ages 7–14, and 4 to 6
times the rates for youth ages 15–17.
Note: a child was counted once regardless of the number of times they received a CPS response or
the number of times they were found to be a victim during the reporting year.
Source: Authors’ adaptation of the Children’s Bureau’s (U.S. Department of Health and Human Servic-
es) annual
Child Maltreatment Reports
for 2019.
What is known about child victims of sex trafficking?
The Justice for Victims of Trafficking
Act of 2015 amended the Child
Abuse Prevention and Treatment Act
(CAPTA) to require states update their
current definitions of child abuse and
neglect to include victims of sex traf-
ficking to continue receiving CAPTA
funding. Specifically, the Act requires
that states make a finding of “child
abuse and neglect” and “sexual
abuse” if the child is also found to be
a victim of sex trafficking. Sex traf-
ficking is a type of maltreatment that
refers to the recruitment, harboring,
transportation, provision, or obtaining
of a person for the purpose of a com-
mercial sex act.
States have the option to report to
NCANDS any sex trafficking victim
who is younger than age 24. At the
end of the 2019 federal fiscal year, 877
unique victims were reported to
NCANDS by 29 states. Based on
these reports:
Q Nearly 9 in 10 (88%) victims were
female, and 76% of victims were
ages 14–17.
Q Half of all victims of sex trafficking
were not victims of other forms of
maltreatment. Among those that
did experience other forms, the
two most common types were
sexual abuse and neglect.
Q For most victims (51%), the rela-
tionship to the perpetrator was un-
known, in 41% it was a nonparent,
and in 14% a parent.
Asian
White
Hispanic
Pacific Islander
Multiple races
Black
American Indian
0 5 10 15 20
Unique child maltreatment victims
per 1,000 in race/ethnicity group
1.7
7.8
8.1
10.7
11.0
13.8
14.8
Victim race/ethnicity

Youth and the Juvenile Justice System: 2022 National Report
26
The overwhelming majority of child maltreatment
perpetrators are parents of the victims
There were more than 525,300
known perpetrators in 2019
Child maltreatment is by definition an
act or omission by a parent or other
caregiver that results in harm or serious
risk of harm to a child. Incidents where
children are harmed by individuals who
are not their parents or caregivers gen-
erally do not come to the attention of
child protective services agencies, but
rather would be handled by law en-
forcement.
In 2019, the National Child Abuse and
Neglect Data System (NCANDS) iden-
tified 525,319 unique perpetrators of
child maltreatment. A perpetrator was
counted once, regardless of the num-
ber of children the perpetrator was as-
sociated with maltreating or the num-
ber of records associated with a
perpetrator.
Women are overrepresented
among maltreatment perpetrators
Compared with their share of the pop-
ulation (51%), women are overrepre-
sented among child caregivers. Within
families, mothers usually are the prima-
ry caregivers, and women far outnum-
ber men in caregiver occupations.
Women account for more than 95% of
childcare providers and 99% of pre-
school and kindergarten teachers. They
also make up 85% of healthcare sup-
port occupations. In 2019, females
made up more than half of maltreat-
ment perpetrators (53%).
More than two-thirds (69%) of perpe-
trators in 2019 were adults ages 25–
44, while 17% were under age 25.
Profile of maltreatment perpetrators, 2019:
Perpetrator age
Percent of
perpetrators
Total 100%
Younger than 18 2
Ages 18–24 15
Ages 25–34 42
Ages 35–44 27
Ages 45–54 9
Age 55 and older 4
Unknown age 2
Note: Detail may not sum to 100% because of
rounding.
Nearly half of perpetrators were White
(49%), about one-fifth were Black
(21%), and one-fifth were Hispanic.
This distribution is similar to the race
profile of victims of child maltreat-
ment.
Profile of maltreatment perpetrators, 2019:
Perpetrator
race/ethnicity
Percent of
perpetrators
Total 100%
White 49
Black 21
Hispanic 20
American Indian/
Alaskan Native 1
Asian/Pacific Islander 1
Multiple race 2
Unknown/missing 6
Note: Detail may not sum to 100% because of
rounding.
Parents are the most common
perpetrators of abuse and neglect
The overwhelming majority (78%) of
perpetrators in 2019 were a parent to
the victim; relatives (7%) accounted for
the most common nonparent perpetra-
tor relationship, followed by other
nonparental relationships (e.g., friends,
neighbors, and legal guardians).
Profile of maltreatment perpetrators, 2019:
Perpetrator relationship
to victim
Percent of
perpetrators
Total 100%
Parent 78
Other relative 6
Unmarried partner of parent 3
Other nonparent* 5
Professional** 1
Multiple relationships*** 4
Unknown/missing 2
*Other nonparent includes friends, neighbors,
legal guardians, and nonrelative foster parents.
**Professional incudes adults who care for
children as part of their employment duties,
such as child daycare providers, foster par-
ents, group home staff, and other profession-
als.
***Multiple relationships include perpetrators
with different relationships to child victims,
e.g., a perpetrator may be the parent of one
victim in a report but have a different relation-
ship to another child victim in the same report.
Note: Detail may not sum to 100% because of
rounding.

Chapter 2: Youth victims
27
Reported child maltreatment fatalities typically involve
infants and toddlers and result from neglect
Child fatalities have increased
since 2015
In 2019, an estimated 1,840 children
died as a result of some form of mal-
treatment, 11% more than the 1,660
child fatality victims reported in 2015.
The number of fatality victims in 2019
corresponds to a rate of 2.5 fatalities
for every 100,000 children under the
age of 18, compared with a rate of 2.2
in 2015.
Child fatalities, 2019:
Year
Estimated
number
Rate (per
100,000)
2019 1,840 2.5
2018 1,780 2.4
2017 1,710 2.3
2016 1,730 2.3
2015 1,660 2.2
Children younger than age 4
accounted for more than three-
quarters of maltreatment fatalities
Although children younger than 1 year
old were just 15% of all maltreatment
victims in 2019, they accounted for
46% of maltreatment fatalities. Similar-
ly, children ages 1–3 were 19% of all
victims but 31% of maltreatment fatali-
ties.
Profile of maltreatment victims, 2019:
Victim age
Percent of
total fatalities
Percent of
all victims
Total 100% 100%
Younger than 1 46 15
Age 1 14 7
Age 2 11 6
Age 3 6 6
Ages 4–7 11 23
Ages 8–11 6 20
Ages 12–15 5 17
Ages 16–17 2 6
Note: Detail may not sum to 100% because of
rounding.
Several factors make infants and tod-
dlers younger than age 4 particularly
vulnerable, including their dependency,
small size, and inability to defend
themselves.
Boys had the highest
maltreatment fatality rate in 2019
Boys had a maltreatment fatality rate of
2.98 deaths per 100,000 boys of the
same age in the population. For girls,
the rate was 2.20 per 100,000. Al-
though most victims of maltreatment
fatalities were White (44%), Black chil-
dren had the highest fatality rates, 5.08
per 100,000 black children. Asian chil-
dren had the lowest fatality rate in
2019 (0.70 per 100,000 children).
The fatality rate for Black children was
more than twice the rate for White
(2.18), American Indian/Alaskan Na-
tive (2.08), and Hispanic (1.89) chil-
dren.
Mothers were the most common
perpetrators in child maltreatment
fatalities
Among child fatalities in 2019, nearly
3 in 4 (73%) suffered from neglect and
more than 4 in 10 (44%) experienced
physical abuse, either exclusively or in
combination with another maltreat-
ment type.
The overwhelming majority (80%) of
child fatalities in 2019 involved parents
acting alone, together, or with others.
Mothers (acting alone or with others)
were involved in 39% of fatalities, while
fathers (acting alone or with others)
were involved in 16%.
Profile of fatality perpetrators, 2019:
Perpetrator relationship
to victim
Percent of
perpetrators
Total 100%
Mother only 29
Two parents of known sex 23
Father only 14
Mother and nonparent(s) 10
Father and nonparent(s) 2
2 parents of known sex
and nonparent 2
Nonparent 17
Unknown 4
Note: Detail may not sum to 100% because of
rounding.
Most maltreatment fatality victims
were previously unknown to the
CPS agency
Most child maltreatment fatalities in-
volved families without a recent history
with CPS. About one-third (34%) of
maltreatment fatalities had at least one
previous contact with CPS in the 5
years prior to their death; 7% of child
fatality victims were previously substan-
tiated as a victim of maltreatment,
21% had a prior contact that was not
substantiated, and 6% had prior con-
tacts that received both substantiated
and unsubstantiated dispositions.

Youth and the Juvenile Justice System: 2022 National Report
28
The number of children in foster care has increased 8%
since 2012
AFCARS data track trends in
foster care and adoption
Foster care is defined in federal regula-
tions as 24-hour substitute care for
children outside their own homes. Fos-
ter care settings include, but are not
limited to, family foster homes, relative
foster homes (whether payments are
being made or not), group homes,
emergency shelters, residential facilities,
childcare institutions, and preadoptive
homes.
Under federal regulation, states and
tribal Title IV-E agencies are required
to submit data semi-annually to the
Adoption and Foster Care Analysis and
Reporting System (AFCARS), which
collects case-level information on all
children in foster care for whom state
child welfare agencies have responsibil-
ity. AFCARS also collects data on chil-
dren who are adopted under the aus-
pices of state public child welfare
agencies, as well as information on fos-
ter and adoptive parents. Data are re-
ported for the federal fiscal year, which
runs from October 1st through Sep-
tember 30th.
Nearly half of all children entering
foster care were younger than 6
Children younger than 1 were the sin-
gle age that accounted for the greatest
share of children entering foster care—
19% in 2019. Children between the
ages of 1 and 5 were 30% of foster care
entries in 2019, making them the larg-
est age group of children entering fos-
ter care (of 5-year age groupings for
children ages 1–20). Prior to 2005, the
11–15 age group made up the greatest
share of youth entering foster care.
The median age of children who en-
tered foster care in 2019 was 6.3 years
and the average age was 7.2 years.
Logically, the average age of the stand-
ing foster care population is greater
than the average age of children enter-
ing foster care. The median age of chil-
dren in foster care in 2019 was 7.7
years and the average age was 8.4
years.
99 11 13 15 17 19
0
50,000
100,000
150,000
200,000
250,000
300,000
350,000
Year
Number of children during 12-month period
Entering foster care
Exiting foster care
01 03 05 07 09
The number of children in foster care has grown in recent years
Q An estimated 424,000 children remained in foster care on September 30, 2019,
25% fewer than the 1999 peak of 567,000 but 8% more than the 2012 low point
(392,000).
Sources: Authors’ adaptation of the Children’s Bureau’s (U.S. Department of Health and Human Servic-
es)
AFCARS Report Final Estimates for FY1998 through FY2002
;
Trends in Foster Care and Adoption:
FY2002–FY2012
;
and
Trends in Foster Care and Adoption: FY2010–FY2019
.
99 11 13 15 17 19
0
100,000
200,000
300,000
400,000
500,000
600,000
Year
Number on September 30th
Children in foster care
01 03 05 07 09
Since 2015, foster care entries declined while exits increased
Q The number of children entering foster care fell 7% between 2015 and 2019, while
the number of children exiting foster care increased 3% during the same period.
Q In 2019, the number of children who exited foster care (249,000) was about the
same as the number of children who entered foster care (251,000).
Q The number of children entering foster care decreased 18% since its peak of
305,000 in 2005 and the number of children exiting declined 16% from its 2007
peak (295,000).
Sources: Authors’ adaptation of the Children’s Bureau’s (U.S. Department of Health and Human Servic-
es)
AFCARS Report Final Estimates for FY1998 through FY2002
;
Trends in Foster Care and Adoption:
FY2002–FY2012
;
and
Trends in Foster Care and Adoption: FY2010–FY2019
.

Chapter 2: Youth victims
29
Profile of children entering foster care:
Age 2000 2010 2019
Total 100% 100% 100%
Younger than 1 13 16 19
1 to 5 24 31 30
6 to 10 20 18 21
11 to 15 30 23 21
16 to 20 11 12 9
Note: Detail may not total 100% because of
rounding.
Black, Hispanic and mixed race
children were overrepresented in
foster care
In 2019, Hispanic (25%), Black (14%),
and mixed race (4%) children com-
bined to account for 43% of the U.S.
population ages 0–20. In comparison,
52% of children in foster care in 2019
were Black (23%), Hispanic (21%), or
mixed race (8%). The proportion of
the foster care population involving
White and mixed race children has
grown since 2010, while the propor-
tion involving Black children has de-
clined.
Profile of children, 2019:
Race/ethnicity
In foster
care
U.S.
population
All races 100% 100%
White 44 51
Black 23 14
Hispanic 21 25
American Indian 2 1
Asian/Pacific Islander 1 5
Mixed race 8 4
Note: Detail may not total 100% because of
rounding.
Half of children in foster care on
September 30, 2019, entered one
year prior
On September 30, 2019, half of chil-
dren in foster care had been in care for
at least 13 months. This is down from
the median time in both 2005 (15.5
months) and 2000 (19.8 months).
Profile of children in foster care:
Length of stay in
foster care 2000 2010 2019
Total 100% 100% 100%
Less than 1 month 4 5 5
1–5 months 16 21 21
6–11 months 15 19 20
12–17 months 12 13 16
18–23 months 9911
24–35 months 13 12 13
3–4 years 15 11 9
5 years or more 17 11 5
Note: Detail may not total 100% because of
rounding.
Reunification was the permanency
goal for most foster care children
In 2019, more than half of children in
foster care (55%) had a permanency
goal of reunification with their parents
and more than one-fourth (28%) had a
The number of Black children in foster care was cut in half between
2000 and 2019
Q On September 30, 2019, 97,142 Black children were in foster care, 55% fewer than
the number in foster care in 2000.
Q While the total number of youth in foster care fell 25% from 2000 to 2019, Black
children accounted for more than 80% of this decrease.
Sources: Authors’ adaptation of the Children’s Bureau’s (U.S. Department of Health and Human Servic-
es)
The AFCARS Report: Final Estimates for FY1998 through FY2002
;
and
The AFCARS Report: Pre-
liminary Estimates,
for fiscal years 2003–2019.
0
50,000
100,000
150,000
200,000
250,000
Year
Children in foster care
Black
Hispanic
White
01 03 05 07 09 11 13 15 17 19
goal of adoption. The proportion of
children without a permanency goal
changed considerably from 2000 to
2019. In 2000, 17% of children in fos-
ter care did not yet have permanency
goals; by 2019, 4% of children in foster
care did not have permanency goals.
Profile of children in foster care:
Permanency goal 2000 2010 2019
Total 100% 100% 100%
Reunification with
parents 41 51 55
Adoption 21 25 28
Emancipation 664
Guardianship 344
Live with other
relative(s) 443
Long-term foster care 862
Goal not yet
established
1754
Note: Detail may not total 100% because of
rounding.

Youth and the Juvenile Justice System: 2022 National Report
30
The most common outcome for children exiting foster care
was reunification with their parents
Although the most common
outcome, the proportion of foster
care exits resulting in reunification
has decreased since 1999
More than half of children who exit
foster care are reunified with their par-
ents or primary caretakers; however,
the frequency of this outcome has de-
creased in the past decade. In 2010, an
estimated 51% of children exiting fos-
ter care were reunified with their par-
ents or primary caretakers; by 2019,
this figure dropped to 47%. The sec-
ond most common outcome for youth
exiting foster care in 2019 was adop-
tion (26%). Other outcomes for chil-
dren include living with other relatives,
emancipation, guardianship, transfer to
another agency, and running away,
which, combined, accounted for less
than a third of exits.
Most children adopted from foster
care were adopted by their foster
parents
Most children adopted from foster care
(52%) in 2019 were adopted by foster
parents. About one-third (36%) were
adopted by relatives, and the remain-
ing 11% were adopted by nonrelatives.
The proportion of children adopted by
relatives in 2019 (36%) was greater
than in 2010 (32%) and 2000 (21%).
The family structure of adoptive fami-
lies has remained almost unchanged
since AFCARS data collection began in
1998. Married couples adopt the ma-
jority of children adopted from foster
care (68%), followed by single females
(26%). The remaining 6% of children
were adopted by unmarried couples
and single males.
Children younger than 6
accounted for more than half
of adopted children
The gender profile of adopted children
has changed little since 2000, but the
race/ethnicity profile of adopted chil-
dren has shifted. In 2000, White chil-
dren accounted for 38% of adopted
children; by 2019, White children ac-
counted for half adopted children. The
age profile of adopted children has also
changed. In 2000, children under age
6 accounted for 47% of adopted chil-
dren; by 2019, 56% of adopted chil-
dren were under age 6. The median
age of children adopted out of foster
care has decreased over the past de-
cades, from 6.4 in 2010 to 5.2 in
2019.
Profile of adopted children:
Demographic 2000 2010 2019
Gender 100% 100% 100%
Male 50 51 51
Female 50 49 49
Race 100% 100% 100%
White 38 43 50
Black 38 24 18
Hispanic 15 21 20
Age 100% 100% 100%
Less than 1 222
1 to 5 45 54 54
6 to 10 36 27 27
11 to 15 16 14 14
16 to 20 233
Note: Detail may not total 100% because of
rounding and because of racial categories that
are not displayed.
In 2019, 64,415 children were adopted from foster care—55% more than
were adopted from foster care in 1999
99 01 03 05 07 09 11 13 15 17 19
0
10,000
20,000
30,000
40,000
50,000
60,000
70,000
Year
Number of children
Adoptions
99 01 03 05 07 09 11 13 15 17 19
0%
5%
10%
15%
20%
25%
30%
Year
Percent of total exits from foster care
Adoptions
Q The proportion of children exiting foster care to adoption has steadily increased,
from less than one in five (17%) in 1999 to more than one in four (26%) in 2019.
Q Adoption requires the termination of parental rights. Of the more than 122,200 chil-
dren waiting to be adopted as of September 30, 2019, 58% had their parental
rights terminated
Sources: Authors’ adaptation of the Children’s Bureau’s (U.S. Department of Health and Human Servic-
es)
AFCARS Report Final Estimates for FY1998 through FY2002
;
and
The AFCARS Report: Preliminary
Estimates,
for fiscal years 2003–2019.
Reunification was the most
common outcome for children
exiting foster care
Of the children exiting foster care in
2019, 117,010 were reunited with
their parents and 64,415 were adopt-
ed. Compared with prior years, a
smaller proportion of children were re-
united with their parents upon exit
from foster care and a greater share
were adopted.
Profile of children exiting foster care:
Outcome 2000 2010 2019
Total 100% 100% 100%
Reunification with
parents 57 51 47
Adoption 17 21 26
Guardianship 3611
Emancipation 711 8
Live with other
relative(s) 1086
Transfer to other
agency 321
Runaway 210
Note: Detail may not total 100% because of
rounding.

Chapter 2: Youth victims
31
The serious violent victimization rate of youth ages 12–17 in
2019 was 83% less than the rate in 1994
NCVS tracks crime levels
Since 1973, the Bureau of Justice Sta-
tistics (BJS) has used the National
Crime Victimization Survey (NCVS)
to monitor the level of violent crime in
the U.S. NCVS gathers information on
crimes against persons ages 12 and
older from a nationally representative
sample of households. NCVS monitors
nonfatal serious violence (i.e., rape/
sexual assault, robbery, and aggravated
assault) and simple assault victimiza-
tion. These data serve a critical role for
understanding the volume and nature
of crimes against youth ages 12–17 as
well as trends in these crimes. A limita-
tion, however, is that crimes against
youth younger than age 12 are not
captured.
Analysis of these data show that youth
experienced relatively high levels of vi-
olent crimes during the mid-1990s but
their rate of victimization has since de-
clined: between 1994 and 2019, rates
of serious violence and simple assault
against youth declined more than 80%.
Male and female youth were
equally likely to be victims of
serious violence in 2019
In 1994, male youth were nearly twice
as likely to be victims of serious vio-
lence as were females (78.8 per 1,000
vs. 43.5 per 1,000, respectively). How-
ever, following the relatively larger de-
cline in the serious violence victimiza-
tion rate among male youth (down
86%, compared with 77% for females),
victimization rates for male and female
youth were about the same in 2019
(11.0 vs. 10.0, respectively). In con-
trast, 2019 victimization rates for sim-
ple assault showed greater gender dis-
parity, as male youth were 50% more
likely to be victimized than females
(29.0 vs. 18.7).
Victimization rates for serious violence and simple assault were lower in
2019 than in 1994 for all youth
Q Most of the decline in both serious violence and simple assault victimization took
place between 1994 and 2005. During this period, the rate of serious violence
against youth ages 12–17 fell 77% and simple assault fell 68%, compared with
25% and 39%, respectively, between 2005 and 2019.
Q The relative decline in simple assault victimization rates between 1994 and 2010
was about the same for male (80%) and female (81%) youth, while the decline in
the serious violence rate for males (86%) outpaced that of females (77%).
Q For most years, Black youth were at greater risk of serious violence than White or
Hispanic youth. However, in 2019, rates of serious violence were about the same
for each group. Conversely, White youth were at greater risk of simple assault vic-
timization than Black or Hispanic youth most years during the 1994-2019 period. In
2019, White youth were 60% more likely to experience simple assault than Black
youth, and more than twice as likely as Hispanic youth.
Notes: Serious violence includes rape/sexual assault, robbery, and aggravated assault. To improve sta-
bility and reliability, rates are based on two-year rolling averages. Due to methodological changes, vic-
timization estimates for 2006 and 2016 are not comparable to other years.
Source: Authors’ analyses of the Bureau of Justice Statistics’
National Crime Victimization Survey
Dashboard
for 1994 through 2019.
95 99 11 15 19
0
20
40
60
80
Year
Victimizations per 1,000 youth ages 12−17
Hispanic
White
Black
Serious violence
03 07
95 99 11 15 19
0
40
80
120
160
Year
Victimizations per 1,000 youth ages 12−17
White
Hispanic
Black
Simple assault
03 07
95 99 11 15 19
0
20
40
60
80
Year
Victimizations per 1,000 youth ages 12−17
Female
Male
Serious violence
03 07
95 99 11 15 19
0
40
80
120
160
Year
Victimizations per 1,000 youth ages 12−17
Female
Male
Simple assault
03 07
95 99 11 15 19
0
10
20
30
40
50
60
70
Year
Victimizations per 1,000 youth in age group
Ages 12−14
Ages 15−17
Serious violence
03 07
95 99 11 15 19
0
40
80
120
160
Year
Victimizations per 1,000 youth in age group
Ages 12−14
Ages 15−17
Simple assault
03 07

Youth and the Juvenile Justice: 2022 National Report
32
With few exceptions, annual rates of serious violent victimization were
greater for young adults than for youth ages 12–17
95 99 11 15 19
0
20
40
60
80
Year
Victimizations per 1,000 in age group
Ages 12−17
Ages 18−20
03 07
Ages 21–24
Serious violence
95 99 11 15 19
0
20
40
60
80
100
120
140
Year
Victimizations per 1,000 in age group
Ages 12−17
Ages 18−20
03 07
Simple assault
Ages
21–24
Rates of serious violence declined
for White, Black, and Hispanic
youth
The rate of serious violent victimiza-
tion declined for all race/ethnicity
groups between 1994 and 2019, but
the decline was greater for Black non-
Hispanic youth (87%) and Hispanic
youth (86%) than for White non-His-
panic youth (82%). The net result of
these declines was that, by 2019, rates
of serious violence against Black
(10.3), White (10.4) and Hispanic
(10.9) youth were about the same.
Simple assault victimization rates also
declined considerably for each group
between 1994 and 2019, but the de-
cline was greater for Hispanic youth
(85%) than for White youth (80%) and
Black youth (78%). Despite these de-
clines, however, White youth (29.5)
were more likely to experience simple
assault in 2019 than were Black youth
(18.1) or Hispanic youth (13.1).
Most youth were victimized by
someone they know
In 1994, youth ages 12–17 experi-
enced comparable rates of serious vio-
lence committed by nonstrangers (e.g.,
family member, relatives, acquaintanc-
es, and other persons known to the
victim) and strangers (32.0 vs. 28.1 per
1,000, respectively). Between 1994
and 2019, the rate of serious violent
crimes committed by strangers declined
91%, while the rate for nonstrangers
fell 77%. As a result, by 2019, the rate
of serious violence committed by non-
strangers was nearly 3 times the rate
committed by strangers (7.3 vs. 2.5).
The rate of simple assault committed
by nonstrangers was, on average, more
than twice the rate committed by
strangers between 1994 and 2019. The
rates of simple assault committed by
nonstrangers and strangers declined
similarly between 1994 and 2019, 84%
and 83%, respectively. In 2019, the rate
of simple assault committed by non-
strangers (13.8) was 2.4 times the rate
committed by strangers (5.8).
Weapon use in nonfatal serious
violence against youth has
declined
Between 1994 and 2019, rates of seri-
ous violence against youth that in-
volved a weapon (e.g., firearm, knife,
or club) decreased by 91% (from 40.5
per 1,000 to 3.6). By 2019, nearly
two-thirds (65%) of serious violence
victimizations reported by youth did
not involve a weapon, compared with
one-third in 1994, and less than 1 in
10 (9%) involved a firearm.
The rate of injury among youth victims
of serious violence declined 77% be-
tween 1994 and 2019. As a result, the
2019 injury rate for youth victims of
serious violence was one-fourth the
rate in 1994. Of those who were in-
jured as the result of serious violence,
most youth did not report receiving
treatment. On average between 1994
and 2019, 45% of injured youth re-
ported not receiving treatment, but
the proportion varied by year, ranging
from a low of 29% to a high of 68%.
Declines in serious violence were
similar for youth and young adults
From 1994 to 2019, rates of serious
violence against youth ages 12–17 de-
clined considerably, a pattern that was
replicated among young adults ages
18–20 and adults ages 21–24. Most of
the decline took place between 1994
and 2010; during which time the rate
of serious violence fell 78% for youth,
77% for young adults, and 64% for
adults. Similarly, rates of simple assault
victimization declined 83% for youth,
compared with 78% for young adults
and 79% for adults.
Q Each year since 1994, young adults ages 18–20 were at greater risk of serious vio-
lent victimization than youth ages 12–17, while adults ages 21–24 were at greater
risk than youth for most years since 2001. In 2019, young adults were 67% more
likely to experience serious violence than youth, and adults were 39% more likely
than youth.
Q In contrast to the pattern for serious violence, the risk of simple assault victimization
was greater for youth ages 12–17 than for young adults for most years between
1994 and 2019.
Notes: Serious violence includes rape/sexual assault, robbery, and aggravated assault. To improve sta-
bility and reliability, rates are based on two-year rolling averages. Due to methodological changes, vic-
timization estimates for 2006 and 2016 are not comparable to other years.
Source: Authors’ analyses of the Bureau of Justice Statistics’
National Crime Victimization Survey
Dashboard
for 1994 through 2019.

Chapter 2: Youth victims
33
Students were less likely to experience nonfatal victimization
in and on their way to and from school in 2019 than in 1992
Nonfatal victimizations of youth
ages 12–18 fell substantially
between 1992 and 2019 both in
and out of school
For more than 2 decades, the National
Center for Education Statistics and the
Bureau of Justice Statistics have jointly
produced the
Indicators of School
Crime and Safety
report which, among
other things, monitors the amount of
crime students ages 12–18 experience
when they are in (or on their way to/
from) school and when they are away
from school. Findings indicate that the
rates of violent crime and theft—in
school and away from school—each
declined substantially between 1992
and 2019.
In 2019, more nonfatal victimizations
(theft and violent crime) were commit-
ted against students ages 12–18 at
school than away from school. Stu-
dents at school experienced an estimat-
ed 764,600 nonfatal victimizations,
compared with 509,300 away from
school, representing overall victimiza-
tion rates of 30 per 1,000 students at
school and 20 per 1,000 students away
from school.
From 1992 to 2019, the rate of violent
crimes against students ages 12–18 oc-
curring away from school fell 86%
(from 94 victimizations per 1,000 to
14), while the rate at school fell 70%
(from 68 to 21). In 2019, youth expe-
rienced more thefts at school than
away from school, but the relative de-
cline in the rate of theft was the same
for students at school and away from
school (down 92% for both). Annually
since 1992, the rate of theft at school
was higher than the rate of theft away
from school.
In 2019, students residing in urban
and rural areas had higher rates of theft
and violent victimization at school and
away from school than students resid-
ing in suburban areas.
Since 2012, students ages 12–18 were more likely to experience violent
crime at school than theft crime at school
Notes: Violence includes rape, sexual assault, robbery, aggravated assault, and simple assault. Due to
a sample increase and redesign in 2016, victimization estimates for 2016 are not comparable to esti-
mates for other years.
Source: Authors’ adaptation of the National Center for Education Statistics’
Digest of Education
, Table
228.20.
92 95 98 01 04 07 10 13 16 19
0
20
40
60
80
100
120
Year
Victimizations per 1,000 students ages 12−18
Violence at school Theft at school
Violence away
from school
Theft away
from school
In 2019, female students and students ages 15–18 were more likely
to experience violence away from school than at school
Student demographic
Victimizations per 1,000 students ages 12–18, 2019
Violence Theft
At school
Away from
school At school
Away from
school
Total 20.6 13.7 9.4 6.3
Male 28.9 8.1 10.9 7.6
Female 11.7 19.5 7.8 5.0
Ages 12–14 26.4 6.9 9.4 4.9
Ages 15–18 14.9 20.2 9.3 7.6
White 21.1 19.2 10.0 5.9
Black 18.8 8.0 8.0 5.9
Hispanic 22.7 5.4 10.1 5.6
Q In 2019, students experienced an estimated 864,100 violent victimizations—60% of
these occurred at school.
Note: Violence includes rape, sexual assault, robbery, aggravated assault, and simple assault.
Source: Authors’ adaptation of the National Center for Education Statistics’
Digest of Educa-
tion
, Table 228.25.

Youth and the Juvenile Justice System: 2022 National Report
34
In 2019, nearly 1 in 5 students reported having been bullied
at school and about 1 in 6 reported having been cyberbullied
Nationwide, 19.5% of high school
students said they were bullied at
school in 2019
According to the 2019 Youth Risk Be-
havior Surveillance Survey (YRBSS),
nearly 1 in 5 (19.5%) high school stu-
dents reported having been bullied at
school at least once during the 12
months prior to the survey. The
YRBSS defines bullying as “when one
or more students tease, threaten,
spread rumors about, hit, shove, or
hurt another student over and over
again.” Regardless of grade level, fe-
males were more likely than males to
be victims of bullying, and White, His-
panic, and multiple race females were
more likely to report bullying than
their male peers. Likewise, heterosexual
females were more likely than males to
report bullying. No other differences
were significant between males and fe-
males.
Percent of high school students who
reported being bullied on school property
in the past year, 2019:
Demographic Total Male Female
Total 19.5% 15.4% 23.6%
9th grade 22.4 18.0 27.0
10th grade 21.3 17.4 25.3
11th grade 16.9 12.4 21.2
12 grade 16.7 12.8 20.5
White 23.1 18.0 28.3
Black 15.1 13.3 17.2
Hispanic or Latino 14.8 10.9 18.6
Asian 12.0 11.3 12.7
Multiple race 21.3 15.0 26.4
Heterosexual 17.1 14.0 20.8
Gay, lesbian,or
bisexual
32.0 31.7 32.0
Not sure 26.9 23.7 28.0
The proportion of students who were
bullied at school in 2019 was about
the same as the proportion in 2009
(19.9%).
Classrooms, hallways and
stairwells are the most common
locations of bullying at school
The School Crime Supplement (SCS)
to the National Crime Victimization
Survey (NCVS) collects data from
students 12–18 years old, i.e., grades
6th through 12th, and their reports of
being bullied at school. “At school”
includes the school building, on school
property, the school bus, or going to
and from school. “Bullying” includes
being made fun of; being the subject
of rumors; being threatened with
harm; being pressured into doing
things they did not want to do; exclud-
ed from activities on purpose; having
property destroyed on purpose; and
being pushed, shoved, tripped, or spit
on along with injury as a result of the
incident.
According to the National Center for
Education Statistics’ analysis of the
In 2019, female high school students were more likely to report
being bullied at school or experience electronic bullying than their
male peers
Percent of students, 2019
Youth characteristic
Bullied on
school property
Electronically
bullied
All high school students 19.5% 15.7%
Gender
Male 15.4 10.9
Female 23.6 20.4
Race/ethnicity
White* 23.1 18.6
Black* 15.1 8.6
Hispanic or Latino 14.8 12.7
American Indian/Alaska Native* 32.1 21.3
Asian* 12.0 12.1
Native Hawaiian/Other Pacific Islander* NA NA
Multiple race* 21.3 19.2
Grade
9th 22.4 16.5
10th 21.3 16.0
11th 16.9 14.4
12th 16.7 15.4
Sexual identity
Heterosexual 17.1 14.1
Gay, lesbian, bisexual 32.0 26.6
Not sure 26.9 19.4
Q In 2019, White high school students were more likely than Black, Hispanic, and
Asian students to experience bullying at school and electronic bullying.
Q While electronic bullying was similar across grade levels, 9th and 10th graders
were more likely to experience bullying at school than 11th and 12th graders.
Q Students who identify as heterosexual were significantly less likely to experi-
ence either form of bullying than students who identify as gay, lesbian, or bi-
sexual, and those who are not sure of their sexual orientation.
NA: Too few cases to develop a reliable estimate.
*Excludes persons of Hispanic ethnicity. Hispanic youth can be any race.
Notes: The reference period was 12 months prior to the survey. Electronic bullying includes
being bullied through texting, Instagram, Facebook, or other social media.
Source: Author’s analysis of Centers for Disease Control and Prevention (CDC),
1991–2019
High School Youth Risk Behavior Survey Data
.

Chapter 2: Youth victims
35
SCS data, about 22% of students ages
12–18 reported being bullied at school
during the 2019 school year. Females
were more likely than males to be
made of or be the subject of rumors,
while males were more likely to report
being pushed, shoved, or spit on.
Percent of students ages 12–18 bullied at
school, 2019:
Bullying problem Total Male Female
Total 22.2% 19.1% 25.5%
Made fun of 13.8 11.8 15.9
Subject of rumors 15.3 11.9 18.9
Excluded from
activities 6.0 3.7 8.5
Threatened 4.5 4.7 4.3
Pressured to do
things 2.4 2.5 2.2
Property destroyed
1.7 1.8 1.6
Pushed/shoved/
spit on 5.2 6.2 4.1
Students who were bullied during the
2018-2019 school year also reported
the location in which they had been
victimized. Classrooms, hallways/stair-
wells, and the cafeteria were the three
most commonly reported locations.
Females were more likely than males to
reported being bullied in the hallway
or stairwell, while males were more
likely to experience bullying in a locker
room or bathroom than females.
Among students ages 12–18 who were
bullied, percent by location, 2019:
Location Total Male Female
Inside classroom 46.7 47.5 46.1
Hallway or
stairwell 38.9 33.6 43.1
Bathroom or
locker room 10.9 12.5 9.7
Cafeteria 25.7 25.9 25.6
Somewhere else
in school 3.0 2.4 3.4
Outside on
school grounds 20.2 21.3 19.2
On the way to or
from school 9.9 9.8 10.0
Online or by text 15.8 7.6 22.4
Students from suburban schools re-
ported higher rates of being bullied in
the hallway or stairwell (39%) than did
students from urban schools and rural
schools (37%, each). In contrast, a
higher percentage of students from
rural schools (30%) than students from
urban schools (22%) and suburban
schools (26%) reported being bullied
in the school cafeteria.
Nearly 1 in 5 students report being
bullied more than 10 days in the
school year
Data from SCS asks students to report
how often they experienced bullying
during the school year. Among stu-
dents who report being bullied, 52%
were bullied one or two days in the
school year, 29% were bullied 3–10
days in the school year, and 19% were
bullied more than 10 days. Females
(20%) were more likely than males
(17%) to report being bullied 10 or
more times a year, and White (20%)
and Hispanic (21%) students were
more likely to report being bullied 10
or more times than Black (13%) stu-
dents.
In 2019, 1 in 5 females were
cyberbully victims—1 in 9 males
were victims
In 2019, the YRBSS found that, na-
tionwide, 16% of students reported
being electronically bullied during the
past year through text messages and
social media platforms. Regardless of
grade level, females were significantly
more likely than males to be victims of
electronic bullying, and White, Black,
Hispanic, and multiple race females
were significantly more likely to report
electronic bullying than their male
peers.
Percent of high school students who
reported being electronically bullied in
the past year, 2019:
Demographic Total Male Female
Total 15.7% 10.9% 20.4%
9th grade 16.5 11.9 21.3
10th grade 16.0 11.0 21.1
11th grade 14.4 8.6 20.3
12th grade 15.4 11.9 18.6
White 18.6 12.0 25.3
Black 8.6 6.1 11.1
Hispanic or Latino 12.7 9.3 15.9
Asian 12.1 11.1 13.2
Multiple race 19.2 14.4 23.0
Heterosexual 14.1 9.9 19.1
Gay, lesbian,or
bisexual 26.6 25.5 27.1
Not sure 19.4 16.8 20.1
The proportion of students who expe-
rienced electronic bullying in 2019 was
about the same as the proportion in
2011 (16.2%).
Victims of cyberbullying are
likely to report:
Q Being bullied in person
Q Being afraid or embarrassed to
go to school
Q Skipping school
Q Academic failure
Q Low self-esteem
Q Health problems
Q Alcohol and drug use
Q Family problems
Q Delinquent behavior
Q Suicidal thoughts or actions
Source: Authors’ adaptation of U.S. De-
partment of Health and Human Services
online information, available at www.
Stopbullying.gov.
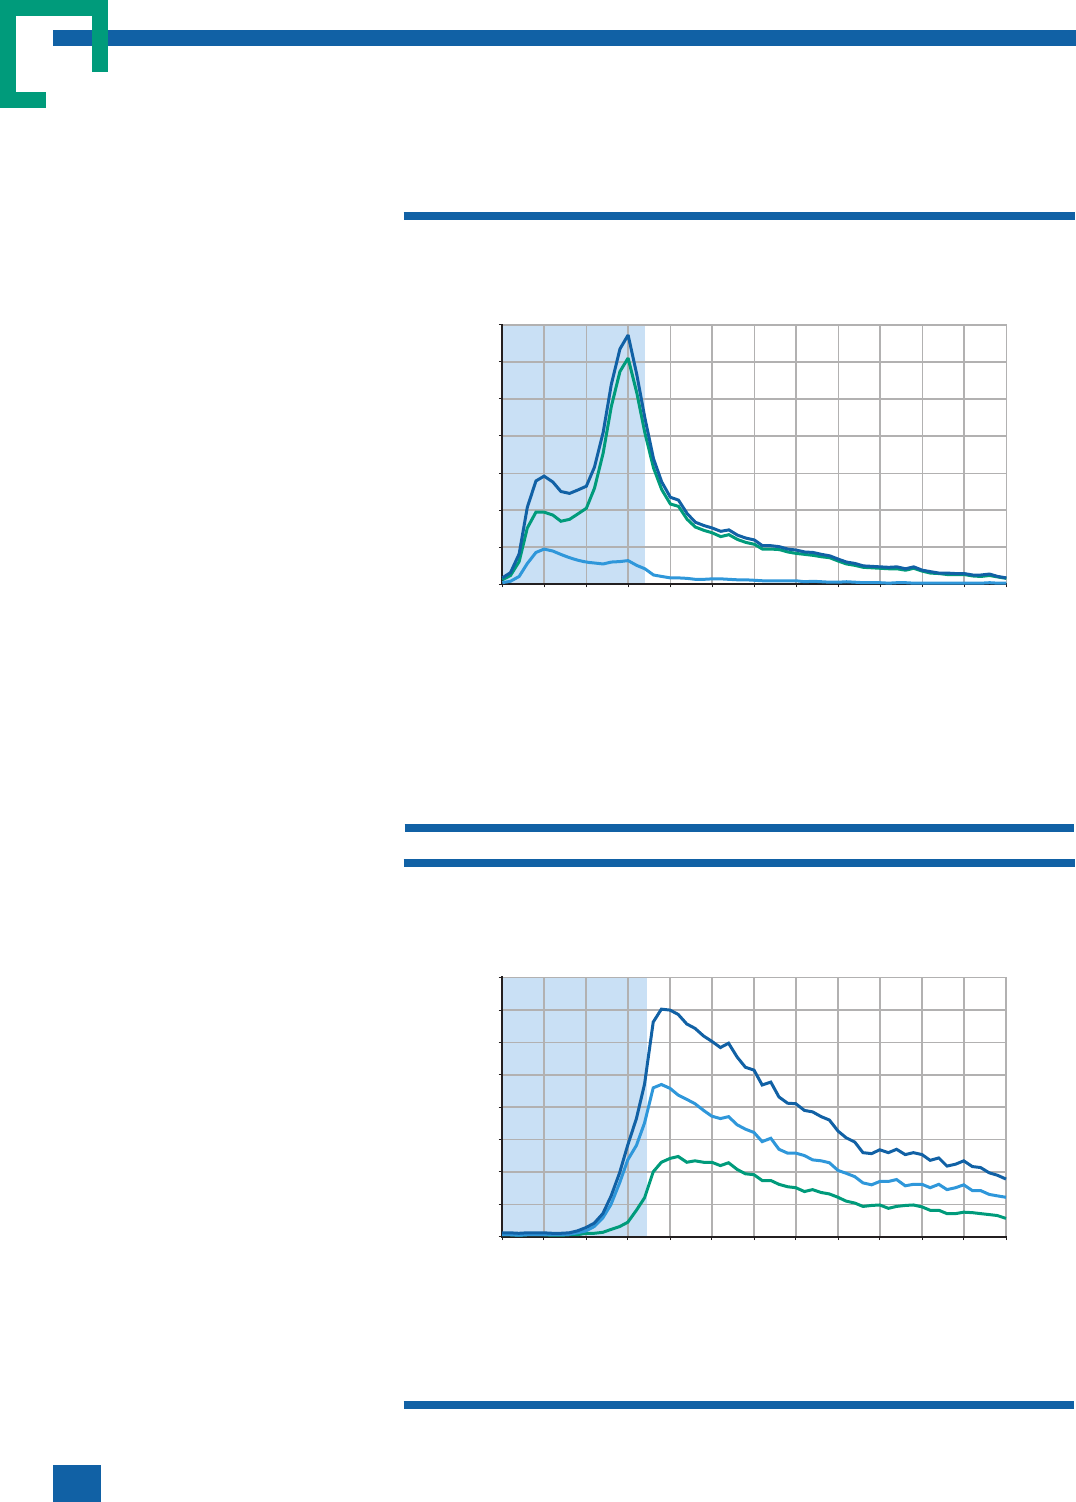
Youth and the Juvenile Justice System: 2022 National Report
36
Youth younger than 18 accounted for more than 1 in 5
victims of serious violent crime known to law enforcement
Child victims are common in
violent crimes handled by law
enforcement
Not all crimes committed are reported
to law enforcement. Those that are re-
ported can be used to produce a por-
trait of crime as seen by the nation’s
justice system. Based on the FBI’s
Supplementary Homicide Reports
, 8%
of all persons murdered in 2019 were
under age 18 and 27% of these child
victims were female. No other data
source with comparable population
coverage characterizes the victims of
other violent crimes reported to law
enforcement. However, data from the
National Incident-Based Reporting
System (NIBRS) covering incidents in
2018 and 2019 capture information
on more than 1 million victims of seri-
ous violent crime (i.e., murder, violent
sexual assault, robbery, and aggravated
assault) known to law enforcement
agencies in 45 states and the District
of Columbia, representing 45% of the
U.S. population. The number of re-
porting agencies and proportion of the
state reporting varies by state; howev-
er, from these data an arguably repre-
sentative description of violent crime
victims can be developed.
Sexual assault victims accounted
for more than half of all child
victims of serious violent crime
NIBRS data indicate that 22% of the
victims of serious violent crime report-
ed to law enforcement agencies in
2018 and 2019 were children under
age 18. More specifically, children
were the victims in 9% of murders,
58% of sexual assaults, 8% of robberies,
and 13% of aggravated assaults. Of all
child victims of serious violent crime,
less than one-half of 1% were murder
victims, 7% were robbery victims, 35%
were victims of aggravated assault, and
57% were victims of sexual assault.
Among youth victims of serious vio-
lence, nearly 3 in 4 females and more
0 5 10 15 20 25 30 35 40 45 50 55 60
0%
1%
2%
3%
4%
5%
6%
7%
Victim age
Percent of total sexual assault victimizations
Male
All victims
Female
Sexual assault
Robbery victimization increased through the childhood years to reach a
peak at age 19 for male victims and age 21 for female victims
Q Children under age 18 accounted for 10% of all male robbery victims and 6% of all
female robbery victims.
Source: Authors’ analyses of the FBI’s
National Incident-Based Reporting System Master Files
for 2018
and 2019.
0 5 10 15 20 25 30 35 40 45 50 55 60
0%
1%
2%
3%
4%
Victim age
Percent of total robbery victimizations
Male
All victims
Female
Robbery
In sexual assaults known to law enforcement, 55% of female and 74%
of male victims were younger than 18
Q The modal age for sexual assault victims was age 15 for female victims and age 5
for male victims.
Q Overall, female child victims of sexual assault outnumbered male victims by nearly
5 to 1. However, among older child victims, those age 12–17, female victims out-
numbered male victims by 9 to 1.
Source: Authors’ analyses of the FBI’s
National Incident-Based Reporting System Master Files
for 2018
and 2019.

Chapter 2: Youth victims
37
than 1 in 4 males were victims of sexu-
al assault
The majority (63%) of the youth vic-
tims of serious violent crimes known to
law enforcement in 2018 and 2019
were female. Victims under age 18 ac-
counted for 26% of all female victims
of serious violent crime but only 17%
of all male victims. The types of serious
violence committed against male and
female child victims differed. For fe-
male youth, 74% of the serious violent
crimes were sexual assaults, 23% were
aggravated assaults, 3% were robberies,
and less than 0.5% were murders. In
contrast, for male youth, 56% of seri-
ous violent crimes were aggravated as-
saults, 27% were sexual assaults, 16%
were robberies, and about 1% were
murders.
Among both male and female child
victims of sexual assault, forcible fon-
dling was the most common offense.
Offense profile of juvenile sexual assault
victims, 2018–2019:
Offense Male Female
Sex offense 100% 100%
Rape 6 35
Sodomy 30 7
Sexual assault with
an object
34
Fondling 61 54
More than 40% of child victims of
serious violence were younger
than age 12
NIBRS data for 2018 and 2019 show
that 17% of the child victims of serious
violent crime were younger than 6,
24% were ages 6–11, 25% were ages
12–14, and 35% were ages 15–17. Vic-
tims younger than 12 represented 51%
of all youth murder victims, 43% of
youth sexual assault victims, and 42%
of youth aggravated assault victims.
0 5 10 15 20 25 30 35 40 45 50 55 60
0%
1%
2%
3%
4%
Victim age
Percent of total aggravated assault victimizations
Male
All victims
Female
Aggravated assault
Until age 14, more simple assault victims were male than female; by age
19, twice as many females as males were simple assault victims
Q Unlike the pattern for aggravated assault, more females than males were victims of
simple assault from age 15 through age 50.
Q Among male victims of simple assault, 18% were younger than 18, compared with
11% of female victims.
Source: Authors’ analysis of the FBI’s
National Incident-Based Reporting System Master Files
for 2018
and 2019.
0 5 10 15 20 25 30 35 40 45 50 55 60
0%
1%
2%
3%
4%
Victim age
Percent of total simple assault victimizations
Male
All victims
Female
Simple assault
Male victims of aggravated assault outnumbered female victims from
ages 9 through 18, after which the number of victims were about the
same through age 40
Q The number of male and female victims of aggravated assault were about the same
through age 8.
Q In aggravated assaults reported to law enforcement, 14% of male and 12% of fe-
male victims were under age 18.
Source: Authors’ analyses of the FBI’s
National Incident-Based Reporting System Master Files
for 2018
and 2019.

Youth and the Juvenile Justice System: 2022 National Report
38
As youth age, those who violently victimize them are less
likely to be family members
Youth victims of violence are likely
to be harmed by adults
Analyses of the 2018 and 2019 NIBRS
data files provide an understanding of
the persons who victimize youth in vi-
olent crime incidents known to law en-
forcement. Although these data are not
nationally representative, the NIBRS
sample, which includes incidents on
more than 490,000 youth victims of
violent crime (murder, sexual assault,
robbery, aggravated assault, and simple
assault), is large enough to give cre-
dence to patterns derived from NIBRS
data.
Based on NIBRS data, more than half
(57%) of all youth violent crime victims
known to law enforcement were
harmed by an adult (i.e., a person over
age 17). The proportion of youth vic-
tims harmed by adults varied by of-
fense. Adults were more commonly in-
volved in murders (83%), aggravated
assaults (72%), and sexual assaults
(62%) against youth than in robberies
(52%) and simple assaults (52%) against
youth.
The proportion of youth victimized by
an adult varied with the youth’s age.
Overall, youth younger than age 6 and
those ages 6–11 were more likely to
experience violence by an adult than
were youth age 12 or older, a pattern
that held for murder, aggravated, and
simple assault. For violent sex offenses,
youth ages 15–17 were most likely to
be victimized by an adult, followed by
youth younger than age 6.
Among youth sexual assault victims, those younger than age 12
were more likely to be harmed by a family member than were victims
age 12 or older
Victim-offender
relationship
Relationship profile
Age of victim Victim ages 0–17
0–17 0–5 6–11 12–14 15–17 Male Female
Violent crime 100% 100% 100% 100% 100% 100% 100%
Family 40 69 54 32 29 39 41
Acquaintance 53 26 41 62 62 52 54
Stranger 7 5 5 6 9 9 5
Sexual assault 100% 100% 100% 100% 100% 100% 100%
Family 44 66 60 35 24 50 42
Acquaintance 53 32 38 61 71 47 54
Stranger 3 2 2 4 5 3 3
Robbery 100% 100% 100% 100% 100% 100% 100%
Family 1 * 2 1 1 1 2
Acquaintance 44 * 31 48 46 45 41
Stranger 54 * 67 51 53 54 56
Aggravated assault 100% 100% 100% 100% 100% 100% 100%
Family 42 64 52 37 27 40 45
Acquaintance 43 24 34 50 56 44 42
Stranger 15 13 14 13 17 16 13
Simple assault 100% 100% 100% 100% 100% 100% 100%
Family 39 73 51 30 32 39 40
Acquaintance 55 23 45 65 62 55 56
Stranger 5 3 4 5 6 6 4
Q In crimes known to law enforcement, the youngest victims (younger than age 6) are
far more likely than the oldest victims (ages 15–17) to be assaulted by a family mem-
ber: sexual assault (66% vs. 24%), aggravated assault (64% vs. 27%), and simple
assault (73% vs. 32%).
*Too few victims in sample to obtain reliable percentage.
Notes: Violent crime includes murder, sexual assault, robbery, aggravated assault, and simple
assault. In this data set, the term “offender” is used to describe the person identified by law
enforcement as having committed the crime. Detail may not total 100% because of rounding.
Source: Authors’ analyses of the FBI’s
National Incident-Based Reporting System: Master
Files
for 2018 and 2019.
Across violent crimes against youth, males were more likely to be
victimized by a juvenile than were females
Offense
Percent of youth victims victimized by youth ages 0–17
Age of victim Victim ages 0–17
0–17 0–5 6–11 12–14 15–17 Male Female
Violent crime 43% 15% 38% 58% 43% 46% 40%
Sexual assault 38 37 41 42 33 47 37
Robbery 48 11 47 66 44 52 34
Aggravated assault 28 5 24 45 34 31 24
Simple assault 48 6 39 65 48 49 46
Source: Authors’ analyses of the FBI’s
National Incident-Based Reporting System: Master Files
for 2018 and 2019.

Chapter 2: Youth victims
39
Violence involving youth victims is most common at the end
of the school day
The risk of violence varies over a
24-hour period
To understand the nature of youth vic-
timization, it helps to study when dif-
ferent types of crimes occur. To this
end, the authors analyzed the FBI’s
NIBRS data for the years 2018 and
2019 to study the date and time of day
that crimes known to law enforcement
occurred. Consistent with prior analy-
ses, the daily timing of violent crimes
(i.e., murder, sexual assault, robbery,
aggravated assault, and simple assault)
differed for youth and adult victims. In
general, the number of violent crimes
with adult victims increased hourly
from morning through the evening
hours, peaking around 9 p.m. In con-
trast, violent crimes with youth victims
peaked at 3 p.m., fell to a lower level
in the early evening hours, and de-
clined substantially after 8 p.m.
The 3 p.m. peak reflected a unique sit-
uational characteristic of youth violence
and was similar for both male and fe-
male victims. This situational compo-
nent was clarified when the hourly pat-
terns of violent crimes on school and
nonschool days were compared. For
adult victims, the school and non-
school-day patterns were similar. On
nonschool days, the youth victimiza-
tion pattern mirrored the general adult
pattern, with a peak in the late evening
hours. But on school days, the number
of youth violent crime victimizations
spiked at 8 a.m. and at noon, and
reached a peak in the afterschool hours
between 3 and 4 p.m.
Based on violent crimes reported to
law enforcement, youth were more
than twice as likely to be victimized
between 3 and 4 p.m. on school days
as in the same time period on non-
school days (i.e., weekends and the
summer months). On school days,
youth were nearly twice as likely to be
the victims of violence in the 4 hours
between 3 and 7 p.m. as they were in
the 4 hours between 8 p.m. and mid-
night.
The timing of violence against youth varies on school and nonschool
days and varies with the youth’s relationship to who harmed them
Q Time-of-day patterns of robberies with youth victims increase steadily on non-
school days, reaching a peak between 8 and 10 p.m. On school days, however,
robberies involving youth victims peak between 3 to 5 p.m. and increase again be-
tween 8 and 10 p.m.
Q While the risk of sexual assault victimization peaked at noon on school and non-
school days, the risk of victimization was relatively high at 8 a.m. on both days, and
at 3 p.m. on school days.
Q Unlike robberies against youth victims, sexual assaults and aggravated assaults
against youth are less likely to involve strangers.
Q Sexual assaults by acquaintances or family members are most common at 8 a.m.
and noon, and in the hour after school (3 p.m.).
Q Aggravated assaults committed by family members or acquaintances follow a simi-
lar pattern through the middle of the day, but victimizations by an acquaintance
peak at 3 p.m. while the risk of victimization by a family member continues to in-
crease, reaching a peak at 7 p.m.
Source: Authors’ analyses of the FBI’s
National Incident-Based Reporting System Master Files
for 2018
and 2019.
0%
1%
2%
3%
4%
5%
6%
Percent of total juvenile sexual assault victimizations
School days
Sexual assault
Nonschool days
6 a.m. noon 6 p.m. midnight 6 a.m.
0%
1%
2%
3%
4%
5%
6%
Percent of total juvenile sexual assault victimizations
Family
Sexual assault
Acquaintance
Stranger
6 a.m. noon 6 p.m. midnight 6 a.m.
0%
1%
2%
3%
4%
5%
Percent of total juvenile aggravated assault victimizations
School days
Aggravated assault
Nonschool days
6 a.m. noon 6 p.m. midnight 6 a.m
0%
1%
2%
3%
4%
Percent of total juvenile aggravated assault victimizations
Acquaintance
Aggravated assault
Family
Stranger
6 a.m. noon 6 p.m. midnight 6 a.m.
0%
1%
2%
3%
4%
5%
6%
Percent of total juvenile robbery victimizations
School days
Robbery
Nonschool
days
6 a.m. noon 6 p.m. midnight 6 a.m.
0%
1%
2%
3%
4%
5%
6%
Percent of total juvenile robbery victimizations
Stranger
Robbery
Acquaintance
6 a.m. noon 6 p.m. midnight 6 a.m.

Youth and the Juvenile Justice: 2022 National Report
40
Peak hours for youth victimization var-
ied with victim age. For victims ages
6–11 and 12–14, violent crime victim-
ization peaked at 3 p.m., the hour as-
sociated with the end of the school
day. Conversely, for older victims ages
15–17, noon and 3 p.m. were the peak
times for victimization. Among the
youngest victims, those under age 6,
the peak was at noon.
The timing of youth violence
victimization is linked to their
relationship with who harmed
them
The daily timing of youth violence vic-
timization varies with the relationship
(i.e., family members, acquaintances,
and strangers) between youth victims
and those who harm them. Most of
those who commit violence against
youth were acquaintances of their vic-
tims. The timing of violent crimes by
acquaintances reflected the afterschool
peak, indicating the importance this
time period (and probably unsuper-
vised interactions with other youth)
has for these types of crimes. Violent
crimes by family members were most
frequent at noon and in the hours be-
tween 3 and 7 p.m., although, unlike
crimes committed by an acquaintance,
there was no obvious 3 p.m. peak. Vio-
lent crimes committed by strangers
peaked at 3 p.m. and remained at a rel-
atively high level until 9 p.m.
The timing of violent crime with youth victims differs from that of crimes
with adult victims
Q The afterschool peak in victimizations for youth ages 6–17 is a result of crimes
committed by nonfamily members.
Note: Violent crime includes murder, sexual assault, robbery, aggravated assault, and simple assault.
Source: Authors’ analyses of the FBI’s
National Incident-Based Reporting System Master Files
for 2018
and 2019.
0%
2%
4%
6%
8%
Percent of total violent victimizations in age group
Family
Victims ages 12−14
Nonfamily
6 a.m. noon 6 p.m. midnight 6 a.m.
0%
1%
2%
3%
4%
5%
6%
Percent of total violent victimizations in age group
Family
Victims ages 15−17
Nonfamily
6 a.m. noon 6 p.m. midnight 6 a.m.
0%
1%
2%
3%
4%
5%
6%
Percent ot total violent victimizations in age group
Family
Victims younger than 6
Nonfamily
6 a.m. noon 6 p.m. midnight 6 a.m
0%
1%
2%
3%
4%
5%
6%
Percent of total violent victimizations in age group
Nonfamily
Victims ages 6−11
Family
6 a.m. noon 6 p.m. midnight 6 a.m.
0%
2%
4%
6%
8%
10%
Percent of total serious violent victimizations in age group
Younger than 18
Serious violent crime
Age 18 and older
6 a.m. noon 6 p.m. midnight 6 a.m.
0%
2%
4%
6%
8%
10%
Percent of total simple assault victimizations in age group
Younger
than 18
Simple assault
Age 18 and older
6 a.m. noon 6 p.m. midnight 6 a.m.
Q Serious violent crime against youth peaked at noon while simple assault with youth
victims peaked at 3 p.m. For adults, the risk of adult victimization increases
throughout the day, peaking at 9 p.m. for both offenses.
Note: Serious violent crime includes murder, sexual assault, robbery, and aggravated assault.
Source: Authors’ analyses of the FBI’s
National Incident-Based Reporting System Master Files
for 2018
and 2019.
Throughout the day, youth under age 6 are most likely to be victimized
by family members

Chapter 2: Youth victims
41
Nearly 6 in 10 violent crimes with youth victims occur in a
residence
The location of youth violence
varies with crime and victim age
The portrait of violence against youth
requires an understanding of not only
when these crimes occur but also
where. Data from NIBRS includes the
locations of crimes reported to law en-
forcement agencies. Data from 2018
and 2019 show that the location of vi-
olent crime against youth varies with
the nature of the crime and the age of
the victim.
Overall, 58% of youth victims of vio-
lence were harmed in a residence, 19%
were victimized at school, 14% were
harmed outdoors, and 8% in a com-
mercial area. Most assaults occurred in
a residence —79% of sexual assaults,
60% of aggravated assaults, and 50% of
simple assaults—while nearly half (47%)
of robberies occurred outdoors.
Location profile of juvenile victimizations,
2018–2019:
Location
Sexual
assault Robbery
Aggravated
assault
Total 100% 100% 100%
Residence 79 21 60
Outdoors 6 47 23
Commercial 5 27 9
School 9 5 8
Note: Detail may not total 100% because of
rounding.
The location of youth violence also
varied with victim age. For example,
81% of victims under age 6 were
harmed in a residence, compared with
51% of victims ages 15–17. Youth ages
12–14 were more likely to be victim-
ized at school than youth of other
ages.
Location profile of juvenile victimizations,
2018–2019:
Location
Under
age 6
Ages
6–11
Ages
12–14
Ages
15–17
Total 100% 100% 100% 100%
Residence 81 69 48 51
Outdoors 8 11 15 17
Commercial 7 5 7 12
School 4 14 30 19
Note: Detail may not total 100% because of
rounding.
0%
1%
2%
3%
4%
Percent of total juvenile violent crime victimizations
Residence
Outdoors
School
Commercial
6 a.m. 6 p.m. 6 a.m.noon midnight
The hourly proportion of violent victimizations involving youth that
occurred in residences was 60% or more from 5 p.m. through 6 a.m.
Note: The detailed NIBRS coding structure of location can be simplified for analyses into four general
locations: a residence (the victim’s, the offender’s, or someone else’s); the outdoors (streets, highways,
roads, woods, fields, etc.); schools (including colleges); and commercial areas (parking lots, restau-
rants, government buildings, office buildings, motels, and stores).
Source: Authors’ analyses of the FBI’s
National Incident-Based Reporting System Master Files
for 2018
and 2019.
0%
20%
40%
60%
80%
100%
Percent of violent crimes with juvenile victims within hour
6 a.m. noon 6 p.m. midnight 6 a.m.
Residence Outdoors School Commercial
Violent crime with youth victims peaked in residences at noon and
again between the hours of 3 p.m. and 6 p.m.
Q Violent victimization of youth outdoors exhibited a distinct peak at 3 p.m., while vic-
timizations in commercial areas were relatively high from 3 p.m. to 9 p.m.

Youth and the Juvenile Justice System: 2022 National Report
42
On average, 1,334 youth under age 18 in the U.S. were
murdered each year between 2010 and 2019
Homicide is one of the leading
causes of death for youth younger
than 18
In 2019, the National Center for Inju-
ry Prevention and Control (within the
Centers for Disease Control and Pre-
vention) reports that homicide was the
fourth leading cause of death for chil-
dren ages 1–11. Only deaths caused by
unintentional injury, cancer, and con-
genital anomalies were more common
for these youth. That same year, homi-
cide was the third leading cause of
death for youth ages 12–17, behind
unintentional injury and suicide.
The FBI and NCHS maintain
detailed records of murders
The Federal Bureau of Investigation’s
(FBI’s) Uniform Crime Reporting Pro-
gram asks local law enforcement agen-
cies to provide detailed information on
all homicides occurring within their ju-
risdictions. These Supplementary Ho-
micide Reports (SHR) contain infor-
mation on victim demographics and
the method of death. Also, when
known, SHR captures the circumstanc-
es surrounding the death, the demo-
graphics of the individual(s) who
committed the act, as well as their rela-
tionship to the victim. Although not all
agencies report every murder every
year, for the years 1980 through 2019,
the FBI received SHR records on 90%
of all homicides in the U.S.
For 2019, the FBI reported that law
enforcement identified who committed
the crime in 68% of murders nation-
wide, which means that for many of
these crimes, the person who commit-
ted the crime was not known to law
enforcement.
Based on SHR data from 1980
through 2019, the person who com-
mitted the act was unknown to law en-
forcement in 22% of the murders of
persons under age 18, in 32% of the
80 83 86 89 92 95 98 01 04 07 10 13 16 19
0
500
1,000
1,500
2,000
2,500
3,000
Year
Juvenile involved
Adults only
Unknown
Youth homicide victims
Who committed homicide
Between 2010 and 2019, the likelihood of being a murder victim peaked
for persons in their early twenties, but for females, the first year of life
was the most dangerous
Q Girls and boys were equally likely to be homicide victims until their teenage years.
Source: Authors’ analysis of the FBI’s
Supplementary Homicide Reports
for 2010 through 2019.
0 6 12 18 24 30 36 42 48 54 60 66 72
0
5
10
15
20
25
Age
Homicide victims per 100,000 persons in age/sex group, 2010−2019
Male
All victims
Female
The number of youth homicide victims in 2019 was 52% below the peak
year of 1993 and 12% above the 2013 low point
Q Between 2010 and 2019, there were 13,340 youth homicide victims — an average
of 1,334 per year, compared with an annual average of 1,638 in the 2000s and
2,375 in the 1990s.
Q Among homicides committed by persons known to law enforcement, 17% of youth
victims were killed by juveniles (acting alone or with other juveniles or adults) be-
tween 2010 and 2019. In 28% of youth homicides committed by juveniles, adults
were also involved.
Source: Authors’ analyses of the FBI’s
Supplementary Homicide Reports
for 1980 through 2019.

Chapter 2: Youth victims
43
murders of adults, and in 31% of mur-
ders overall.
Within the Centers for Disease Control
and Prevention (CDC), the National
Center for Health Statistics (NCHS)
maintains the National Vital Statistics
System. This system receives reports on
homicides from coroners and medical
examiners. Between 2010 and 2019,
NCHS annual estimates of youth ho-
micides tended to be about 18% higher
than those from the FBI. The reasons
for this difference are unclear but are
probably related to inconsistent report-
ing and/or to differences in defini-
tions, updating procedures, and/or
imputation techniques.
An important component of this re-
port is the delineation of the character-
istics of homicide victims and those
who commit homicide. Because the
NCHS data do not capture informa-
tion on those who commit homicide,
the discussion that follows is based on
the FBI’s SHR data.
The likelihood of being a homicide
victim has increased in recent
years
According to FBI estimates, 16,669
murders occurred in the U.S. in 2019
— 5.1 murders for every 100,000 U.S.
residents. During the 1980–2019 peri-
od, the number of murders reached a
peak in 1991 at 24,703 victims, fell
37% through 1999, increased through
2006, then fell to a historic low in
2014, 43% below the 1991 peak. The
period of decline was briefly interrupt-
ed as the number of homicides in-
creased through 2016, and then de-
clined. By 2019, the number of
homicide victims was 33% below the
1991 peak and 18% above the 2014
low point.
The 2019 homicide victimization rate
of 5.1 was 14% above the level in 2014
— the year with the lowest homicide
rate (4.4) and the fewest homicides of
80 83 86 89 92 95 98 01 04 07 10 13 16 19
0
200
400
600
800
1,000
1,200
1,400
1,600
Year
Homicide victims
Ages 15−17
Ages 0−5
Ages 12−14
$JHVí
Homicides involving males accounted for 85% of the increase in youth
homicides between 1984 and 1993 and 71% of the decline between
1993 and 2019
Q Unlike the number of male victims, the annual number of female homicide victims
was relatively stable between 1980 and 2019.
Source: Authors’ analysis of the FBI’s
Supplementary Homicide Reports
for 1980 through 2019.
80 83 86 89 92 95 98 01 04 07 10 13 16 19
0
500
1,000
1,500
2,000
2,500
Year
Youth homicide victims
Male
Female
The large increase and subsequent decline in youth homicides was
nearly all attributable to changes in homicides of older youth
Q Victims ages 15–17 accounted for 68% of the increase of youth murdered between
1984 and 1993 and 58% of the decline between 1993 and 2019.
Q Murder is most common among the oldest and youngest youth. Of the estimated
1,366 youth homicide victims in 2019, 34% were under age 6, 13% were ages
6–11, 7% were ages 12–14, and 45% were ages 15–17.
Source: Authors’ analyses of the FBI’s
Supplementary Homicide Reports
for 1980 through 2019.

Youth and the Juvenile Justice: 2022 National Report
44
the 1980–2019 period — and nearly
half the rate of the 1991 peak (10.1).
An estimated 1,366 youth
homicide victims were reported in
2019 — about 4 per day
In 2019, there were an estimated
1,366 persons under age 18 murdered
in the U.S. — 8% of all persons mur-
dered that year. More than one-fourth
(27%) of these youth victims were fe-
male. More than one-third (34%) of
these victims were under age 6, 13%
were ages 6–11, less than 1 in 10 (7%)
were ages 12–14, and more than 4 in
10 (45%) were ages 15–17.
Black youth accounted for more than
half (54%) of youth homicide victims
in 2019, 42% were White, and 3% were
either American Indian or Asian. By
way of comparison, White youth con-
stituted 75% of the U.S. resident youth
population under age 18 in 2019 and
Black youth 17%. The homicide rate
for Black youth in 2019 was more than
5 times the White rate. This disparity
was seen across victim age groups and
increased with victim age.
Homicides per 100,000 youth, 2019:
Victim age White Black
Black
to White
rate ratio
0–17 1.0 5.9 5.6
0–5 1.4 4.8 3.5
6–11 0.5 1.8 3.5
12–14 0.5 2.2 4.6
15–17 2.1 20.1 9.8
Since 2013, the number of homicides of White youth fell 4% while
homicides of Black youth increased 28%
Q Black youth accounted for about 17% of the youth population between 2010 and
2019 but were the victims in half (50%) of youth homicides in the last 10 years.
Q The disparity between murder rates for Black youth and White youth peaked in
1993, when the Black rate was 6 times the White rate. The relatively greater decline
in homicides of Black youth between 1993 and 1999 (down 48%, compared with a
26% decline for White youth) dropped the disparity in Black-to-White homicide
rates to 4 to 1. However, since 2013, homicides of Black youth have been on the
rise, while the homicides of White youth declined. As a result, the 2019 homicide
rate for Black youth was nearly 6 times the White rate.
* Other race includes American Indian/Alaskan Native and Asian/Native Hawaiian/Pacific Islander.
Source: Authors’ analysis of the FBI’s
Supplementary Homicide Reports
for 1980 through 2019.
80 83 86 89 92 95 98 01 04 07 10 13 16 19
0
200
400
600
800
1,000
1,200
1,400
1,600
Year
Youth homicide victims
Black
White
Other race*
Between 2010 and 2019, nearly half (49%) of all homicide victims
under age 6 were killed by a parent, while parents were rarely
involved in the killing of youth ages 15–17
Relationship between
victim and person
committing homicide
Age of victim Victim ages 0–17
0–17 0–5 6–11 12–14 15–17 Male Female
Total 100% 100% 100% 100% 100% 100% 100%
Known 60 80 56 51 44 56 69
Parent/stepparent 24 49 30 12 1 20 33
Other family member 5 6 7 5 2 4 7
Acquaintance 24 23 12 21 28 24 23
Stranger 7 2 6 12 12 8 5
Unknown 40 20 44 49 56 44 31
Q During the 10-year period from 2010 to 2019, female victims were far more likely
than male victims to have been killed by a parent/stepparent or other family member.
Q
Strangers were involved in at least 7% of the murders of youth between 2010 and
2019. This figure is probably greater than 7% because strangers are likely to account
for a disproportionate share of crimes in which information about who committed the
crime is unknown.
Note: Detail may not total 100% because of rounding.
Source: Authors’ analyses of the FBI’s
Supplementary Homicide Reports
for 1980 through
2019.

Chapter 2: Youth victims
45
In 2019, 9 of every 10 murder victims ages 15–17 were killed
with a firearm
Trends in the number of youth
homicides are tied to homicides
involving firearms
More than half (58%) of all youth ho-
micide victims in 2019 were killed with
a firearm, 14% were killed by the of-
fender’s hands or feet (e.g., beaten/
kicked to death or strangled), and 7%
were killed with a knife or blunt ob-
ject. The remaining 20% of victims
were killed with another type of weap-
on, or the type of weapon used was
unknown.
Firearms were used less often in the
killings of young children. In 2019,
firearms were used in 15% of murders
of youth under age 6 but in 76% of the
murders of youth ages 12–14, and 90%
involving youth ages 15–17. In 2019,
a greater percentage of Black than
White youth murder victims were
killed with a firearm (68% vs. 48%),
and homicides of male youth were
more likely to involve a firearm than
those involving female youth (67% and
35%, respectively).
Across the 40-year period between
1980 and 2019, the deadliest year for
youth was 1993, with an estimated
2,840 youth victims. A relatively large
proportion of youth were killed with a
firearm in the early 1990s: 60% of
youth homicide victims were killed
with a firearm each year from 1992 to
1995. In fact, over the 40-year period,
the annual number of youth killed by
means other than a firearm generally
declined — a remarkable pattern when
compared with the large increase and
subsequent decline in the number of
firearm-related murders of youth. Ex-
cept for homicides of children under
age 6 and of youth by family members,
homicide trends in all demographic
segments of the youth population be-
tween 1980 and 2019 were related to
killings with firearms.
Since 2013, youth homicides increased 12% but the number involving a
firearm increased 42%
Q While firearms were involved in a greater proportion of adult than youth homicides,
youth ages 15–17 were more likely than adults to be killed by a firearm.
Q Trends in the proportions of firearm-related murders of male and female youth
showed similar growth and decline patterns over the period.
Q Firearms were involved in a greater proportion of Black than White youth homicides
each year since 1980, and between 2010 and 2019, Black youth were about 50%
more likely than White youth to be killed by a firearm.
Source: Authors’ analyses of the FBI’s
Supplementary Homicide Reports
for 1980 through 2019.
The proportion of homicides involving firearms varied by demographics
80 83 86 89 92 95 98 01 04 07 10 13 16 19
0%
20%
40%
60%
80%
Year
Firearm percent of youth homicide victims
Male
Female
80 83 86 89 92 95 98 01 04 07 10 13 16 19
0%
20%
40%
60%
80%
Year
Firearm percent of youth homicide victims
Black
White
80 83 86 89 92 95 98 01 04 07 10 13 16 19
0%
20%
40%
60%
80%
Year
Firearm percent of homicide victims
Adult
Youth
80 83 86 89 92 95 98 01 04 07 10 13 16 19
0%
20%
40%
60%
80%
100%
Year
Firearm percent of homicide victims
Ages 15−17
Ages 12−14
Ages 0−5
Ages 6−11
80 83 86 89 92 95 98 01 04 07 10 13 16 19
0
200
400
600
800
1,000
1,200
1,400
1,600
1,800
Year
Youth homicide victims
Firearm
No firearm

Youth and the Juvenile Justice: 2022 National Report
46
Children under 6 are killed by
family members—older youth are
killed by acquaintances
In the 2019 SHR data, information
about who committed the crime is
missing for 24% of youth homicide vic-
tims either because the information
about who committed the crime is un-
known or because the information was
not recorded on the data form. The
proportion of unknown offenders in
2019 generally increased with victim
age: ages 0–5 (9%), ages 6–11 (12%),
ages 12–14 (13%), and ages 15–17
(40%).
Considering only murders in 2019 for
which information about who commit-
ted the crime is known, a stranger
killed about 2% of murdered children
under age 12, while family members
killed 75% and acquaintances 23%.
Older youth were far more likely to be
killed by nonfamily members: 7% of
victims ages 15–17 were killed by fami-
ly members, 27% by strangers, and 66%
by acquaintances.
Differences in the characteristics of the
murders of male and female youth are
linked to the age profiles of the vic-
tims. Between 2010 and 2019, the an-
nual numbers of male and female vic-
tims were very similar for victims at
each age under 13. However, older
victims were disproportionately male.
For example, since 2010, 86% of
17-year-old homicide victims were
male. In general, therefore, a greater
proportion of female murder victims
were very young. While it is true that
female victims were more likely to be
killed by family members than were
male victims (59% vs. 42%), this differ-
ence goes away within specific age
groups. For example, between 2010
and 2019, for victims under age 6,
68% of males and 71% of females were
killed by a family member.
Between 2010 and 2019, 16- and 17-year-old murder victims were
among the most likely to be killed with firearms, regardless of gender
Q Boys and girls under age 6 were equally likely to be killed with a firearm. In the teen
years, however, boys were considerably more likely to be killed with a firearm: 88%
of boys ages 14–17 were killed with a firearm, compared with 66% of females in
the same age group.
Source: Authors’ analysis of the FBI’s
Supplementary Homicide Reports
for 1980 through 2019.
0 6 12 18 24 30 36 42 48 54 60 66 72
0%
20%
40%
60%
80%
100%
Age
Firearm percent of homicide victims, 2010−2019
Male
Female
All victims
More than half of the 13,340 youth homicide victims between 2010
and 2019 were killed with a firearm
Weapon
Age of victim Victim ages 0–17
0–17 0–5 6–11 12–14 15–17 Male Female
Total 100% 100% 100% 100% 100% 100% 100%
Firearm 51 13 49 73 85 60 34
Knife/blunt object 11 12 16 11 8 9 13
Personal* 19 42 10 3 1 16 25
Other/unknown 19 34 26 13 5 15 28
Q More than 4 in 10 (42%) homicide victims under age 6 were killed by offenders using
only their hands, fists, or feet (personal).
Q
More than 8 in 10 (85%) victims ages 15–17 were killed with a firearm.
Q
Overall, males were more likely than females to be killed by a firearm (60% vs. 34%),
while personal weapons were more common in the killing of females (25%) than
males (16%).
*Personal includes hands, fists, or feet.
Note: Detail may not total 100% because of rounding.
Source: Authors’ analyses of the FBI’s
Supplementary Homicide Reports
for 1980 through
2019.

Chapter 2: Youth victims
47
Since 2009, suicides have outnumbered homicides among
youth ages 10–17
Suicide was the second leading
cause of death among youth ages
10–17
The National Vital Statistics System
(NVSS) within the Centers for Disease
Control collects information from
death certificates filed in state vital sta-
tistics offices, including causes of death
of children. NVSS indicates that
35,805 youth ages 10–17 died by sui-
cide in the U.S. between 1990 and
2019. For all youth ages 10–17, sui-
cide was the second leading cause of
death between 2015 and 2019, trailing
only unintentional injury, while homi-
cide was the third leading cause of
death for youth ages 10–17 during the
same period. Since 2015, suicide was
the leading cause of death for Asian/
Pacific Islander youth, the second lead-
ing cause of death for male, female,
White, Hispanic, and American Indi-
an/Alaskan Native youth, and third for
Black youth (homicide was first).
Since 1990, males have outnumbered
females among youth suicide victims,
but the female proportion of suicide
victims has grown in recent years. For
example, through 2009, female youth
accounted for 22% of suicide victims;
since 2010, however, females account-
ed for 29% of youth suicide victims.
The method of suicide has changed
Between 1990 and 2000, most youth
suicides (62%) involved a firearm; each
year since, suicides by suffocation have
outnumbered those involving a fire-
arm. During the 10-year period from
2010 to 2019, for example, half of all
youth suicides involved suffocation,
while firearms were involved in 40%.
Firearm-related suicides in 2019 were
more common among male (49%) than
female youth (21%), and suicides
among White youth were more likely
to involve a firearm (46%) than were
those of Black (35%) or Hispanic (27%)
youth.
The method of suicide varies consider-
ably by gender, with suffocation being
Since 1990, suicide was more prevalent than homicide for non-Hispanic
White youth but the reverse was true for non-Hispanic Black youth
Q Youth homicide victims (ages 10–17) outnumbered youth suicide victims through
1999. More recently, however, the trend reversed as suicide victims outnumbered
homicide victims annually since 2009. In 2019, the number of suicide victims was
80% above the number of homicide victims.
Q Suicide and homicide victimizations have been on the rise in recent years for both
males and females, but the increase in suicides started earlier (2010) than the in-
crease in homicides (2013). Since 2010, the number of suicides increased 54% for
males and 89% for females. Comparatively, since 2013, the number of homicide
victims increased 38% for males and 17% for females.
Q The annual number of White suicide victims exceeded the annual number of homi-
cide victims each year since 1990, and the gap has grown in recent years. The ratio
of suicides to homicides was 2.5 to 1 in the 1990s, but grew to more than 6 to 1 in
the last 5 years. Conversely, the annual number of Black homicide victims exceed-
ed the annual number of suicide victims each year since 1990, but the gap has nar-
rowed in recent years. The ratio of homicides to suicides was 7 to 1 in the 1990s
but fell to 3 to 1 n the last 5 years.
Q Since 2015, suicides outnumbered homicides among Hispanic youth by a ratio of
1.5 to 1, while homicides outnumbered suicides by more than 3 to 1 in the 1990s.
Source: Authors’ analyses of the Centers for Disease Control’s WISQARS (Web-based Injury Statistics
Query and Reporting System).
91 95 99 03 07 11 15 19
0
100
200
300
400
500
600
Year
Youth victims (ages 10−17), 1990−2019
Suicide
Homicide
Female victims
91 95 99 03 07 11 15 19
0
100
200
300
400
500
Year
Youth victims (ages 10−17)
Suicide
Homicide
Hispanic victims
91 95 99 03 07 11 15 19
0
400
800
1,200
1,600
2,000
Year
Youth victims (ages 10−17)
Suicide
Homicide
Male victims
91 95 99 03 07 11 15 19
0
200
400
600
800
1,000
1,200
Year
Youth victims (ages 10−17)
Suicide
Homicide
Black victims
91 95 99 03 07 11 15 19
0
500
1,000
1,500
2,000
2,500
Year
Youth victims (ages 10−17)
Suicide
Homicide
All victims
91 95 99 03 07 11 15 19
0
200
400
600
800
1,000
1,200
1,400
Year
Youth victims (ages 10−17)
Suicide
Homicide
White victims

Youth and the Juvenile Justice: 2022 National Report
48
more likely for females than for males.
While firearms were involved in the
majority of female suicides through
1999, suffocation has been more com-
mon each year since. For example,
since 2010, 61% of youth female sui-
cides involved suffocation, compared
with 45% for males. Conversely, during
the same period, 48% of male suicides
involved a firearm, compared with 21%
of female suicides.
Method of suicide, 2010–2019:
Method Male Female
Total 100% 100%
Firearm 48 21
Suffocation 45 61
Poisoning 311
Other 66
Note: Detail may not total 100% because of
rounding.
After reaching a low point in 2007,
the youth suicide rate has been
on the rise
Following a period of relative stability
through the mid-1990s, the youth sui-
cide rate fell 44% between 1994 and
2007. Since the 2007 low point, the
youth suicide rate grew substantially,
increasing 124% to reach a new peak in
2018, then declined 10% through
2019. This general pattern of decline
followed by considerable growth was
reflected in the trends of White, Black,
and Hispanic youth as well as males
and females. Between 2007 and 2018,
the male youth suicide rate more than
doubled, the female rate nearly tripled,
and the rate for White, Black, and His-
panic youth more than doubled; across
all groups, these increases were fol-
lowed by a one year decline through
2019.
American Indians have the highest
youth suicide rate
Beginning with the 1990 data, NVSS
distinguished fatalities by the victim’s
Hispanic ethnicity, enabling racial and
ethnic comparisons of youth suicides.
The risk of suicide was highest for
American Indian/Alaskan Native youth
Between 1999 and 2019, youth suicide victims outnumbered youth
homicide victims in 38 states
1999–2019 1999–2019
State
Suicide
rate
Suicide/
homicide
ratio State
Suicide
rate
Suicide/
homicide
ratio
U.S. total 3.5 1.3 Missouri 4.6 1.2
Alabama 3.3 0.9 Montana 8.5 6.6
Alaska 12.1 4.0 Nebraska 5.0 2.7
Arizona 4.8 1.6 Nevada 4.7 1.5
Arkansas 4.7 1.8 New Hampshire 3.6 NA
California 2.2 0.6 New Jersey 1.8 1.0
Colorado 6.9 3.8 New Mexico 8.3 2.3
Connecticut 2.3 1.6 New York 2.1 0.9
Delaware 3.4 1.4 North Carolina 3.2 1.2
Dist. of Columbia 2.0 0.1 North Dakota 7.8 8.3
Florida 2.7 0.9 Ohio 3.8 1.6
Georgia 3.2 1.0 Oklahoma 5.3 2.0
Hawaii 3.3 NA Oregon 4.5 4.4
Idaho 7.2 11.2 Pennsylvania 3.4 1.3
Illinois 2.9 0.6 Rhode Island 2.4 1.5
Indiana 3.8 1.3 South Carolina 3.7 1.2
Iowa 4.8 4.6 South Dakota 11.7 10.2
Kansas 4.9 2.7 Tennessee 3.6 1.1
Kentucky 3.7 2.0 Texas 3.7 1.5
Louisiana 3.7 0.6 Utah 6.5 8.2
Maine 4.0 6.0 Vermont 4.3 5.8
Maryland 2.7 0.6 Virginia 3.5 1.5
Massachusetts 2.2 1.6 Washington 4.2 2.5
Michigan 4.2 1.4 West Virginia 4.0 2.6
Minnesota 4.6 3.7 Wisconsin 4.5 2.3
Mississippi 3.4 0.9 Wyoming 9.5 5.0
NA: Too few homicides to calculate a reliable ratio.
Notes: The suicide rate is the average annual number of suicides of youth ages 10–17 divided by
the average annual population of youth ages 10–17 (per 100,000). The suicide/homicide ratio is
the total number of suicides of youth ages 10–17 divided by the total number of homicides of
youth ages 10–17. A ratio of more than 1.0 indicates that the number of suicides was greater than
the number of homicides.
Source: Authors’ analyses of the Centers for Disease Control’s WISQARS (Web-based Injury Sta-
tistics Query and Reporting System).
DC
Annual suicides per 100,000
youth ages 10–17, 1999–2019
Less than 3.3 (12 states)
3.3 to 3.8 (14 states)
3.9 to 4.8 (13 states)
4.9 and above (12 states)

Chapter 2: Youth victims
49
each year since 1990, and the disparity
has grown in recent years. During the
1990s, the average annual suicide rate
(i.e., suicides per 100,000 persons ages
10–17) for American Indian/ Alaskan
Native youth (8.1) was nearly twice the
rate for White youth (4.3), and about
three times the rates for Black (2.7),
Hispanic (3.0), and Asian (2.5) youth.
By the 2010s, the average annual rate
for American Indian/Alaskan Native
youth increased to 13.1, more than
twice the rate for White youth (5.1),
and more than four times the rates for
Black (2.8), Hispanic (2.8), and Asian
(2.9) youth.
Nearly 10% of high school
students indicated they attempted
suicide in the past year
The national Youth Risk Behavior Sur-
veillance System (YRBSS) monitors
priority health risk behaviors that con-
tribute to the leading causes of death,
disability, and social problems among
youth and adults in the United States.
The YRBSS is administered by the
Centers for Disease Control in odd-
numbered years to a nationally repre-
sentative sample of high school stu-
dents in public and private high
schools throughout the United States.
Among the range of self-reported be-
haviors captured by YRBSS are four
questions related to suicide. In particu-
lar, respondents are asked if they con-
sidered suicide, made a plan about
committing suicide, attempted suicide,
and were injured by such an attempt.
Based on the 2019 YRBSS, about 1 in
5 (19%) high school students indicated
they had “seriously considered at-
tempting” suicide in the past year, and
about 1 in 10 (9%) indicated they at-
tempted suicide in the past year.
Since 2009, the proportion of high
school students who report
attempting suicide increased
The percent of high school students
who seriously considered attempting
suicide fell significantly between 1991
and 2009 (from 29.0% to 13.8%), then
increased to 18.8% in 2019. Despite
the recent increase, the percent of high
school students who considered at-
tempting suicide in 2019 was well
below the 1991 level. The percent of
high school students who attempted
suicide reached a low point in 2009
(6.3%), then increased through 2019
(8.9%) to its highest level since 1991,
while the percent of high school stu-
dents who attempted suicide that re-
sulted in injury stayed within a limited
range (1.7% to 2.9%) during this period.
After reaching a low in 2009, the percent of high school youth who
considered, planned, or attempted suicide increased significantly
through 2019
Q The percent of high school students who seriously considered attempting suicide
fell significantly between 1991 and 2009 (from 29% to 14%). Despite the recent in-
crease, the percent of high school students who considered suicide in 2019 was
well below the 1991 level.
Q The percent of high school students who attempted suicide fluctuated between 6%
and 9% between 1991 and 2019, and the percent of high school students who at-
tempted suicide that resulted in injury stayed within a limited range (1.7% to 2.9%)
during this period.
Source: Authors’ analysis of the Center for Disease Control and Prevention’s
1991–2019 High School
Youth Risk Behavior Survey Data.
91 93 95 97 99 01 03 05 07 09 11 13 15 17 19
0%
5%
10%
15%
20%
25%
30%
Year
Percent of high school students reporting behavior
Attempted suicide
Planned suicide
Seriously considered suicide

Youth and the Juvenile Justice: 2022 National Report
50
In 2019, female high school students were more likely to report suicide-related behaviors than their male
peers
In the last 12 months:
Youth characteristics
Considered
suicide
Planned
suicide
Attempted
suicide
Injured after
an attempt
All high school students 18.8% 15.7% 8.9% 2.5%
Gender
Male 13.3 11.3 6.6 1.7
Female 24.1 19.9 11.0 3.3
Race/ethnicity*
White 19.1 15.7 7.9 2.1
Black/African American 16.9 15.0 11.8 3.3
Hispanic or Latino 17.2 14.7 8.9 3.0
American Indian/Alaska Native 34.7 24.2 25.5 NA
Asian 19.7 16.1 7.7 1.7
Native Hawaiian/Other Pacific Islander NA NA NA NA
Multiple race 25.7 22.3 12.9 4.1
Grade
9th 17.7 14.8 9.4 2.3
10th 18.5 15.4 8.8 2.7
11th 19.3 16.4 8.6 2.3
12th 19.6 16.2 8.5 2.7
Sexual identity
Heterosexual 14.5 12.1 6.4 1.7
Gay, lesbian, bisexual 46.8 40.2 23.4 6.3
Not sure 30.4 23.9 16.1 5.2
Q In 2019, Black high school students were less likely to have considered suicide than White students, but more likely to have
attempted suicide than White students; White youth were less likely than American Indian/Alaskan Native and multi-racial
youth to have considered or attempted suicide.
Q The proportion of high school students reporting suicide-related behaviors did not vary by grade in 2019.
Q Students who identify as heterosexual were significantly less likely to report suicide-related behaviors than students who iden-
tify as gay, lesbian, and bisexual, and those who are not sure of their sexual orientation.
* Racial categories (White, Black, American Indian/Alaska Native, Asian, Native Hawaiian/Other Pacific Islander, and multiple race) do not include
persons of Hispanic ethnicity. Persons of Hispanic ethnicity can be any race.
NA = Too few respondents to develop a reliable estimate.
Notes: The reference period for each question was 12 months prior to the survey. Survey questions asked:
Did you ever seriously consider attempting suicide?
Did you make a plan about how you would attempt suicide?
How many times did you actually attempt suicide?
Did any attempt result in an injury, poisoning, or overdoes that had to be treated by a doctor or nurse?
Source: Authors’ analyses of the Center for Disease Control and Prevention’s
1991–2019 High School Youth Risk Behavior Survey Data.
.

Chapter 2: Youth victims
51
Sources
Bureau of Justice Statistics. Various.
National Crime Victimization Survey
Dashboard (N-DASH)
, for the years
1994 through 2019. Available at
https://ncvs.bjs.ojp.gov/Home.
Bureau of Justice Statistics.
School
Crime Supplement (SCS) to the Na-
tional Crime Victimization Survey, se-
lected years, 2005 through 2019
.
Table 230.45. Percentage of students
ages 12–18 who reported being bullied
at school during the school year, by
type of bullying and selected student
and school characteristics: Selected
years, 2005 through 2019. Available at
https://nces.ed.gov/programs/
digest/d20/tables/dt20_230.45.asp.
Bureau of Justice Statistics.
School
Crime Supplement (SCS) to the Na-
tional Crime Victimization Survey,
2019
. Table 230.50. Percentage of stu-
dents ages 12–18 who reported being
bullied at school during the school year
and, among bullied students, percent-
age who reported being bullied in vari-
ous locations, by selected student and
school characteristics: 2019. Available
at https://nces.ed.gov/programs/
digest/d20/tables/dt20_230.50.asp.
Bureau of Justice Statistics. 2020.
School Crime Supplement (SCS) to
the National Crime Victimization Sur-
vey, 2019
. Table 230.60. Among stu-
dents ages 12–18 who reported being
bullied at school during the school
year, percentage reporting various fre-
quencies of bullying and the notifica-
tion of an adult at school, by selected
student and school characteristics:
2019. Available at https://nces.ed.
gov/programs/digest/d20/tables/
dt20_230.60.asp.
Centers for Disease Control and Pre-
vention. 2020.
1991–2019 High
School Youth Risk Behavior Survey
Data
. Available at http://nccd.cdc.
gov/youthonline.
Centers for Disease Control and Pre-
vention, National Center for Injury
Prevention and Control. WISQARS
(Web-based Injury Statistics Query and
Reporting System) [interactive data-
base system]. Available from www.cdc.
gov/injury/wisquars.
Children’s Bureau, U.S. Department
of Health and Human Services. Vari-
ous.
Child Maltreatment Reports
for
the years 2009, 2010, 2012, and
2015–2019. Available online from
www.acf.hhs.gov/cb/data-research/
child-maltreatment.
Children’s Bureau, U.S. Department
of Health and Human Services. 2006.
The AFCARS Report: Final Estimates
for FY 1998 through FY 2002
. Avail-
able online from www.acf.hhs.gov/cb/
research-data-technology/statistics-
research/afcars.
Children’s Bureau, U.S. Department
of Health and Human Services. 2020.
Trends in Foster Care and Adoption:
FY 2010–FY 2019
. Available online
from www.acf.hhs.gov/cb./report-
trends-foster-care-adoption-
fy-2010-2019.
Children’s Bureau, U.S. Department
of Health and Human Services. Vari-
ous (2004 through 2020).
The AF-
CARS Report: Preliminary Estimates
for fiscal years 2003 through 2019.
Available online from www.acf.hhs.
gov/cb/research-data-technology/
statistics-research/afcars.
Federal Bureau of Investigation. 2019
and 2020.
National Incident-Based Re-
porting System Master Files
for the
years 2018 and 2019. Retrieved from
the Crime Data Explorer at https://
crime-data-explorer.fr.cloud.gov/
downloads-and-docs.
Federal Bureau of Investigation [col-
lector]. Various years.
Supplementary
Homicide Reports
for the years 1980–
2016 [machine-readable data files].
Ann Arbor, MI: Inter-university Con-
sortium for Political and Social Re-
search, National Archive of Criminal
Justice Data [distributor].
Federal Bureau of Investigation.
Uni-
form Crime Reporting Program Data:
Supplementary Homicide Reports,
Master Files
for the years 2017–2019.
Retrieved from the Crime Data Ex-
plorer at https://crime-data-explorer.
fr.cloud.gov/downloads-and-docs.
Federal Bureau of Investigation. 2021.
Crime in the United States, 2020
.
Table 1: Crime in the United States by
Volume and Rate per 100,000 Inhabit-
ants, 2001–2020. Downloaded from
the FBI’s Crime Data Explorer, avail-
able at crime-data-explorer.app.cloud.
gov/pages/home.
National Center for Education Statis-
tics.
Digest of Education
. Table
228.20: Number of nonfatal victimiza-
tions against students ages 12–18 and
rate of victimization per 1,000 stu-
dents, by type of victimization, loca-
tion, and year: 1992 through 2019.
Available from nces.ed.gov/programs/
digest/d20/tables/dt20_228.20.asp.
National Center for Education Statis-
tics.
Digest of Education
. Table
228.25. Number of nonfatal victimiza-
tions against students ages 12–18 and
rate of victimization per 1,000 stu-
dents, by type of victimization, loca-
tion, and selected student characteris-
tics: 2019. Available from nces.ed.gov/
programs/digest/d20/tables/
dt20_228.25.asp.
U.S. Department of Health and
Human Services. Stopbullying.gov
website. Available at www.
Stopbullying.gov.

Youth and the Juvenile Justice System: 2022 National Report
53
Chapter 3
Offending by youth
3
Highly publicized—often violent—
events tend to shape public percep-
tions of offending by youth. It is im-
portant for the public, the media,
elected officials, and juvenile justice
professionals to have an accurate view
of (1) the crimes committed by
youth, (2) the proportion and charac-
teristics of youth involved in law-vio-
lating behaviors, and (3) trends in
these behaviors. This understanding
can come from studying self reports
of offending behavior, victim reports,
and official records.
As documented in the following
pages, many youth who commit
crimes (even serious crimes) never
enter the juvenile justice system. Con-
sequently, developing a portrait of
youth law-violating behavior from of-
ficial records gives only a partial pic-
ture. This chapter presents what is
known about the prevalence and inci-
dence of offending by youth prior to
the youth entering the juvenile justice
system. It relies on self-report and vic-
tim data developed by the Bureau of
Justice Statistics’ National Crime Vic-
timization Survey, the Centers for
Disease Control and Prevention’s
Youth Risk Behavior Surveillance Sur-
vey, and the National Institute on
Drug Abuse’s Monitoring the Future
Study. Official data on offending by
youth are presented from the Federal
Bureau of Investigation’s Supplemen-
tary Homicide Reports and its Nation-
al Incident-Based Reporting System.
In this chapter, readers can learn the
answers to many commonly asked
questions: What proportion of youth
are involved in crime at school? Is it
common for youth to carry weapons
to school? Are students fearful of
crime at school? How prevalent is
drug and alcohol use? How many ho-
micides are committed by youth, and
whom do they murder? When are
crimes committed by youth most likely
to occur? Are there gender and racial/
ethnic differences in the law-violating
behaviors of youth?
Official statistics on offending by
youth as it relates to law enforcement,
juvenile and criminal courts, and cor-
rectional facilities are presented in sub-
sequent chapters in this report.

Youth and the Juvenile Justice System: 2022 National Report
54
Self reports and official records are the primary sources of
information on offending by youth
Self-report studies ask
participants to report on their
experiences and behaviors
Much of what is known about the
prevalence and characteristics of of-
fending by and against youth is derived
from self-report studies and official sta-
tistics. Self-report studies can capture
information on behavior that never
comes to the attention of the justice
system. Compared with official data,
self-report studies tend to find a higher
proportion of the youth population in-
volved in law-violating behavior.
Self-report studies, however, have their
own limitations. A youth’s memory
limits the information that can be cap-
tured. This, along with other problems
associated with interviewing young
children, is the reason that the Nation-
al Crime Victimization Survey does not
attempt to interview children under
age 12. Some respondents are also un-
willing to disclose law violations com-
mitted by or against them. Finally, it is
often difficult for self-report studies to
collect data from large enough samples
to develop a sufficient understanding
of relatively rare events, such as serious
violent offending.
Official statistics document what
comes to the attention of the
justice system
Official records underrepresent offend-
ing by youth. Many crimes committed
by youth are never reported to authori-
ties. Many youth who commit offenses
are never arrested or are not arrested
for all of their law violations. As a re-
sult, official records systematically un-
derestimate the scope of offending by
youth. In addition, to the extent that
other factors may influence the types of
crimes or youth that enter the justice
system, official records may distort the
attributes of juvenile crime.
Official statistics can yield multiple
interpretations
Relying on official statistics alone can
lead to an incomplete understanding of
offending by youth. Consider the
trends in youth arrests for drug abuse
violations. Since reaching a peak in the
late 1990s, youth arrests for drug
abuse violations have declined consid-
erably. One interpretation of these offi-
cial statistics could be that youth today
are simply less likely to violate drug
laws than were youth in the 1990s.
National self-report studies, such as
Monitoring the Future, however, find
that illicit drug use changed little since
the mid-2000s. If drug use is relatively
stable, the declining youth arrest rate
for drug crimes may represent societal
tolerance of such behavior and/or an
unwillingness to bring these youth into
the justice system for treatment or
punishment.
Although official records may be inad-
equate measures of the level of offend-
ing by youth, they are good indicators
of justice system activity. Analysis of
variations in official statistics across
time and jurisdictions provides an un-
derstanding of justice system caseloads.
Used together, self-report and
official statistics provide insight
into offending and victimization
Delbert Elliott, founding director of
the Center for the Study and Preven-
tion of Violence and lead research in-
vestigator of the National Youth Sur-
vey, has argued that to abandon either
self-report or official statistics in favor
of the other is “rather shortsighted; to
systematically ignore the findings of ei-
ther is dangerous, particularly when
the two measures provide apparently
contradictory findings.” Elliott stated
that a full understanding of the etiolo-
gy and development of youth law-vio-
lating behavior is enhanced by using
and integrating both self-report and
official data.
Trends in self-report drug use and official records of drug arrest rates
have diverged in recent years
Q Self-report and official data sources send a mixed message regarding youth drug
use. According to self-report data, the proportion of high school seniors reporting
use of any illicit drug (including marijuana) in the past year changed little since
2008, ranging from 36% to 40% through 2019. Conversely, the arrest rate for drug
law violations involving 17-year-olds has declined 55% since 2008 (from 1,655 per
100,000 youth to 745 in 2019).
Source: Authors’ adaptation of Miech et al.’s
Monitoring the Future National Survey on Drug Use,1975–
2010. Volume I: Secondary School Students
and authors’ analysis of arrest data from the Bureau of
Justice Statistics and the National Center for Juvenile Justice.
91 93 95 97 99
0%
5%
10%
15%
20%
25%
30%
35%
40%
45%
0
300
600
900
1,200
1,500
1,800
2,100
Year
Self-report use
Arrests
Percent of seniors reporting illicit
drug use in the past year
Drug law violation arrest rate
for 17-year-olds (per 100,000)
01
03
05
07
09
11
13
15
17
19

Chapter 3: Offending by youth
55
In 2019, about 1 in 8 high school students carried a weapon
in the past month, and 1 in 36 carried a weapon to school
National survey monitors youth
health risk behaviors
The Centers for Disease Control and
Prevention’s Youth Risk Behavior Sur-
veillance System (YRBSS) monitors
health risk behaviors that contribute to
the leading causes of death, injury, and
social problems among youth in the
U.S. Every 2 years, YRBSS collects
data from a representative sample of
9th–12th graders in public and private
schools nationwide. The 2019 survey
included responses from 13,677 stu-
dents from 44 states and 27 large cities.
In 2019, 3% of students carried a
weapon to school
The 2019 YRBSS found that 13% of
high school students said they had car-
ried a weapon (e.g., gun, knife, or
club) anywhere in the past 30 days and
3% said they carried a weapon on
school property. Additionally, 4% of
high school students said they carried a
gun (anywhere) at least once in the
past 12 months.
About 1 in 13 high school
students were threatened or
injured with a weapon at school
The proportion of students reporting
weapon-related threats or injuries at
school during the year was 7% in 2019.
Percent of students threatened or injured
with a weapon at school in the past year:
Demographic Total Male Female
Total 7.4% 8.0% 6.5%
9th grade 8.1 8.9 7.2
10th grade 8 8.3 7.3
11th grade 7.1 8.6 5.3
12th grade 5.9 5.9 5.7
White* 7.1 7.6 6.4
Black* 8.8 10.2 7.2
Hispanic 6.9 7.3 6.4
American Indian* 12.6 N/A N/A
Asian* 3.2 4.7 1.6
Multiple race* 11.4 12.2 10.6
* Excludes persons of Hispanic ethnicity.
In 2019, male high school students reported carrying a weapon at
least one day in the past month at higher rates than females, and
White students reported carrying a weapon at higher rates than
Black, Hispanic, and Asian youth
Percentage of students reporting activity:
Demographic
Carried
a weapon
Carried a weapon
on school property
Carried
a gun
Total 13.2% 2.8% 4.4%
Male 19.5 3.7 6.7
Female 6.7 1.7 2.0
9th grade 12.5 2.0 3.9
10th grade 12.2 2.2 4.4
11th grade 12.9 3.3 4.5
12th grade 14.9 3.3 4.7
White 15.0 2.1 3.3
Black/African American 9.4 4.2 7.1
Hispanic/Latino 11.7 3.1 5.6
American Indian/
Alaska Native NA 10.8 NA
Asian 5.2 1.3 0.9
Native Hawaiian/
Other Pacific Islander NA NA NA
Multiple race 17.5 3.3 5.7
Q Male high school students were more likely to report carrying a weapon than
females (19.5% vs. 6.7%) and were more likely to carry a weapon on school
property (3.7% vs. 1.7%) in 2019.
Q White (15.0%) students were more likely than their Hispanic (11.7%), Black
(9.4%), and Asian (5.2%) peers to carry a weapon in the last 30 days. However,
American Indian/Alaskan Native youth were more likely than white, Hispanic,
and Asian youth to report carrying a weapon on school property in the last 30
days.
Q High school juniors and seniors were more likely to report carrying a weapon in
the past 30 days than high school freshman.
Q Males (6.7%) were more likely than females (2.0%) to report carrying a gun in
the past 12 months, and Black (7.1%), Hispanic (5.6%) and white (3.3%) stu-
dents were more likely to report carrying a gun than Asian (0.9%) students.
NA = Too few respondents to develop a reliable estimate.
Notes: Race categories exclude persons of Hispanic ethnicity. Persons of Hispanic ethnicity can
be of any race. Respondents were asked to consider the last 30 days when reporting whether
they had 1) carried a weapon or 2) carried a weapon on school property, and the last 12 months
when reporting about carrying a gun (which did not include days when the youth carried a gun
solely for hunting or for a sport). Weapon includes a gun, knife, or club.
Source: Author’s adaptation of Centers for Disease Control and Prevention’s
1991–2019 High
School Youth Risk Behavior Survey Data
.

Youth and the Juvenile Justice System: 2022 National Report
56
Overall, males were more likely than
females to report being threatened or
injured at school while Asian youth
were less likely than White, Black, or
Hispanic students to report being
threatened or injured.
Fear of school-related crime kept
9 in 100 high schoolers home at
least once in the past month
Nationwide in 2019, 9% of high school
students missed at least 1 day of school
in the past 30 days because they felt
unsafe at school or when traveling to
or from school, up from 6% in 2011.
Females were more likely than males to
miss school because of safety concerns.
Regardless of gender, Hispanic stu-
dents were more likely than White stu-
dents to have missed school because
they felt unsafe. Black males were more
like than White males to stay home,
while there was no statistically signifi-
cant difference between Black and
White females.
1995 1999 2003 2007 2011 2015 2019
0%
5%
10%
15%
20%
25%
Percent of high school students reporting activity in past 30 days
Carried a weapon on school property
Carried a weapon
In 2019, about 1 in 8 (13%) high school students said they carried a
weapon in the past 30 days, down from more than 1 in 5 (22%) in 1993
Q Roughly 1 in 35 (3%) high school students reported carrying a weapon on school
property in 2019, down from about 1 in 8 (12%) in 1993.
Notes: For each behavior, respondents were asked if they had done so at least one day in the past 30
days. Weapon includes a gun, knife, or club.
Source: Authors’ adaptation of Centers for Disease Control and Prevention’s
1991–2019 High School
Youth Risk Behavior Survey Data
.
Percent of students who felt too unsafe
to go to school in the past month:
Demographic Total Male Female
Total 8.7% 7.5% 9.8%
9th grade 8.8 7.6 10.0
10th grade 8.1 7.1 9.2
11th grade 9.5 8.1 10.7
12th grade 8.1 7.0 8.8
White* 6.7 5.2 8.1
Black* 11.5 12.2 10.8
Hispanic 10.9 9.9 11.8
American Indian* 24.7 N/A N/A
Asian* 5.1 4.9 5.4
Multiple race* 11.1 8.1 13.7
* Excludes persons of Hispanic ethnicity.
More than 1 in 5 high school
students were in a physical fight—
2 in 25 were in a fight at school
In 2019, 22% of high school students
said they had been in one or more
physical fights during the past 12
months, and 8% reported being in a
fight at school. This is down 11 per-
centage points from the 2011 survey.
Regardless of grade level or race/eth-
nicity, males were more likely than fe-
males to engage in fighting.
Percent of students who were in a physi-
cal fight in the past year:
Demographic Total Male Female
Total 21.9% 28.3% 15.3%
9th grade 25.8 32.3 18.6
10th grade 23.3 29.2 17.3
11th grade 20.0 26.7 13.4
12th grade 17.6 24.2 10.9
White* 19.8 26.6 12.7
Black* 30.2 36.9 22.7
Hispanic 22.6 27.7 17.8
American Indian* 40.2 N/A N/A
Asian* 12.0 17.6 6.1
Multiple race* 28.7 40.6 18.3
* Excludes persons of Hispanic ethnicity.
Regardless of gender, fighting was
more common among Black students
than White students. Hispanic females
were more likely than their white peers
to be involved in a fight, however there
was no difference between Hispanic
males and their white counterparts.
Nationwide, 8% of high school stu-
dents had been in a physical fight on
school property one or more times in
the 12 months preceding the survey,
down from 12% in 2011. Male stu-
dents were substantially more likely to
fight at school than female students at
all grade levels and across racial/ethnic
groups. Regardless of gender, Black
students were more likely to fight at
school than White students. Hispanic
females were more likely to fight than
their White counterparts.
Percent of students who were in a physi-
cal fight on school property in the past
year:
Demographic Total Male Female
Total 8.0% 11.4% 4.4%
9th grade 11.0 15.8 5.6
10th grade 8.3 11.4 5.1
11th grade 6.4 9.2 3.5
12th grade 5.8 8.5 2.8
White* 6.4 10.2 2.2
Black* 15.5 18.8 11.7
Hispanic 7.8 10.2 5.6
American Indian* 18.9 N/A N/A
Asian* 4.9 6.8 3.0
Multiple race* 11.0 17.6 4.5
* Excludes persons of Hispanic ethnicity.

Chapter 3: Offending by youth
57
Across reporting states, the proportion of high school students who
carried a weapon on school property in 2019 ranged from 1%
(Pennsylvania) to about 9% (Alaska)
Percent reporting they carried a
weapon on school property
in the last 30 days
Percent reporting they were
threatened or injured with a
weapon on school property
in the last year
State Total Male Female Total Male Female
U.S. total
2.8% 1.7% 3.7% 7.4% 6.5% 8.0%
Alabama
3.8 5.4 1.8 8.2 9.4 6.0
Alaska
8.5 12.0 3.8 NA NA NA
Arizona
3.9 5.1 2.2 6.7 8.5 4.4
Arkansas
5.3 6.9 3.3 8.1 7.5 8.3
California
2.7 3.1 2.3 12.3 13.9 10.6
Colorado
NA NA NA NA NA NA
Connecticut
3.5 4.6 2.4 6.8 7.4 6.1
Delaware
NA NA NA NA NA NA
Dist. of Columbia
4.9 3.5 6.1 9.4 7.0 11.1
Florida
2.3 3.0 1.4 8.2 9.2 6.9
Georgia
5.2 6.8 3.0 6.0 7.2 3.8
Hawaii
NA NA NA NA NA NA
Idaho
7.1 10.9 3.1 7.9 9.6 6.0
Illinois
2.7 3.4 1.5 8.0 9.6 6.0
Indiana
NA NA NA NA NA NA
Iowa
3.8 5.4 2.1 7.3 8.1 6.0
Kansas
4.2 6.4 1.6 8.2 10.0 5.8
Kentucky
2.7 4.0 0.9 7.1 7.9 5.8
Louisiana
3.8 5.5 1.9 12.4 12.9 10.6
Maine
4.6 6.3 2.3 5.8 6.9 4.3
Maryland
5.7 7.3 3.4 7.8 8.9 5.7
Massachusetts
1.8 2.8 0.7 4.5 5.5 2.9
Michigan
2.5 3.6 1.1 7.4 8.3 6.1
Mississippi
3.4 4.5 2.1 9.8 9.6 9.3
Missouri
4.6 5.9 3.0 NA NA NA
Montana
7.0 10.4 3.3 7.9 10.1 5.2
Nebraska
4.1 5.3 2.2 8.0 7.7 7.9
Nevada
NA NA NA 7.8 8.4 7.0
New Hampshire
2.8 4.0 1.4 6.4 7.0 5.5
New Jersey
2.1 2.4 1.6 7.6 8.9 6.1
New Mexico
4.0 5.2 2.8 NA NA NA
New York
NA NA NA 8.1 10.1 5.3
North Carolina
2.7 2.9 1.9 7.2 8.8 5.1
North Dakota
4.9 6.5 3.0 NA NA NA
Ohio
NA NA NA NA NA NA
Oklahoma
5.2 7.5 2.7 6.1 7.5 4.4
Pennsylvania
1.3 1.5 1.1 7.6 8.6 6.4
Rhode Island
3.7 4.3 2.5 NA NA NA
South Carolina 3.2 4.7 1.6 10.2 12.5 6.7
South Dakota 5.3 7.3 2.6 8.1 8.6 6.8
Tennessee NA NA NA 8.6 10.6 6.5
Texas 3.3 4.5 2.1 6.7 7.3 5.7
Utah 6.9 9.8 3.9 6.5 9.2 3.8
Vermont 4.9 7.1 2.6 7.0 7.6 6.3
Virginia 2.1 2.8 1.4 7.9 9.0 6.7
West Virginia 2.8 4.2 1.2 7.5 7.6 6.6
Wisconsin NA NA NA 7.2 8.1 5.9
Median 3.8 5.2 2.2 7.7 8.6 6.0
NA = Data not available.
Notes: Weapon incudes a gun, knife, or club. Totals include responses from students for whom gender
was unknown. Minnesota, Oregon, Washington, and Wyoming did not participate in the data collection.
Source: Authors’ adaptation of the Centers for Disease Control and Prevention’s
1991–2019 High School
Youth Risk Behavior Survey Data
.
Most teens report concern
about school shootings
According to the National Center for
Education Statistics, 453 school
shootings occurred at K-12 schools
in the U.S. between the 2009–10
and 2018–19 school years. More
than 4 in 10 (45%) incidents result-
ed in injuries but no deaths, 30%
resulted in fatalities, and 25% re-
sulted in no injury or deaths. The
453 school shooting incidents pro-
duced 649 casualties (persons in-
jured or killed in the course of the
shooting), one-third (33%) of which
were fatalities (including the death
of the shooter); the remaining casu-
alties involved injuries. The majority
(62%) of school shootings occurred
at high schools, 22% at elementary
schools, and 12% at middle
schools.
A 2018 survey of high school stu-
dents conducted by the PEW Re-
search Center found that more than
half (57%) of youth ages 13–17
stated they were either “very wor-
ried” (25%) or “somewhat worried”
(32%) that a shooting may occur at
their school. Nearly three-quarters
(73%) of Hispanic and 6 in 10 (60%)
of Black youth expressed such con-
cern, compared with half (51%) of
White youth; nearly two-thirds
(64%) of females were concerned a
shooting may occur at their school,
compared with half (51%) of boys.

Youth and the Juvenile Justice System: 2022 National Report
58
In 2019, nearly half of high school seniors reported they had
used an illicit drug at least once—more had used alcohol
The Monitoring the Future Study
tracks the drug use of secondary
school students
Each year, the Monitoring the Future
(MTF) Study asks a nationally repre-
sentative sample of more than 40,000
secondary school students in nearly
400 public and private schools to de-
scribe their drug use patterns through
self-administered questionnaires. Sur-
veying seniors since 1975, the study
expanded in 1991 to include 8th and
10th graders. By design, MTF excludes
dropouts and institutionalized, home-
less, and runaway youth.
Marijuana is the most commonly
used illicit drug among students
In 2019, nearly half (47%) of high
school seniors said they had at least
tried illicit drugs in their lifetime (in-
cluding marijuana), as did nearly four
in ten (37%) 10th graders and one in
five (20%) 8th graders. Marijuana is by
far the most commonly used illicit
drug, and influences the proportion of
students reporting illicit drug use. In
2019, 44% of high school seniors said
they had tried marijuana, as did 34% of
10th graders and 15% of 8th graders.
The prevalence of illicit drug use falls
considerably when marijuana is re-
moved: in 2019, 18% of seniors, 14%
of 10th graders, and 11% of 8th grad-
ers reported using an illicit drug other
than marijuana in their lifetime.
More than one-third (36%) of high
school seniors had used marijuana in
the past year, and 22% used it in the
previous month. MTF also asked stu-
dents if they had used marijuana on 20
or more occasions in the previous 30
days (daily use). In 2019, 6% of high
school seniors reported daily use of
marijuana.
In 2019, 8% of high school seniors re-
ported using amphetamines at least
once, making amphetamines the sec-
ond most prevalent illicit drug after
marijuana. Two percent of seniors re-
ported using amphetamines in the past
month. Hallucinogens and tranquiliz-
ers were the next most prevalent drugs
after amphetamines, with 7% and 6%,
respectively, of seniors reporting use at
least once in their lifetime. A small
proportion of seniors reported using
hallucinogens (2%) or tranquilizers
(1%) in the past month.
In 2019, 4% of seniors said they had
used cocaine at least once in their life.
Half of this group (2% of all seniors)
said they used it in the previous year,
and less than one-quarter of users (1%
of seniors) had used it in the preceding
30 days. About 2% of seniors reported
previous use of crack cocaine: 1% in
the previous year, and less than 1% in
the previous month. Heroin was the
least commonly used illicit drug, with
less than 1% of seniors reporting they
had used it at least once. More than
half of seniors who reported heroin use
said they used it only without a needle.
Alcohol use and vaping nicotine
are widespread at all grade levels
In 2019, nearly 6 in 10 (58%) high
school seniors said they had tried alco-
hol at least once, and nearly three in
ten (29%) said they used it in the pre-
vious month. Even among 10th grad-
ers, the use of alcohol was common:
48% had tried alcohol and almost one-
fifth used it in the month prior to the
survey.
More high school seniors report daily use of marijuana than alcohol
or cigarettes
Proportion of seniors in 2019 who used
Substance in lifetime in last year in last month daily*
Alcohol 58.5% 52.1% 29.3% 1.7%
Been drunk 40.8 32.8 17.5 1.1
Cigarettes 22.3 NA 5.7 2.4
Vaping nicotine 40.8 35.3 25.5 11.6
Any illicit drug** 47.4 38.0 23.7 NA
Marijuana/hashish 43.7 35.7 22.3 6.4
Vaping marijuana 23.7 20.8 14.0 3.5
Amphetamines 7.7 4.5 2.0 0.3
Hallucinogens 6.9 4.6 1.8 0.1
Tranquilizers 6.1 3.4 1.3 0.1
LSD 5.6 3.6 1.4 0.1
Narcotics, not heroin 5.3 2.7 1.0 0.1
Inhalants 5.3 1.9 0.9 0.1
Sedatives 4.2 2.5 1.2 0.1
Cocaine 3.8 2.2 1.0 0.1
MDMA (ecstasy, molly) 3.3 2.2 0.7 0.1
Crack cocaine 1.7 1.0 0.7 0.2
Steroids 1.6 1.0 0.7 0.2
Methamphetamine 0.8 0.5 0.3 0.1
Crystal methamphetamine 1.3 0.6 0.4 0.1
Heroin 0.6 0.4 0.3 0.1
Q More than 1 in 4 seniors report vaping nicotine at least once in the past month,
and more than 1 in 10 do so on a daily basis.
NA = Not included in the survey.
* Used on 20 or more occasions in the last 30 days or had 1 or more cigarettes per day in the last
30 days.
** Including marijuana
Source: Author’s adaptation of Miech et al’s
Monitoring the Future National Survey Results on
Drug Use, 1975–2019, Volume 1: Secondary Students
.

Chapter 3: Offending by youth
59
MTF also asks youth about heavy
drinking (defined as five or more
drinks in a row) in the preceding 2
weeks. Fourteen percent (14%) of se-
niors, 9% of 10th graders, and 4% of
8th graders reported recent heavy
drinking.
Information about vaping was added
to the MTF survey in 2017. In 2017,
one in four (25%) seniors said they had
tried vaping nicotine at least once.
That proportion grew and in 2019,
vaping nicotine was the most likely
substance to be used by students on a
daily basis. In 2019, 41% of 12th grad-
ers, 37% of 10th graders, and 20% of
8th graders had tried vaping nicotine,
and 26% of seniors, 20% of 10th grad-
ers, and 10% of 8th graders vaped nic-
otine in the preceding month. In addi-
tion, 12% of seniors, 7% of 10th
graders, and 2% of 8th graders report-
ed currently vaping nicotine daily.
While vaping nicotine has been on the
rise, the prevalence of cigarette use has
decreased since the 1990s. In 1997,
65% of seniors said they tried ciga-
rettes; that proportion fell to 22% by
2019. Similarly, 25% of seniors, 18% of
10th graders, and 9% of 8th graders re-
ported smoking cigarettes daily in
Vaping use rose quickly and
substantially
The two largest single year increas-
es in substance use recorded by
MTF involve vaping. The 9.9 per-
centage point increase in past
month vaping nicotine by seniors
between 2017 and 2018 was the
largest one-year increase in the his-
tory of MTF, and the 6.5 percentage
point increase in past month vaping
of marijuana between 2018 and
2019 was the second largest one-
year increase. Across grade levels,
past month vaping of nicotine and
marijuana increased annually since
2017.
Past month vaping use:
Grade/
substance 2017 2018 2019
8th grade
Nicotine 3.5% 6.1% 9.6%
Marijuana 1.6 2.6 3.9
10th grade
Nicotine 8.2 16.1 19.9
Marijuana 4.3 7.0 12.6
12th grade
Nicotine 11.0 20.9 25.5
Marijuana 4.9 7.5 14.0
1997; those proportions decreased to
2% for seniors, 1% each for 10th and
8th graders in 2019.
Prevalence rates for most drugs
were similar for males and
females
Among seniors, 30% of males and 28%
of females in 2019 reported alcohol
use in the past 30 days, and 16% of
males and 12% of females said they had
five or more drinks in a row in the pre-
vious 2 weeks. Males were twice as
likely as females to report daily alcohol
use (2% vs. 1%).
Males were equally as likely as females
to have used marijuana in the previous
year (35% each) but more likely in the
previous month (23% vs. 21%), and
For most drugs, a larger proportion of males reported use than
females, and a larger proportion of White youth reported use than
Black or Hispanic youth
Proportion of seniors reporting use
Reference period/
substance Male Female White Black
Asian/
Pacific
Islander
Past month
Alcohol 29.8% 28.5% 34.9% 19.4% 24.4%
Been drunk 17.2 17.4 21.9 10.5 11.6
Marijuana/hashish 23.0 21.1 21.3 23.8 20.4
Vaping marijuana 14.7 13.0 13.9 8.0 14.0
Cigarettes 6.9 4.0 7.9 3.2 4.5
Vaping nicotine 28.1 22.9 32.4 10.1 13.9
Past year
Any illicit drug use* 37.5 37.7 38.1 38.3 35.9
Marijuana/hashish 35.2 35.5 35.6 35.7 33.4
Amphetamines 4.9 3.8 5.7 2.7 3.6
Hallucinogens 6.1 2.7 4.5 1.9 4.0
Tranquilizers 3.2 3.4 4.0 2.3 3.0
LSD 4.9 2.1 3.4 1.6 3.2
Narcotics, not heroin 3.4 1.8 3.3 1.7 2.5
Inhalants 2.2 1.5 1.8 1.9 1.3
Sedatives 2.5 2.3 2.6 2.0 2.4
Cocaine 2.6 1.7 2.2 0.9 2.7
MDMA (ecstasy, molly) 1.2 1.0 0.9 0.2 1.5
Steroids 1.4 0.6 0.8 1.8 1.4
Methamphetamine 0.7 0.2 0.4 0.6 0.5
Crystal methamphetamine 0.7 0.4 0.3 1.5 0.6
Heroin 0.5 0.2 0.2 0.7 0.5
* Including marijuana
Notes: Race categories exclude persons of Hispanic ethnicity. Male and female proportions are for
2019. Race proportions are for the current year and the prior year (2019 and 2018) to increase the
subgroup sample size and provide more stable estimates.
Source: Author’s adaptation of Johston et al’s Demographic Subgroup Trends Among Adolescents
in the Use of Various Licit and Illicit drugs, 1975–2019
,
Monitoring the Future Occasional Paper No. 94
.

Youth and the Juvenile Justice System: 2022 National Report
60
daily during the previous month (8%
vs. 5%).
The proportions of male and female
high school seniors reporting overall
use of illicit drugs other than marijuana
in the previous year were also similar
(12% and 10%), but there are variations
across drugs. The annual prevalence
rate for methamphetamines among
12th grade males was more than three
times the rate for 12th grade females,
while the male rates for hallucinogens,
LSD, heroin, OxyContin, Ritalin, ro-
hypnol, and steroids were more than
twice the rates for females.
Black high school seniors had
lower tobacco, alcohol, and drug
use rates than their White or
Hispanic peers
In 2019, 10% of Black seniors said they
had vaped nicotine in the past 30 days,
compared with 32% of White seniors
and 14% of Hispanic seniors. Similarly,
past month cigarette use was lower for
Black seniors (3%) than either Hispanic
(4%) or White (8%) seniors. About
one-fifth (19%) of Black seniors report-
ed alcohol use in the past 30 days,
compared with 35% of White seniors
and 24% of Hispanic seniors. White se-
niors were more than twice as likely as
Black seniors to have been drunk in
the past month (22% vs. 10%), and
nearly twice as likely as Hispanic se-
niors (12%).
For nearly all drugs, Black seniors re-
ported lifetime, annual, 30-day, and
daily prevalence rates that were lower
than those of their White and Hispanic
counterparts. For example, in 2019,
annual prevalence rates for hallucino-
gens, LSD, cocaine, and ecstasy among
White and Hispanic seniors were at
least two times the rates for Black se-
niors, and amphetamine use among
White seniors was twice that of their
Black peers. Conversely, past month
marijuana use was higher among Black
seniors (24%) than white (21%) or His-
panic (20%) seniors, as were annual
prevalence rates for steroids, metham-
phetamine, crystal methamphetamine,
and heroin.
More than 1 in 5 high school
students were offered, sold, or
given an illegal drug at school
According to the 2019 Youth Risk Be-
havior Surveillance Survey, 22% of high
school students said they were offered,
sold, or given an illegal drug on school
property at least once during the past
12 months. The proportion was signif-
icantly higher for freshman males than
their female counterparts, and the pro-
portions for Black, Hispanic, and
mixed race males were significantly
higher than the proportion for White
males. Overall, Asian students were
least likely to report being offered,
sold, or given illegal drugs on school
property than students of other races.
Percent of students who were offered,
sold, or given illegal drugs on school
property in the past 12 months, 2019:
Demographic Total Male Female
Total 21.8% 22.8% 20.8%
9th grade 21.6 23.8 19.2
10th grade 23.7 25.1 22.1
11th grade 22.0 21.2 22.6
12th grade 19.6 20.6 18.6
White* 19.8 20.6 19.0
Black* 21.5 26.0 16.7
Hispanic 26.7 26.0 27.2
American Indian* 24.2 NA NA
Asian* 14.5 15.6 13.2
Mixed race* 27.8 31.8 24.3
* Excludes persons of Hispanic ethnicity.
NA = Too few respondents to develop an
estimate.
About 1 in 7 high school students tried alcohol before age 13 and
about 1 in 17 tried marijuana
Percent who had used before age 13
Alcohol Marijuana
Demographic Total Male Female Total Male Female
Total
15.0% 16.9% 13.0% 5.6% 7.2% 4.0%
9th grade
18.7 20.1 17.4 6.0 7.2 4.8
10th grade
15.4 17.1 13.6 5.7 7.4 4.1
11th grade
13.3 14.9 11.6 6.0 8.2 3.8
12th grade
11.9 14.9 8.6 4.4 5.8 2.9
White*
13.0 15.3 10.6 4.6 5.9 3.2
Black*
17.4 20.7 13.9 8.3 11.0 5.4
Hispanic
18.4 20.3 16.4 6.3 7.9 4.8
American Indian*
18.7 NA NA 12.6 NA NA
Asian*
8.4 8.7 8.2 1.1 1.1 1.0
Mixed race*
16.2 13.7 18.5 9.7 12.9 6.7
Q Regardless of grade, males were significantly more likely than females to report
marijuana use before age 13.
Q Overall, Black and Hispanic high school students were significantly more likely
to report alcohol and marijuana use before age 13 than were White students.
NA = Too few respondents to develop an estimate.
* Excludes persons of Hispanic ethnicity.
Source: Authors’ adaptation of the Centers for Disease Control and Prevention’s
1991–2019 High School
Youth Risk Behavior Survey Data
.
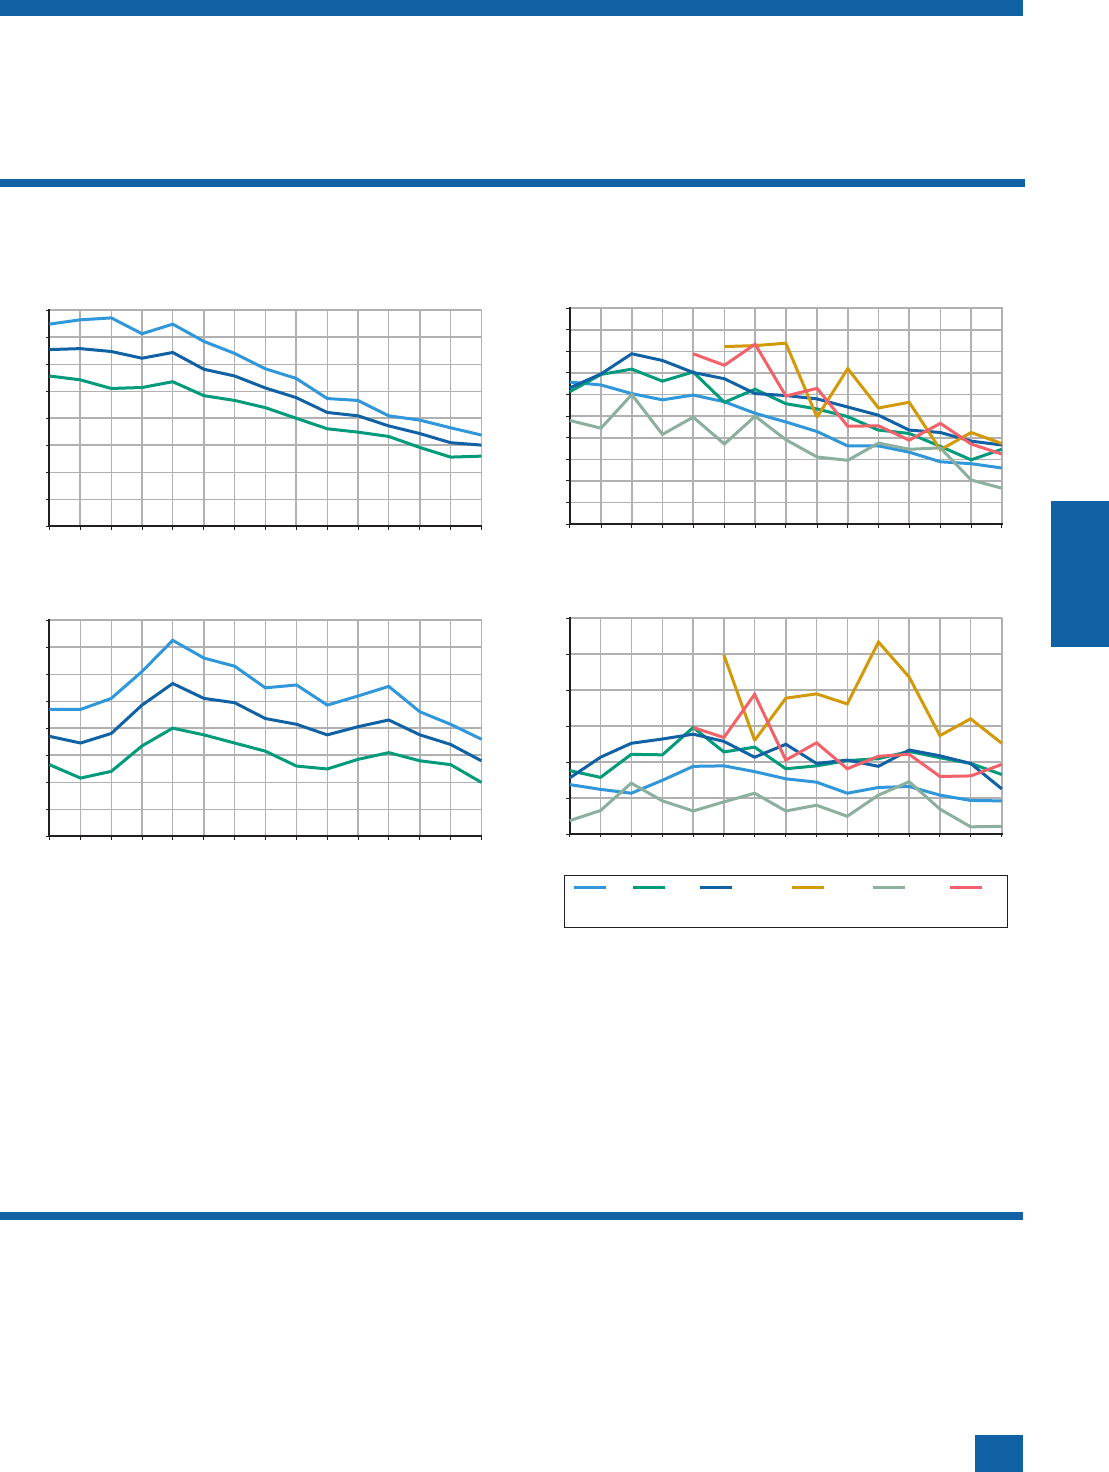
Chapter 3: Offending by youth
61
1991 1995 1999 2003 2007 2011 2015 2019
0%
10%
20%
30%
40%
Percent of high school students who tried for the
first time before age 13
Male
Total
Alcohol
Female
Q A smaller proportion of students are trying alcohol or marijuana prior to entering high school. In 1991, 33% of high school stu-
dents indicated they tried alcohol for the first time before they were 13 years old. By 2019, this proportion was cut in half, as 15%
of high school students indicated they had tried alcohol before age 13.
Q Onset of marijuana use followed a similar pattern. The proportion of high school students who tried marijuana before age 13
reached a peak in 1999, when 11% of high school students reported they had tried marijuana for the first time before age 13. By
2019, 6% of high school students reported they had tried marijuana for the first time before age 13.
Notes: Racial groups exclude persons of Hispanic ethnicity. Hispanic youth can be of any race. Native Hawaiian and Other Pacific Islanders were included in
the Asian category prior to 1999. Due to a small number of sample respondents, estimates for Native Hawaiian and Other Pacific Islander youth are not avail-
able after 1998. The mixed race category was not introduced until 1999. Due to a small number of sample respondents, estimates for American Indian/Alas-
kan Native youth were not available prior to 2001.
Source: Authors’ adaptation of the Centers for Disease Control and Prevention’s
1991–2019 High School Youth Risk Behavior Survey Data
.
The proportion of high school students who first tried alcohol or marijuana before age 13 has been on the
decline
1991 1995 1999 2003 2007 2011 2015 2019
0%
10%
20%
30%
40%
50%
Percent of high school students who tried
for the first time before age 13
Alcohol
1991 1995 1999 2003 2007 2011 2015 2019
0%
4%
8%
12%
16%
Percent of high school students who tried for the
first time before age 13
Male
Total
Marijuana
Female
1991 1995 1999 2003 2007 2011 2015 2019
0%
5%
10%
15%
20%
25%
30%
Percent of high school students who tried
for the first time before age 13
Marijuana
White Black Hispanic Amer. Indian/ Asian Mixed race
Alaskan Native

Youth and the Juvenile Justice System: 2022 National Report
62
Use of illicit drugs other than marijuana has been on the
decline, as has use of alcohol and cigarettes
75 79 83 87 91 95 99 03 07 11 15 19
0%
10%
20%
30%
40%
Percent of students reporting past month use
12th graders
8th graders
10th graders
Marijuana
Year
Q Use of illicit drugs other than marijuana reported by 8th graders declined since the mid-1990s to reach a historic low in 2012; by
2019, the proportion of 8th graders reporting illicit drug use was about 1% above the 2012 low point. Similarly, illicit drug use re-
ported by 10th and 12th graders declined since the mid-1990s; by 2019, the proportion of 10th and 12th graders reporting illicit
drug use reached a historic low, 4% and 5%, respectively.
Q While use of illicit drugs other than marijuana has declined, past month use of marijuana, the most widely used illicit drug, has in-
creased in recent years particularly among older students. For example, the proportion of 10th and 12th graders reporting past
month marijuana use increased 4 percentage points between 2006 and 2019. Among 8th graders, it was about the same in 2019
as in 2006.
Q In 2019, the proportion of 12th graders who reported past month marijuana use was more than four times the proportion who re-
ported past month use of illicit drugs (22% vs. 5%) but below the proportion who reported past month alcohol use (29%).
Q For all three grades, past-month alcohol use fell steadily since the mid-1990s. The proportion of 10th and 12th graders reporting
past month alcohol use reached a new low in 2019, while the proportion of 8th graders reporting past month alcohol use reached
a low in 2017 and remained relatively steady through 2019.
Q Similar to the trend in alcohol, past month cigarette use has declined for each grade since the mid-1990s. By 2019, the propor-
tion of 10th and 12th graders reporting cigarette use reached an all-time low, while the proportion of 8th graders reporting ciga-
rette use was about one-half of 1% above the 2017 low point. One caveat, however, is that while traditional cigarette use has de-
clined, the proportion of students vaping nicotine has increased. For each grade, the proportion of students vaping nicotine in the
past month more than doubled between 2017 and 2019.
Source: Authors’ adaptation of Miech et al.’s
Monitoring the Future National Survey on Drug Use, 1975–2019. Volume I: Secondary School Students
.
Unlike marijuana use, the proportion of 10th and 12th graders reporting alcohol, cigarette, and illicit drug use
reached historic lows in 2019
75
0%
5%
10%
15%
20%
25%
Percent of students reporting past month use
12th graders
8th graders
10th graders
Any illicit drug except marijuana
79 83 87 91 95 99 03 07 11 15 19
Year
0%
20%
40%
60%
80%
Percent of students reporting past month use
12 graders
8th graders
10th graders
Alcohol
75 79 83 87 91 95 99 03 07 11 15 19
Year
0%
10%
20%
30%
40%
Percent of students reporting past month use
12th graders
8th graders
10th graders
Cigarettes
75 79 83 87 91 95 99 03 07 11 15 19
Year

Chapter 3: Offending by youth
63
Change in students’ use of
marijuana and alcohol is tied to
their perception of possible harm
from use
The annual Monitoring the Future
Study, in addition to collecting infor-
mation about students’ use of illicit
drugs, alcohol, and tobacco, also col-
lects data on students’ perceptions re-
garding the availability of these sub-
stances and the risk of harm from using
them.
Between 1975 and 2019, the propor-
tion of high school seniors reporting
use of marijuana in the 30 days prior
to the survey fluctuated, peaking in
1978 and then declining consistently
through 1992. After that, reported use
increased through 1997, declined
through 2006, and generally increased
through 2019. When the perceived risk
of harm (physical or other) from either
regular or occasional use increased,
marijuana use declined; when perceived
risk declined, use increased. The per-
ception that obtaining marijuana was
“fairly easy” or “very easy” declined
from 90% in 1998 to 78% in 2019.
Students’ reported use of alcohol and
perceptions of risk also shifted from
1975 to 2019. After 1978, alcohol use
declined through the early 1990s, rose
slightly through 1997, and then de-
clined steadily to reach a historic low
(29%) in 2019. As with marijuana,
when the perceived risk of harm from
weekend “binge” drinking increased,
past month alcohol use declined; when
perceived risk declined, use generally
increased. Over the past 20 years, the
proportion of seniors reporting that al-
cohol was “fairly easy” or “very easy”
to obtain declined.
75 79 83 87 91 95 99 03 07 11 15 19
0%
20%
40%
60%
80%
100%
Percent of seniors
Perceived risk
Past month use
Perceived availability
Marijuana
Year
While perceived availability of marijuana and alcohol stayed within a
limited range, changes in use reflected changes in perceived harm
Perceived availability: Percent saying fairly easy or very easy to get.
Perceived risk: Percent saying great risk of harm in having five or more drinks in a row
once.
Past month use: Percent using once or more in the past 30 days. (The survey question
on alcohol use was revised in 1993 to indicate that a “drink” meant “more than a few
sips”).
Source: Authors’ adaptation of Miech et al.’s
Monitoring the Future National Survey on Drug Use,
1975–2019. Volume I: Secondary School Students
.
0%
20%
40%
60%
80%
100%
Percent of seniors
Past month use
Perceived risk
Perceived availability
Alcohol
75 79 83 87 91 95 99 03 07 11 15 19
Year
Perceived availability: Percent saying fairly easy or very easy to get.
Perceived risk: Percent saying great risk or harm in regular use.
Past month use: Percent using once or more in the past 30 days.

Youth and the Juvenile Justice System: 2022 National Report
64
Serious violent crimes committed by youth declined
substantially since the mid-1990s
National survey collects data on
victims of crime and the assailant
The National Crime Victimization Sur-
vey (NCVS) asks a nationally represen-
tative sample of persons ages 12 and
older about crimes in which they were
the victim. Administered by the Bu-
reau of Justice Statistics, NCVS is the
primary source of information on the
characteristics of nonfatal criminal vic-
timizations and on the number and
types of crimes not reported to law en-
forcement. Violent crimes captured by
NCVS include rape/sexual assault,
robbery, aggravated assault, and simple
assault.
While NCVS focuses on victims, it also
collects information about the alleged
perpetrator in crimes reported by vic-
tims. As a result, NCVS data can be
used to monitor trends in offending by
youth ages 12–17.
Serious violent crime committed
by youth peaked in 1993
NCVS self-report data for rape/sexual
assault, robbery, and aggravated assault
are often combined with data from the
FBI’s Supplementary Homicide Re-
ports, which reports murders commit-
ted, to monitor trends in serious vio-
lent crime—murder, rape/sexual
assault, robbery, and aggravated as-
sault. The number of serious violent
crimes committed by youth ages
12–17 peaked at 1.1 million in 1993;
in that year, more than one-fourth
(26%) of all serious violent crimes were
committed by youth ages 12–17. By
2019, youth ages 12–17 were involved
in 146,000 serious violent crimes—
about one-tenth (9%) of all serious vio-
lent crimes in that year—and the rate
in 2019 was 87% below the 1993 peak.
80 83 86 89 92 95 98 01 04 07 10 13 16 19
0
10
20
30
40
50
60
Year
Victimizations by youth ages 12−17 (per 1,000 youth ages 12−17)
Serious violent crime rate
The rate at which youth ages 12–17 committed serious violent crimes
peaked in 1993 then generally declined through 2019
Q The proportion of serious violent crimes committed by youth ages 12–17 peaked in
1993 at 26%, then decreased to 11% in 2011. The proportion increased in 2013
before decreasing to the lowest level in 2019. In 2019, 9% of all serious violent vic-
timizations were committed by youth ages 12 to 17.
Q The proportion of serious violent victimizations involving multiple youth ages 12–17
ranged from a high of 65% in 1982 to a low of 30% in 2019.
Notes: Serious violent crime includes aggravated assault, rape, and robbery reported to the NCVS that
involved at least one offender perceived by the victim to be 12–17 years of age, plus the number of
homicides reported to the police that involved at least one perpetrator age 12–17. Homicide data were
not available for 2019 at the time of publication; therefore, the number of homicides for 2018 is includ-
ed in the overall total for 2019. Due to a sample increase and redesign in 2016, estimates in 2016 are
not comparable to estimates for other years. Due to methodological changes in the 2006 National
Crime Victimization Survey, use caution when comparing 2006 criminal perpetration estimates to those
for other years. Because of changes made in the victimization survey, data prior to 1992 are adjusted
to make them comparable with data collected under the redesigned methodology.
Source: Authors’ adaptation of the Federal Interagency Forum on Child and Family Statistics’
America’s
Children:Key National Indicators of Well-Being
.Table BEH5.
0%
5%
10%
15%
20%
25%
30%
Percent of victimizations by youth ages 12−17
Serious violent crime
80 83 86 89 92 95 98 01 04 07 10 13 16 19
Year
Q
The rate at which youth ages 12–17 committed serious violent crimes increased
49% from 1980 to its 1993 peak, then decreased 78% from 1993 to 2002. The rate
increased slightly through 2006, then generally declined. The rate in 2019 was 66%
below the 2006 rate.

Chapter 3: Offending by youth
65
After reaching a historic low in 2013, the number of
homicides by youth increased 27% through 2019
More than 1 of every 3 murders
in the U.S. are not solved
In 2019, the FBI reported that 16,400
persons were murdered in the U.S. In
an estimated 10,100 (61%) of these
murders, the incident was cleared by
arrest or by exceptional means—that is,
either a person was arrested and turned
over to the court for prosecution or
was identified but law enforcement
could not place formal charges (e.g.,
death of the perpetrator). In the re-
maining 6,300 murders (36%) in 2019,
law enforcement did not identify who
committed the crime and their demo-
graphic characteristics are not known.
Estimating the demographic character-
istics of these unknown individuals is
difficult. Their attributes likely differ
from those known to have committed
murder. For example, it is likely that a
greater proportion of those known to
law enforcement have family ties to
their victims and that a larger propor-
tion of homicides committed by
strangers go unsolved. An alternative
to estimating characteristics of those
responsible for unattributed murders is
to trend only murders committed by
known individuals. Either approach
creates its own interpretation prob-
lems. In this section, all analyses of the
FBI’s
Supplementary Homicide Re-
ports
(SHR) focus solely on individuals
known to have committed a murder
and, therefore, juveniles known to have
committed a murder.
Juveniles were involved in 1 in 14
homicides in 2019
Youth under the age of 18 were in-
volved in an estimated 780 murders in
the U.S. in 2019—7% of all murders.
In half of these murders (50%), the ju-
venile acted alone, in 11% they acted
with one or more other youth, and in
39% they acted with at least one adult.
In 2019, 86% of the homicide victims
of juveniles were male, 42% were
80 83 86 89 92 95 98 01 04 07 10 13 16 19
0
500
1,000
1,500
2,000
2,500
Year
Homicide victims of juveniles, known to law enforcement
Juvenile with adult
Multiple juveniles
One juvenile
The number of homicides committed by juveniles reached a historic low
in 2013—74% below the 1994 peak—then increased 27% through 2019
Q In the 1980s, one-fourth (25%) of the murders committed by juveniles also involved
an adult. The proportion grew to 31% in the 1990s, 38% in the 2000s, and reached
41% for the years 2010–2019.
Source: Authors’ analysis of the FBI’s
Supplementary Homicide Reports
for 1980–2019.
80 83 86 89 92 95 98 01 04 07 10 13 16 19
0
200
400
600
800
1,000
1,200
1,400
Year
Homicide victims of juveniles, known to law enforcement
One juvenile
Juvenile acting with others
The number of murders committed by a juvenile acting alone increased
between 2013 and 2019
Q Murders involving a juvenile acting alone peaked in 1993, then fell 79% through
2013. Since reaching this historic low, the number of murders involving a lone juve-
nile increased 36% through 2019.
Q The proportion of murders involving a juvenile acting alone has gradually declined,
from 66% in the 1980s to 59% in the 1990s, and to 50% in the 2010s.
Source: Authors’ analysis of the FBI’s
Supplementary Homicide Reports
for 1980–2019.

Youth and the Juvenile Justice System: 2022 National Report
66
White, and 55% were Black. The over-
whelming majority (88%) of homicide
victims of juveniles were killed with a
firearm. More than half (57%) of the
victims of juveniles were acquaintances,
strangers (i.e., no personal relationship
to the juvenile) accounted for 27% of
victims, and 16% of victims were family
members.
The proportion of murders committed
by a juvenile that involved at least one
other individual gradually increased
since 1980. In the 1980s, about one-
third of all murders committed by ju-
veniles involved at least one other indi-
vidual; this proportion grew to 47% in
the 2000s, and reached 50% in 2019.
The overwhelming majority of murders
committed by juveniles acting with
other individuals involved an adult,
rather than a youth. Between 2010 and
2019, an adult was involved in 81% of
all murders committed by youth that
involved multiple individuals.
Fewer juveniles were involved in
murder in 2019 than in the 1990s
The increase in youth violence through
the mid-1990s resulted in a number of
changes in state legislation that ex-
posed more youth to prosecution in
the adult criminal justice system. Much
of the concern was fueled by the dra-
matic rise in murders committed by
youth between 1984 and 1994. How-
ever, the decade-long increase in homi-
cides committed by youth was fol-
lowed by a long period of decline: the
number of murders committed by
youth fell 72% between 1994 and
2013, reaching its lowest level since at
least 1980. Despite a 27% increase
since 2013, juveniles in 2019 were
considerably less likely to be implicated
in murder than youth in the 1990s: the
number of murders involving youth in
2019 was 66% below the 1994 peak.
0 5 10 15 20 25 30 35 40 45 50 55 60
0
100
200
300
400
500
600
700
Victim age
Homicide victims of juveniles, known to law enforcement, 2010−2019
Any juvenile involved
Only juveniles involved
Juveniles with adults
Between 2010 and 2019, most victims of homicide committed by youth
were under age 25
Q Nearly 6 in 10 (58%) victims of homicide committed by juveniles were under age
25: 24% were under age 18 and 34% were ages 18–24. Conversely, 4% of victims
of homicide committed by juveniles were over age 64.
Source: Authors’ analysis of the FBI’s
Supplementary Homicide Reports
for 2010–2019.
0 5 10 15 20 25 30 35 40 45 50 55 60
0%
5%
10%
15%
20%
25%
30%
Victim age
Percent of all homicide victims in age group, 2010−2019
(with persons responsible known to law enforcement)
Juvenile involved in committing homicde
Between 2010 and 2019, youth age 15 were most likely to be killed by a
youth
Q Among all murder victims between 2010 and 2019, the proportion killed by juve-
niles dropped from 27% for victims age 15 to 3% for victims age 24 and then re-
mained at or near 3% for all victims older than 25.
Source: Authors’ analysis of the FBI’s
Supplementary Homicide Reports
for 2010–2019.
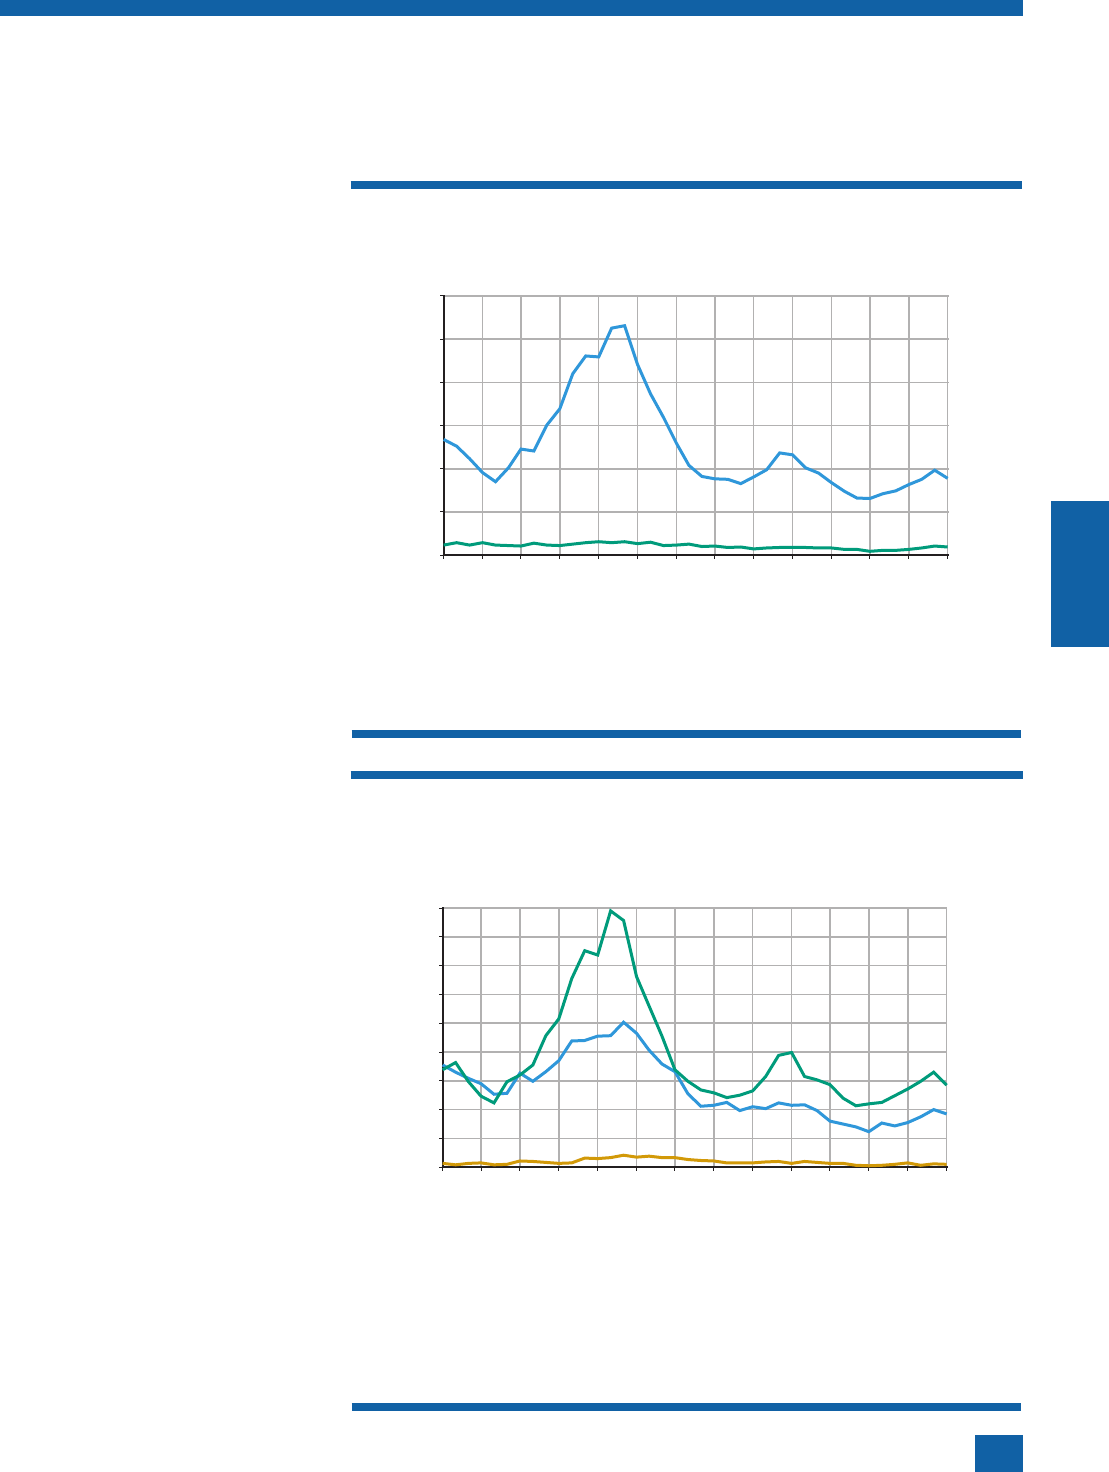
Chapter 3: Offending by youth
67
Trends in murders by juveniles are
driven by several factors
The dramatic rise in murders by juve-
niles between 1984 and 1994 was in-
fluenced by specific types of murders.
Overall, the number of juveniles identi-
fied by law enforcement to have com-
mitted homicide nearly tripled during
this period. However, the number of
male juveniles implicated in homicides
increased more than 200%, while the
number of females increased less than
40%. Firearms also contributed to the
increase: the number of juveniles who
committed murder with a firearm qua-
drupled during this period, while the
number committing murder without a
firearm increased less than 30%. Finally,
the number of juveniles who killed a
family member increased about 20%,
while the number of juveniles who
killed an acquaintance or a stranger
both increased about 220% during this
period.
In short, the historic rise in juvenile
murder offending between 1984 and
1994 was the result of a growth in
murders by male juveniles who com-
mitted their crime with a firearm and
whose victims were nonfamily members.
These factors combined to account for
74% of the increase in homicides by ju-
veniles between 1984 and 1994.
Nearly all of the growth in homicides
committed by juveniles was erased by
the early 2000s, and by 2013, the
number of juveniles known to have
committed homicide reached a historic
low. Two-thirds (66%) of the overall
decline was attributable to the drop in
murders of nonfamily members by ju-
venile males with a firearm.
Since reaching a historic low in 2013,
the number of juveniles known to have
committed homicide increased through
2019, but the increase was not as sub-
stantial as the increase 3 decades prior.
The number of juveniles known to
have committed homicide in 2019 was
40% above the 2013 low-point, and
65% below the 1994 peak.
80 83 86 89 92 95 98 01 04 07 10 13 16 19
0
500
1,000
1,500
2,000
2,500
3,000
Year
Juveniles known by law enforcement to have committed homicide
Male
Female
After reaching a historic low in 2013, the number of known male and
female juveniles who committed homicide increased through 2019
Q While the relative increase in female juveniles who committed homicide outpaced
that of males between 2013 and 2019 (116% vs. 35%), females account for a small
share of juveniles who commit homicide; since 2004, females accounted for 10%
or less of juveniles who committed homicide.
Source: Authors’ analysis of the FBI’s
Supplementary Homicide Reports
for 1980–2019.
80 83 86 89 92 95 98 01 04 07 10 13 16 19
0
200
400
600
800
1,000
1,200
1,400
1,600
1,800
Year
Juveniles known by law enforcement to have committed homicide
Black
White
Other race
Despite recent increases, the number of juveniles who committed
homicide in 2019 was well below the mid-1990s peak for both White
and Black juveniles
Q The number of juveniles who committed homicide peaked in 1993 for Black youth
and 1994 for White youth. Since their respective peaks, the number of juveniles
who committed homicide declined for both race groups through the mid-2010s and
then increased. By 2019, the number of White juveniles who committed homicide
was 51% above their 2013 low point and 63% below the 1994 peak. Similarly, the
number of known Black juveniles who committed homicide in 2019 was 33% above
their 2012 low point and 55% below the 1993 peak.
Source: Authors’ analysis of the FBI’s
Supplementary Homicide Reports
for 1980–2019.

Youth and the Juvenile Justice System: 2022 National Report
68
Compared with the 1994 peak, the
2019 profile of youth known to have
committed homicide included larger
proportions of females and White
youth. Additionally, a larger proportion
of juveniles used a firearm in 2019
than in 1994, and a larger proportion
of victims were either family members
or acquaintances.
Profile of juveniles known by law enforce-
ment to have committed homicide:
Characteristic 2013 2019
Age 100% 100%
Younger than 15 11 12
Age 15 14 17
Age 16 26 28
Age 17 50 43
Gender 100% 100%
Male 94 91
Female 6 9
Race 100% 100%
White 35 39
Black 63 59
American Indian 1 1
Asian/Pacific Islander 1 1
Weapon 100% 100%
Firearm 71 85
No firearm 29 15
Relationship to victim 100% 100%
Family 12 12
Acquaintance 50 59
Stranger 38 29
Note: 2013 was the year with the fewest
number of juveniles known to have committed
homicide. Detail may not total 100% because
of rounding.
The number of juveniles who committed homicide with a firearm
reached a historic low in 2013 and has since increased
80 83 86 89 92 95 98 01 04 07 10 13 16 19
0
200
400
600
800
1,000
1,200
1,400
Year
Juveniles known by law enforcement to have committed homicide
Acquaintance
Stranger
Family
Q Annually since 1980, juveniles killed more acquaintances than strangers. For exam-
ple, in the 10-year period from 2010 through 2019, 52% juveniles killed an acquain-
tance, 36% killed a stranger, and 12% killed a family member.
Source: Authors’ analysis of the FBI’s
Supplementary Homicide Reports
for 1980–2019.
Victims of juveniles known to have committed homicide were more
likely to be acquaintances or strangers than family members
Q The number of juveniles who committed homicide with a firearm increased between
2001 and 2007, then declined 46% through 2013, reaching its lowest level since at
least 1980. Since the 2013 low point, the number of juveniles who committed homi-
cide with a firearm increased 68% through 2019.
Q While the number of juveniles who committed homicide with a firearm in 2019 was
well below the 1994 peak, the proportion who committed homicide with a firearm
was higher in 2019 (85%) than in 1994 (81%).
Source: Authors’ analysis of the FBI’s
Supplementary Homicide Reports
for 1980–2019.
80 83 86 89 92 95 98 01 04 07 10 13 16 19
0
500
1,000
1,500
2,000
2,500
Year
Juveniles known by law enforcement
to have committed homicide
Firearm involved
No firearm involved
80 83 86 89 92 95 98 01 04 07 10 13 16 19
0%
20%
40%
60%
80%
100%
Year
Percent of juveniles known by law enforcement
to have committed homicide
Firearm involved

Chapter 3: Offending by youth
69
The characteristics of homicides committed by juveniles varied with the age, gender, and race of the
juvenile
Juveniles known to law enforcement to have committed homicide, 2010–2019
Characteristic All Male Female
Younger than
age 16 Age 16 Age 17 White Black
Victim age 100% 100% 100% 100% 100% 100% 100% 100%
Younger than 13 3 3 10 7 2 2 4 3
13 to 17 20 21 14 23 23 17 21 20
18 to 24 34 34 32 25 33 39 33 35
Older than 24 43 43 44 45 43 42 42 43
Victim gender 100% 100% 100% 100% 100% 100% 100% 100%
Male 87 88 73 82 88 88 84 88
Female 13 12 27 18 12 12 16 12
Victim race 100% 100% 100% 100% 100% 100% 100% 100%
White 45 45 52 49 46 43 83 23
Black 51 52 45 48 51 54 14 75
American Indian 1 1 2 2 1 1 1 1
Asian/Pacific Islander 2 2 1 2 2 2 2 1
Victim/offender relationship* 100% 100% 100% 100% 100% 100% 100% 100%
Family 12 11 24 21 10 8 17 7
Acquaintance 52 52 53 46 53 55 53 51
Stranger 36 37 23 34 38 37 30 41
Firearm used 100% 100% 100% 100% 100% 100% 100% 100%
Yes 76 78 55 71 74 79 64 83
No 24 22 45 29 26 21 36 17
Number of offenders* 100% 100% 100% 100% 100% 100% 100% 100%
One 38 38 30 42 38 36 42 35
More than one 62 62 70 58 62 64 58 65
Q Between 2010 and 2019, a greater proportion of homicides committed by female juveniles involved child victims under age
13 than those committed by male youth (10% vs. 3%).
Q A larger proportion of victims of juveniles under age 16 were younger than age 18 (30%) than were the victims of juveniles
age 16 (25%) or age 17 (19%).
Q Female juveniles who commit homicide were more likely to involve female victims than homicides by males (27% vs. 12%)
and to have victims who were family members (24% vs.11%).
Q While the overwhelming majority of homicides committed by juveniles are intraracial, homicides committed by Black youth
were more likely than those by White youth to involve victims of another race (25% vs. 17%).
Q Firearms were more likely to be involved in murders by male juveniles than females (78% vs. 55%) and in murders by Black
juveniles than White juveniles (83% vs. 64%).
Q The victims of White juveniles who committed homicide were more likely to be a family member than were the victims of
Black juveniles (17% vs. 7%).
Q Juveniles younger than age 16 who committed homicide were more likely to commit their crimes alone (42%), than juveniles
age 16 (38%) or age 17 (36%), as were White juveniles compared with Black juveniles (42% vs. 35%). Conversely, female ju-
veniles were more likely to commit their crimes with others than were males (70% vs. 62%).
* In this dataset, the term “offender” is used to describe the person identified by law enforcement as having committed the homicide. This could mean
either that the person was arrested and turned over to the court for prosecution, or was identified but not placed under formal charges (e.g., because
they were deceased).
Note: Data for American Indian and Asian are not shown due to the small number of these youth involved in homicide. Detail may not total 100% be-
cause of rounding.
Source: Authors’ analyses of the FBI’s
Supplementary Homicide Reports
for 1980–2019.

Youth and the Juvenile Justice System: 2022 National Report
70
The daily timing of violent crime committed by youth differs
on school and nonschool days
Youth and adults commit violent
crimes at different times
The FBI’s National Incident-Based Re-
porting System (NIBRS) collects infor-
mation on each crime reported to con-
tributing law enforcement agencies,
including the date and time of day the
crime occurred. For calendar years
2018 and 2019, agencies in 45 states
and the District of Columbia provided
information on the time of day of re-
ported crimes. Analyses of these data
show that for many offenses, youth
commit crimes at different times than
adults, and the youth patterns vary on
school and nonschool days.
Violent crimes (murder, sexual assault,
robbery, and aggravated and simple as-
sault) committed by adults increased
hourly throughout the day, peaking
around 9 p.m., then declining to a low
point by 5 a.m. In contrast, violent
crimes committed by youth peaked at
3 p.m. (the hour at the end of the
school day) and then generally de-
clined hour by hour until the low point
at 5 a.m. At 9 p.m. when the number
of adult violent crimes peaked, the
number of violent crimes committed
by youth was about half the number at
3 p.m.
The importance of the afterschool peri-
od in youth violence is confirmed
when the days of the year are divided
into two groups: school days (Mondays
through Fridays in the months of Sep-
tember through May, excluding holi-
days) and nonschool days (every day
from June through August, including
holidays). A comparison of the school-
and nonschool-day violent crime pat-
terns finds that the 3 p.m. peak occurs
only on school days and only for
youth. The timing of adult violent
crimes is similar on school and non-
school days, with one exception: the
peak occurs later on non-school days
(i.e., weekends and summer days).
Finally, the temporal time pattern of vi-
olent crimes committed by youth on
nonschool days is similar to that of
Violent crime committed by youth peaks in the afterschool hours on
school days
Q Nearly two-thirds (64%) of violent crime committed by youth occurred on school
days, while 53% of violent crime by adults took place on nonschool days.
Q While the number of juveniles who committed homicide with a firearm in 2019 was
well below the 1994 peak, the proportion who committed homicide with a firearm
was higher in 2019 (85%) than in 1994 (81%).
Notes: Violent crime includes murder, violent sexual assault, robbery, aggravated assault, and simple
assault.
Source: Authors’ analysis of the FBI’s
National Incident-Based Reporting System Master Files
for 2018
and 2019.
6 a.m. noon 6 p.m. midnight 6 a.m.
0%
2%
4%
6%
8%
10%
Percent of all persons in age group who committed offense
18 and older
Younger than 18
Violent crime
6 a.m. noon 6 p.m. midnight 6 a.m.
0%
1%
2%
3%
4%
5%
6%
7%
Percent of all youth who committed offense
Nonschool days
School days
Violent crime by youth
6 a.m. noon 6 p.m. midnight 6 a.m.
0%
1%
2%
3%
4%
Percent of all adults who committed offense
School days
Nonschool days
Violent crime by adults

Chapter 3: Offending by youth
71
adults (but peaks an hour earlier than
that of adults).
Crime reduction efforts should
focus on the after school and
early evening hours
The number of school days in a year is
essentially equal to the number of non-
school days in a year. Based on 2018–
2019 NIBRS data, 64% of all violent
crimes by youth occurred on school
days, and nearly 1 of every 5 (18%) of
these crimes occurred in the 4 hours
between 3 p.m. and 7 p.m. A smaller
proportion of violent crime committed
by youth (14%) occurred during the
standard youth curfew hours of 10
p.m. to 6 a.m. However, the annual
number of hours in the curfew period
(i.e., 8 hours every day in the year) is 4
times greater than the number of hours
in the 3 p.m. to 7 p.m. period on
school days (i.e., 4 hours in half of the
days in the year). Therefore, the rate of
violence by youth in the afterschool
period was more than 5 times the rate
in the juvenile curfew period. Conse-
quently, efforts to reduce offending by
youth after school would appear to
have greater potential to decrease a
community’s violent crime rate than
curfews.
6 a.m. noon 6 p.m. midnight 6 a.m.
0%
1%
2%
3%
4%
5%
6%
7%
Percent of all male youth who committed offense
Nonschool days
School days
Male violent crime
The time-of-day patterns of violent crime committed by youth are similar for males and females and for White
youth and Black youth on school and nonschool days
6 a.m. noon 6 p.m. midnight 6 a.m.
0%
1%
2%
3%
4%
5%
6%
7%
Percent of all female youth who committed offense
Nonschool days
School days
Female violent crime
6 a.m. noon 6 p.m. midnight 6 a.m.
0%
1%
2%
3%
4%
5%
6%
7%
Percent of all White youth who committed offense
Nonschool days
School days
White violent crime
6 a.m. noon 6 p.m. midnight 6 a.m.
0%
1%
2%
3%
4%
5%
6%
7%
8%
Percent of all Black youth who committed offense
Nonschool days
School days
Black violent crime
Notes: Violent crime includes murder, violent sexual assault, robbery, aggravated assault, and simple assault.
Source: Authors’ analysis of the FBI’s
National Incident-Based Reporting System Master Files
for 2018 and 2019.

Youth and the Juvenile Justice System: 2022 National Report
72
6 a.m. noon 6 p.m. midnight 6 a.m.
0%
2%
4%
6%
8%
10%
Percent of all persons in age group who committed offense
18 and older
Younger than 18
Aggravated assault
The daily timing of aggravated assault and sexual assault committed by youth vary for school days and
nonschool days
6 a.m. noon 6 p.m. midnight 6 a.m.
0%
1%
2%
3%
4%
5%
6%
Percent of all youth who committed offense
Nonschool days
School days
Aggravated assault by youth
6 a.m. noon 6 p.m. midnight 6 a.m.
0%
2%
4%
6%
8%
10%
12%
Percent of all persons in age group who committed offense
18 and older
Younger than 18
Sexual assault
6 a.m. noon 6 p.m. midnight 6 a.m.
0%
1%
2%
3%
4%
5%
6%
Percent of all youth who committed offense
Nonschool days
School days
Sexual assault by youth
Q Aggravated assault committed by youth peaked at 3 p.m. on school days, coinciding with the end of the school day, while sexual
assaults committed by youth spiked at 8 a.m., noon, and 3 p.m. on school and nonschool days.
Q Unlike the pattern for aggravated assault and sexual assault, the daily timing of robbery by youth is similar to the adult pattern,
peaking in the evening hours on both school and nonshool days.
Q Aggravated assault committed by youth is more likely before 8 p.m. on school days than on nonschool days (i.e., weekends and
all summer days).
Source: Authors’ analysis of the FBI’s
National Incident-Based Reporting System Master Files
for 2018 and 2019.
6 a.m. noon 6 p.m. midnight 6 a.m.
0%
1%
2%
3%
4%
5%
6%
7%
8%
Percent of all persons in age group who committed offense
18 and older
Younger than 18
Robbery
6 a.m.
noon
6 p.m. midnight 6 a.m.
0%
1%
2%
3%
4%
5%
Percent of all youth who committed offense
Nonschool days
School days
Robbery by youth

Chapter 3: Offending by youth
73
6 a.m. noon 6 p.m. midnight 6 a.m.
0%
2%
4%
6%
8%
10%
Percent of all persons in age group who committed offense
18 and older
Younger than 18
Violent crime with injury
Youth injure more victims in the hours around the close of school than at any other time
6 a.m. noon 6 p.m. midnight 6 a.m.
0%
1%
2%
3%
4%
5%
6%
7%
Percent of all youth who committed offense
Nonschool days
School days
Violent crime with
injury by youth
6 a.m. noon 6 p.m. midnight 6 a.m.
0%
1%
2%
3%
4%
5%
6%
7%
Percent of all youth who committed offense
Stranger
Acquaintance
Violent crime by youth
Family
6 a.m. noon 6 p.m. midnight 6 a.m.
0%
1%
2%
3%
4%
Percent of all adults who committed offense
Stranger
Acquaintance
Violent crime by adults
Family
Notes: Violent crime includes murder, violent sexual assault, robbery, aggravated assault, and simple assault. However, violent crime with a firearm excludes
simple assault (a firearm is not applicable to simple assault because the offense would become aggravated assault).
Source: Authors’ analysis of the FBI’s
National Incident-Based Reporting System Master Files
for 2018 and 2019.
6 a.m. noon 6 p.m. midnight 6 a.m.
0%
1%
2%
3%
4%
5%
6%
7%
8%
Percent of all persons in age group who committed offense
18 and older
Younger than 18
Violent crime
with a firearm
Similar to adults, youth are most likely to commit a violent crime with a firearm between 8 p.m. and 10 p.m.
6 a.m. noon 6 p.m. midnight 6 a.m.
0%
1%
2%
3%
4%
5%
Percent of all youth who committed offense
Nonschool days
School days
Violent crime with
a firearm by youth
The after school peak in violent crime by youth largely involves victims who are acquaintances

Youth and the Juvenile Justice System: 2022 National Report
74
Source: Authors’ analysis of the FBI’s
National Incident-Based Reporting System Master Files
for 2018 and 2019.
6 a.m. noon 6 p.m. midnight 6 a.m.
0%
2%
4%
6%
8%
10%
Percent of all persons in age group who committed offense
Younger than 18
18 and older
Larceny−theft
Unlike the daily pattern for violent crime, larceny-theft follows a similar pattern for youth and adults, and for
youth on school and nonschool days
6 a.m. noon 6 p.m. midnight 6 a.m.
0%
1%
2%
3%
4%
5%
Percent of all youth who committed offense
Nonschool days
School days
Larceny−theft by youth
6 a.m. noon 6 p.m. midnight 6 a.m.
0%
2%
4%
6%
8%
10%
Percent of all persons in age group who committed offense
18 and older
Younger than 18
Weapons law violation
6 a.m. noon 6 p.m. midnight 6 a.m.
0%
1%
2%
3%
4%
5%
6%
7%
8%
Percent of all youth who committed offense
Nonschool days
School days
Weapons law violation by youth
6 a.m. noon 6 p.m. midnight 6 a.m.
0%
1%
2%
3%
4%
5%
6%
7%
8%
Percent of all persons in age group who committed offense
18 and older
Younger than 18
Drug law violation
The daily timing of drug law violations known to law enforcement indicate how often schools are a setting for
such offenses and their detection
6 a.m. noon 6 p.m. midnight 6 a.m.
0%
1%
2%
3%
4%
5%
6%
Percent of all youth who committed offense
Nonschool days
School days
Drug law violation by youth
Similar to the pattern for drug law violations, the time and day of weapons law violations by youth reflect the
role schools play in bringing these matters to the attention of law enforcement

Chapter 3: Offending by youth
75
Sources
Bureau of Justice Statistics. Arrest Data
Analysis Tool [available online: www.
bjs.gov/index.cfm?ty=datool&surl=/
arrests/index.cfm. [Retrieved Decem-
ber 12, 2018.]
Centers for Disease Control, National
Center for Injury Prevention and Con-
trol, WISQARS (Web-Based Injury
Statistics Query and Reporting Sys-
tem).
Leading Causes of Death Re-
ports, 1981–2019
. Available online:
wisqars.cdc.gov/fatal-leading. [Ac-
cessed January 19, 2022.]
Centers for Disease Control and Pre-
vention.
1991–2019 High School Risk
Behavior Survey Data
. Available on-
line: nccd.cdc.gov/youthonline. [Ac-
cessed January 19, 2022.]
Federal Bureau of Investigation. Vari-
ous years.
Crime in the United States
for 2015 through 2019. Washington,
DC: FBI.
Federal Bureau of Investigation. 2019
and 2020.
National Incident-Based Re-
porting System
Master File
for 2018
and 2019 [data files].
Federal Bureau of Investigation. Vari-
ous years.
Supplementary Homicide
Reports
for 1980 through 2019 [data
files].
Federal Interagency Forum on Child
and Family Statistics.
America’s Chil-
dren: Key National Indicators of Well-
Being
. Table BEH5: Youth perpetra-
tors of serious violent crimes: Rate and
number of serious violent crimes by
youth ages 12–17. Available online:
www.childstats.gov/americaschildren/
tables/beh5.asp.
Graf, N. 2018. A majority of U.S.
teens fear a shooting could happen at
their school, and most parents share
their concern. Pew Research Center.
Available online: www.pewresearch.
org/fact-tank/2018/04/18/a-
majority-of-u-s-teens-fear-a-shooting-
could-happen-at-their-school-and-
most-parents-share-their-concern/.
Arrest rate source note
Arrest estimates developed by the
Bureau of Justice Statistics for 1990–
2014 were retrieved from their
Arrest
Data Analysis Tool
[available online at
www.bjs.gov/index.cfm?ty=datool&
surl=/arrests/index.cfm, retrieved De-
cember 12, 2018]; the National Cen-
ter for Juvenile Justice developed ar-
rest estimates for 2015–2019 based
on data published in the FBI’s
Crime
in the United States
reports for the
respective years; population data for
1990–1999 is from the National Cen-
ter for Health Statistics (prepared by
the U.S. Census Bureau with support
from the National Cancer Institute),
Bridged-Race Intercensal Estimates
of the July 1, 1990–July 1, 1999,
United States Resident Population by
County, Single-Year of Age, Sex,
Race, and Hispanic Origin
[machine-
readable data files available online at
www.cdc.gov/nchs/nvss/bridged_
race.htm, released July 26, 2004];
population data for 2000–2009 is
from the National Center for Health
Statistics (prepared under a collabor-
ative arrangement with the U.S. Cen-
sus Bureau),
Intercensal Estimates of
the Resident Population of the United
States for July 1, 2000–July 1, 2009,
by Year, County, Single-Year of Age (0,
1, 2, . . . , 85 Years and Over), Bridged
Race, Hispanic Origin, and Sex
[ma-
chine-readable data files available on-
line at www.cdc.gov/nchs/nvss/
bridged_race.htm, as of October 26,
2012, following release by the U.S.
Census Bureau of the revised un-
bridged intercensal estimates by
5-year age group on October 9, 2012];
and population data for 2010–2019
are from the National Center for Health
Statistics (prepared under a collabora-
tive arrangement with the U.S. Census
Bureau),
Vintage 2019 Postcensal Es-
timates of the Resident Population of
the United States (April 1, 2010, July
1, 2010–July 1, 2019), by Year, County,
Single-Year of Age (0, 1, 2, . . . , 85
Years and Over), Bridged Race, His-
panic Origin, and Sex
[machine-read-
able data files available online at www.
cdc.gov/nchs/nvss/bridged_race.htm,
as of July 9, 2020, following release
by the U.S. Census Bureau of the un-
bridged vintage 2019 postcensal esti-
mates by 5-year age group, retrieved
on July 29, 2020].
Johnston, L., Miech, R., O’Malley, P.,
Bachman, J., Schulenberg, J., and Pat-
rick, M. 2020. Demographic subgroup
trends among adolescents in the use of
various licit and illicit drugs, 1975–
2019.
Monitoring the Future Occa-
sional Paper No. 94
. Ann Arbor, MI:
Institute for Social Research, the Uni-
versity of Michigan.
Miech, R., Johnston, L., O’Malley, P.,
Bachman, J., Schulenberg, J., and Pat-
rick, M. 2018.
Monitoring the Future
National Survey Results on Drug Use,
1975–2017: Volume I, Secondary
School Students
. Ann Arbor, MI: Insti-
tute for Social Research, the University
of Michigan.
Miech, R., Johnston, L., O’Malley, P.,
Bachman, J., Schulenberg, J., and Pat-
rick, M. 2019.
Monitoring the Future
National Survey Results on Drug Use,
1975–2018: Volume I, Secondary
School Students
. Ann Arbor, MI: Insti-
tute for Social Research, the University
of Michigan.
Miech, R., Johnston, L., O’Malley, P.,
Bachman, J., Schulenberg, J., and Pat-
rick, M. 2020.
Monitoring the Future
National Survey Results on Drug Use,
1975–2019: Volume I, Secondary
School Students
. Ann Arbor, MI: Insti-
tute for Social Research, the University
of Michigan. Available online:
monitoringthefuture.org/results/
publications/monographs.

Youth and the Juvenile Justice System: 2022 National Report
76
National Center for Education Statis-
tics.
Digest of Education
. Table
228.12. Number of casualties from
shootings at public and private elemen-
tary and secondary schools, number of
school shootings, and number of
schools with shootings, by type of ca-
sualty and level of school: 2000–01
through 2020–21 (updated September
2021). Available online: nces.ed.gov/
programs/digest/d21/tables/
dt21_228.12.asp.
National Center for Health Statistics
(prepared by the U.S. Census Bureau
with support from the National Cancer
Institute),
Bridged-Race Intercensal
Estimates of the July 1, 1990–July 1,
1999, United States Resident Popula-
tion by County, Single-Year of Age,
Sex, Race, and Hispanic Origin
[data
files available online at www.cdc.gov/
nchs/nvss/bridged_race.htm, released
July 26, 2004].
National Center for Health Statistics
(prepared under a collaborative ar-
rangement with the U.S. Census Bu-
reau),
Intercensal Estimates of the Res-
ident Population of the United States
for July 1, 2000–July 1, 2009, by Year,
County, Single-Year of Age (0, 1, 2, . .
. , 85 Years and Over), Bridged Race,
Hispanic Origin, and Sex
[data files
available online at www.cdc.gov/nchs/
nvss/bridged_race.htm, as of October
26, 2012, following release by the U.S.
Census Bureau of the revised un-
bridged intercensal estimates by 5-year
age group on October 9, 2012].
National Center for Health Statistics
(prepared under a collaborative ar-
rangement with the U.S. Census Bu-
reau),
Vintage 2019 Postcensal Esti-
mates of the Resident Population of
the United States (April 1, 2010, July
1, 2010–July 1, 2019), by Year, Coun-
ty, Single-Year of Age (0, 1, 2, . . . , 85
Years and Over), Bridged Race, His-
panic Origin, and Sex
[data files avail-
able online at www.cdc.gov/nchs/
nvss/bridged_race.htm, as of July 9,
2020, following release by the U.S.
Census Bureau of the unbridged vin-
tage 2019 postcensal estimates by
5-year age group, retrieved on July 29,
2020].

Youth and the Juvenile Justice System: 2022 National Report
77
Chapter 4
Juvenile justice system
structure and process
4
The first juvenile court in the United
States was established in Chicago in
1899, nearly 125 years ago. But in
the long history of law and justice, ju-
venile justice is a relatively new devel-
opment. The juvenile justice system
has experienced several distinct peri-
ods of change. After the establishment
of
juvenile courts around the country
there was a period where the emphasis
was on rehabilitation rather than pun-
ishment, on the child rather than the
crime. But over time the notion of re-
habilitation lost its allure. By the late
1960s, juvenile court had become
more punitive and critics argued that
its informality and secrecy should not
deny youth the due process protec-
tions afforded adults. This led to sev-
eral landmark Supreme Court deci-
sions, federal legislation, and changes
in state statutes that made juvenile
courts more like criminal courts.
In the early 1990s, perceptions of a
juvenile crime epidemic focused the
public’s attention on the juvenile jus-
tice system’s ability to effectively con-
trol youth who commit violent of-
fenses. As a reaction, states adopted
numerous legislative changes in an ef-
fort to crack down on juvenile crime.
In fact, through the mid-1990s, near-
ly every state made it easier to expose
more youth to criminal court prose-
cution. Although the juvenile and
criminal justice systems had grown
similar, the juvenile justice system has
remained unique, guided by its own
philosophy—with an emphasis on indi-
vidualized justice and serving the best
interests of the child—and legislation,
and is implemented by its own set of
agencies.
During the 2000s there has been a
distinct shift away from the harshness
of the 1990s. Several states have
changed their jurisdictional boundaries
to keep youth in the juvenile system.
There is less reliance on correctional
placements and an emphasis on system
responses being developmentally ap-
propriate and evidence-based.
This chapter describes the structure
and process of the juvenile justice sys-
tem, focusing on delinquency and sta-
tus offense matters. (Chapter 2 dis-
cusses the handling of child
maltreatment matters.) Parts of this
chapter provide an overview of the his-
tory of juvenile justice in the United
States, including significant Supreme
Court decisions that have shaped the
juvenile justice system, and generally
describe case processing in the juvenile
justice system. Also summarized in this
chapter are state variations in key as-
pects of the juvenile justice system.
Much of this information was drawn
from National Center for Juvenile Jus-
tice analyses of juvenile codes in each
state. (Note: the District of Columbia
is often referred to as a state.)
This chapter also includes information
on juveniles processed in the federal
justice system.

Youth and the Juvenile Justice System: 2022 National Report
78
The juvenile justice system was founded on the concept of
rehabilitation through individualized justice
Early in U.S. history, children who
broke the law were treated the
same as adults
Throughout the late 18th century, “in-
fants” below the age of reason (tradi-
tionally age 7) were presumed to be
incapable of criminal intent and were
exempt from prosecution and punish-
ment. Children as young as 7, though,
could stand trial in criminal court, and
if found guilty, could be sentenced to
prison or even given a death sentence.
The 19th century movement that led
to the establishment of the juvenile
court in the U.S. had its roots in 16th
century European educational reforms
that changed the perception of chil-
dren from one of miniature adults to
one of persons with less than fully de-
veloped moral and cognitive capacities.
As early as 1825, the Society for the
Prevention of Juvenile Delinquency es-
tablished a facility specifically for the
housing, education, and rehabilitation
of children who commit offenses.
Soon, facilities exclusively for children
were established in most major cities.
By mid-century, these privately operat-
ed child “prisons” were under criticism
for various abuses. Many states then
took on the responsibility of operating
such facilities.
The first juvenile court in the
United States was established in
Cook County, Illinois, in 1899
Illinois passed the Juvenile Court Act
in 1899, which established the nation’s
first separate juvenile court. The Brit-
ish doctrine of parens patriae (the state
as parent) was the rationale for the
right of the state to intervene in the
lives of children in a manner different
from the way it dealt with the lives of
adults. The doctrine was interpreted to
mean that because children were not
of full legal capacity, the state had the
inherent power and responsibility to
provide protection for children whose
natural parents were not providing ap-
propriate care or supervision. A key
element was the focus on the welfare
of the child. Thus, the child accused of
law violations was also seen as in need
of the court’s benevolent intervention.
Juvenile courts flourished for the
first half of the 20th century
By 1910, 32 states had established
juvenile courts and/or probation ser-
vices. By 1925, all but two states had
followed suit. Rather than merely pun-
ishing youth for their crimes, juvenile
courts sought to turn these wayward
youth into productive citizens—
through rehabilitation and treatment.
The mission to help children in trouble
was stated clearly in the laws that es-
tablished juvenile courts. This mission
led to procedural and substantive dif-
ferences between the juvenile and
criminal justice systems.
In the first 50 years of the juvenile
court’s existence, most juvenile courts
had exclusive original jurisdiction over
all youth younger than age 18 who
were charged with violating criminal
laws. However, in some states the
upper age of juvenile jurisdiction was
lower in certain cities or counties or
was different for boys than for girls.
Only if the juvenile court waived its ju-
risdiction in a case, could a child be
transferred to criminal court and tried
as an adult. Transfer decisions were
made on a case-by-case basis using a
“best interests of the child and public”
standard.
The focus on individuals and not
offense, on rehabilitation and not
punishment, changed procedures
Unlike the criminal justice system,
where prosecutors selected cases for
trial, the juvenile court controlled its
own intake. And unlike criminal prose-
cutors, juvenile court intake considered
extra-legal as well as legal factors in de-
ciding how to handle cases. Juvenile
court intake also had discretion to han-
dle cases informally, bypassing judicial
action altogether.
In the courtroom, juvenile court hear-
ings were much less formal than crimi-
nal court proceedings. In this benevo-
lent court—with the express purpose
of protecting children—due process
protections afforded to criminal defen-
dants were deemed unnecessary. In the
early juvenile courts, attorneys for the
state and the youth were not consid-
ered essential to the operation of the
system, especially in less serious cases.
A range of dispositional options was
available to a judge wanting to help re-
habilitate a child. Regardless of offense,
outcomes ranging from warnings to
probation supervision to training
school confinement could be part of
the treatment plan. Dispositions were
tailored to the “best interests of the
child.” Treatment lasted until the child
was “cured” or became an adult (age
21), whichever came first.
As public confidence in the
treatment model waned, due
process protections were
introduced
In the 1950s and 1960s, society came
to question the ability of the juvenile
court to succeed in rehabilitating
youth who violated the law. The treat-
ment techniques available to juvenile
justice professionals often failed to
demonstrate effectiveness. Although
the goal of rehabilitation through indi-
vidualized justice—the basic philoso-
phy of the juvenile justice system—was
not in question, professionals were
concerned about the growing number
of youth institutionalized indefinitely
in the name of treatment.
In a series of decisions beginning in
the 1960s, the U.S. Supreme Court
changed the juvenile court process.
Formal hearings were now required if
the juvenile court was going to waive
its jurisdiction, and youth facing possi-
ble confinement were given Fifth
Amendment protection against self-in-
crimination and rights to receive notice
of the charges against them, to present

Chapter 4: Juvenile justice system structure and process
79
The first case in juvenile court
After years of development and
months of compromise, the Illinois
legislature passed, on April 14, 1899,
a law permitting counties in the state
to designate one or more of their cir-
cuit court judges to hear all cases in-
volving children younger than age 16
for neglect, dependency, or delin-
quency. The legislation stated that
these cases were to be heard in a
special courtroom that would be des-
ignated as “the juvenile courtroom”
and referred to as the “Juvenile
Court.” Thus, the first juvenile court
opened in Cook County on July
3,1899, was not a new court, but a
division of the circuit court with origi-
nal jurisdiction over juvenile cases.
The judge assigned to this new divi-
sion was Richard Tuthill, a Civil War
veteran who had been a circuit court
judge for more than 10 years. The
first case heard by Judge Tuthill in ju-
venile court was that of Henry Camp-
bell, an 11-year-old who had been ar-
rested for larceny. The hearing was a
public event. While some tried to
make the juvenile proceeding secret,
the politics of the day would not per-
mit it. The local papers carried stories
about what had come to be known
as “child saving” by some and “child
slavery” by others.*
At the hearing, Henry Campbell’s par-
ents told Judge Tuthill that their son
was a good boy who had been led
into trouble by others, an argument
consistent with the underlying philos-
ophy of the court—that individuals
(especially juveniles) were not solely
responsible for the crimes they com-
mit. The parents did not want young
Henry sent to an institution, which was
one of the few options available to the
judge. Although the enacting legisla-
tion granted the new juvenile court the
right to appoint probation officers to
handle juvenile cases, the officers
were not to receive publicly funded
compensation. Thus, the judge had no
probation staff to provide services to
Henry. The parents suggested that
Henry be sent to live with his grand-
mother in Rome, New York. After
questioning the parents, the judge
agreed to send Henry to his grand-
mother’s in the hope that he would
“escape the surroundings which have
caused the mischief.” This first case
was handled informally, without a for-
mal adjudication of delinquency on
Henry’s record.
Judge Tuthill’s first formal case is not
known for certain, but the case of
Thomas Majcheski (handled about 2
weeks after the Campbell case) might
serve as an example. Majcheski, a
14-year-old, was arrested for stealing
grain from a freight car in a railroad
yard, a common offense at the time.
The arresting officer told the judge that
the boy’s father was dead and his
mother (a washerwoman with nine
children) could not leave work to come
to court. The officer also said that the
boy had committed similar offenses
previously but had never been arrest-
ed. The boy admitted the crime. The
judge then asked the nearly 300 peo-
ple in the courtroom if they had any-
thing to say. No one responded. Still
without a probation staff in place, the
judge’s options were limited: dismiss
the matter, order incarceration at the
state reformatory, or transfer the case
to adult court. The judge decided the
best alternative was incarceration in
the state reformatory, where the youth
would “have the benefit of schooling.”
A young man in the audience then
stood up and told the judge that the
sentence was inappropriate. Newspa-
per accounts indicate that the objector
made the case that the boy was just
trying to obtain food for his family.
Judge Tuthill then asked if the objector
would be willing to take charge of the
boy and help him become a better cit-
izen. The young man accepted. On the
way out of the courtroom, a reporter
asked the young man of his plans for
Thomas. The young man said “Clean
him up, and get him some clothes and
then take him to my mother. She’ll
know what to do with him.”
In disposing of the case in this man-
ner, Judge Tuthill ignored many possi-
ble concerns (e.g., the rights and de-
sires of Thomas’s mother and the
qualifications of the young man—or
more directly, the young man’s moth-
er). Nevertheless, the judge’s actions
demonstrated that the new court was
not a place of punishment. The judge
also made it clear that the community
had to assume much of the responsi-
bility if it wished to have a successful
juvenile justice system.
* Beginning in the 1850s, private societies in New York City rounded up so called “street children” from the urban ghettos and sent them to farms in the
Midwest. Child advocates were concerned that these home-finding agencies did not properly screen or monitor the foster homes, pointing out that the
societies were paid by the county to assume responsibility for the children and also by the families who received the children. Applying this concern to
the proposed juvenile court, the Illinois legislation stated that juvenile court hearings should be open to the public so the public could monitor the activi-
ties of the court to ensure that private organizations would not be able to gain custody of children and then “sell” them for a handsome profit and would
not be able to impose their standards of morality or religious beliefs on working-class children.
Source: Authors’ adaptation of Tanenhaus’
Juvenile Justice in the Making
.

Youth and the Juvenile Justice System: 2022 National Report
80
witnesses, to question witnesses, and to
have an attorney. The burden of proof
was raised from “a preponderance of
evidence” to a “beyond a reasonable
doubt” standard for an adjudication.
The Supreme Court, however, still
held that there were enough “differ-
ences of substance between the crimi-
nal and juvenile courts … to hold that
a jury is not required in the latter.”
(See Supreme Court decisions later in
this chapter.)
Meanwhile, Congress, in the Juvenile
Delinquency Prevention and Control
Act of 1968, recommended that youth
charged with noncriminal offenses (be-
havior that is a law violation only be-
cause of the youth’s status as a juve-
nile) be handled outside the court
system. A few years later, Congress
passed the Juvenile Justice and Delin-
quency Prevention Act of 1974, which
as a condition for state participation in
the Formula Grants Program required
deinstitutionalization of status offend-
ers and nonoffenders and the separa-
tion of youth charged with delinquen-
cy offenses from adults charged with or
convicted of a crime. Much of the Act’s
compliance focus has been related to
youth in justice system confinement fa-
cilities (see box). Community-based
programs, diversion, and deinstitution-
alization became the banners of juve-
nile justice policy.
In the 1980s, the pendulum began
to swing toward law and order
During the 1980s, the public perceived
that serious juvenile crime was increas-
ing and that the system was too lenient
on youth charged with breaking the
law. Although there was a substantial
misperception regarding increases in
juvenile crime, many states responded
by passing more stringent laws. Some
laws removed certain age youth
charged with certain offenses from the
juvenile justice system in favor of the
criminal justice system. Others required
the juvenile justice system to be more
like the criminal justice system in the
handling of certain juvenile court cases.
As a result, youth charged with certain
offenses were excluded from juvenile
court jurisdiction or faced mandatory,
automatic waiver to criminal court. In
several states, concurrent jurisdiction
provisions gave prosecutors the discre-
tion to file certain juvenile cases direct-
ly in criminal court.
State legislatures continued to
crack down on juvenile crime in
the 1990s
Five areas of change emerged as states
passed laws designed to combat juve-
nile crime. These laws generally in-
volved expanded eligibility for criminal
court processing and adult correctional
sanctioning, and reduced confidentiali-
ty protections for a subset of juvenile
offenders. Between 1992 and 1997, all
but three states changed laws in one or
more of the following areas:
Q Transfer provisions: Laws made it
easier to transfer youth from the
juvenile justice system to the crimi-
nal justice system including lowering
the upper age of juvenile court juris-
diction (45 states).
Q Sentencing authority: Laws gave
criminal and juvenile courts expand-
ed sentencing options (31 states).
Q Confidentiality: Laws modified or
removed traditional juvenile court
confidentiality provisions by making
records and proceedings more open
(47 states).
In addition to these areas, there was
change relating to:
Q Victims’ rights: Laws increased the
role of victims of juvenile crime in
the juvenile justice process (22
states).
Q Correctional programming: As a
result of new transfer and sentencing
laws, adult and juvenile correctional
administrators developed new pro-
grams.
The pendulum swings again in the
2000s with a focus on brain
science and doing what works
The 1980s and 1990s saw significant
change in terms of processing more
youth younger than 18 through the
criminal justice system. However, the
juvenile violent crime arrest rate had
already peaked (in 1994) before much
of the punitive legislation was enacted,
and the rate continued to decline
through the 1990s. By 2001, the en-
tire spike in juvenile violent crime ar-
rest rates had been erased and experts
had begun to evaluate the consequences
of the new “tough on crime” policies.
Research in adolescent development
and brain science confirmed what ev-
eryone knew all along, that children
and adolescents are different from
adults. Adolescents are more impulsive
and take more risks than adults. They
are less able to think about conse-
quences and more influenced by peer
pressure. This is not to imply that ado-
lescent brains are somehow defective,
but that they are still developing. New
brain imaging showed that develop-
ment of the frontal lobe (the decision
center of the brain) continues into the
mid-20s. As Laurence Steinberg com-
mented, “There is a time lag between
the activation of brain systems that ex-
cite our emotions and impulses and the
maturation of brain systems that allow
us to check these feelings and urgings
—it’s like driving a car with a sensitive
gas pedal and bad brakes.” Adoles-
cence is also a time of what scientists
call neuroplasticity—when the brain
has tremendous potential to change
through experience. This means that
adolescents have capacity to change, to
be rehabilitated when matched to the
most appropriate, effective interven-
tions. In fact, most youth grow out of
their delinquent behavior.

Chapter 4: Juvenile justice system structure and process
81
In 2005 the U.S. Supreme Court ref-
erenced the science of adolescent brain
development in its
Roper
v.
Simmons
decision that barred the death penalty
for youth younger than 18 (see section
on U.S. Supreme Court decisions).
This information has had an impact on
many aspects of juvenile justice. Since
2000, 12 states have passed laws to
raise the upper age of juvenile court ju-
risdiction for delinquency offenses.
Several states have passed sweeping ju-
venile justice reforms or have had task
forces or commissions make recom-
mendations for reform legislative pack-
ages. Most resulting legislation has in-
cluded roll-backs of at least some
transfer provisions to keep more youth
out of criminal court. For example,
California eliminated its concurrent ju-
risdiction provision in 2016 that had
since the early 2000s allowed prosecu-
tors to file certain offenses directly in
criminal court. New Jersey raised the
minimum age for transfer to criminal
court across its provisions from age 14
to age 15.
The National Academies of Sciences’
National Research Council’s 2013
Re-
forming Juvenile Justice: A Develop-
mental Approach
outlined a framework
for juvenile justice reform that was
grounded in adolescent development
research and called for evidence-based
and developmentally informed policies,
programs, and practices. State juvenile
justice reforms in the 2000s have gen-
erally been founded on adolescent de-
velopment and doing what works to
reduce youth offending behavior based
on research evidence.
Some states’ juvenile justice reforms
emphasized the use of diversion and
community-based programs—staples of
juvenile justice for decades. A growing
body of research is showing these ap-
proaches to be more effective in reduc-
ing youths’ subsequent offending than
more punitive responses.
Several core requirements of the Federal Juvenile Justice and
Delinquency Prevention Act address custody issues
The Juvenile Justice and Delinquency
Prevention Act (the Act) sets four
custody-related requirements.
The “deinstitutionalization of status
offenders and nonoffenders” require-
ment (1974) specifies that youth not
charged with acts that would be
crimes for adults “shall not be placed
in secure detention facilities or secure
correctional facilities.” This require-
ment does not apply to youth
charged with violating a valid court
order or possessing a handgun, or
those held under interstate compacts.
The “sight and sound separation” re-
quirement (1974) specifies that “juve-
niles … shall not be detained or con-
fined in any institution in which they
have contact with adult inmates.”
This requires that incarcerated juve-
niles and adults cannot see each
other and no conversation between
them is possible.
The “jail and lockup removal” require-
ment (1980) states that youth of juve-
nile age shall not be detained or con-
fined in adult jails or lockups. There
are, however, several exceptions.
There is a 6-hour grace period that
allows adult facilities to hold youth
temporarily while awaiting transfer to
a juvenile facility or making court ap-
pearances. Under certain conditions,
jails and lockups in rural areas may
hold youth awaiting initial court ap-
pearance up to 24 hours plus week-
ends and holidays. Some jurisdictions
have obtained approval for juvenile
detention centers that are collocated
with an adult facility; in addition, staff
who work with both youth and adults
must be trained and certified to work
with youth. Until recently, youth being
tried as adults in criminal court were
exempt from this requirement.
Revisions passed in 2018 require
that, as of December 21, 2021, even
youth charged as adults must be re-
moved from adult jails to juvenile fa-
cilities. The definition of “adult” in the
new statute is tied to each state’s age
of criminal responsibility and extended
age of jurisdiction. There is an excep-
tion if a court holds a hearing and
finds that holding the youth in an adult
facility is “in the interest of justice.”
The court must consider the youth’s
age; physical and mental maturity;
present mental state, including risk of
self-harm; and offending history as
well as the nature and circumstances
of the charges; the relative ability of
the available adult and juvenile facili-
ties to meet the needs of the youth
and protect other youth in their custo-
dy and the public; and “any other rele-
vant factor.” If the court allows the
youth held in jail, a review hearing
must be held every 30 days with a
180-day maximum.
The “racial and ethnic disparities”
(R/ED) requirement (2018) means that
states must assess and address racial
and ethnic disparities at key points in
the juvenile justice system—from ar-
rest to detention to confinement and
work to reduce them. This requirement
was previously known as the “dispro-
portionate minority confinement”
(DMC) (1988) and later (2002) as the
disproportionate minority contact
(DMC) requirement.
States must agree to comply with
each requirement to receive Formula
Grants funds under the Act’s provi-
sions. States must submit plans out-
lining their strategy for meeting these
and other statutory requirements.
Noncompliance with core require-
ments results in the loss of at least
20% of the state’s annual Formula
Grants Program allocation per require-
ment. For fiscal year 2020, 4 states/
territories were not participating in the
Formula Grants Program and an addi-
tional 3 were ineligible to receive an
award that year because they did not
meet the state plan requirements.

Youth and the Juvenile Justice System: 2022 National Report
82
Some juvenile codes emphasize
prevention and treatment goals,
some stress punishment, but most
still seek a balanced approach
States vary in how they express the
purposes of their juvenile courts—not
just in the underlying assumptions and
philosophies but also in the approach-
es they take to the task. Some declare
their goals in great detail; others men-
tion only the broadest of aims. Many
juvenile court purpose clauses have
been amended over the years, reflect-
ing philosophical or rhetorical shifts
and changes in emphasis in the states’
overall approaches to juvenile delin-
quency. Some have been relatively un-
touched for decades. Given the chang-
es in juvenile justice in recent decades,
it is remarkable how many states still
declare their purposes in language first
developed in the 1950s and 1960s.
Developmental Approach. These
states retain elements of other catego-
ries, but have purpose clauses that
mention the use of adolescent develop-
ment or other research and/or require
evidence based practices or data to as-
sist the juvenile justice system.
Balanced and Restorative Justice.
Most common in state purpose clauses
are components of Balanced and Re-
storative Justice (BARJ). BARJ advo-
cates that juvenile justice systems give
balanced attention to three primary in-
terests: public safety, development of
skills to help youth live law-abiding
and productive lives, and individual ac-
countability to victims and the com-
munity for harm caused.
Due process era. Refers to the period
of reform of the 1960’s and 1970’s
where federal laws, model acts, and Su-
preme Court cases influenced the addi-
tion of due process protections.
Parens patriae. This Latin phrase
meaning “father of the nation” applies
to state clauses that reflect the juvenile
court judge’s earliest role as the state’s
designated protector of children.
States juvenile code purpose clauses vary in their emphasis
State
Developmental
approach
Balanced and
restorative
justice
Due
process
Parens
patriae None
Alabama
Q
Alaska
Q
Arizona
Q
Arkansas
Q
California
Q
Colorado
Q
Connecticut
Q
Delaware
Q
Dist. of Columbia
Q
Florida
Q
Georgia
Q
Hawaii
Q
Idaho
Q
Illinois
Q
Indiana
Q
Iowa
Q
Kansas
Q
Kentucky
Q
Louisiana
Q
Maine
Q
Maryland
Q
Massachusetts
Q
Michigan
Q
Minnesota
Q
Mississippi
Q
Missouri
Q
Montana
Q
Nebraska
Q
Nevada
Q
New Hampshire
Q
New Jersey
Q
New Mexico
Q
New York
Q
North Carolina
Q
North Dakota
Q
Ohio
Q
Oklahoma
Q
Oregon
Q
Pennsylvania
Q
Rhode Island
Q
South Carolina Q
South Dakota Q
Tennessee Q
Texas Q
Utah Q
Vermont Q
Virginia Q
Washington Q
West Virginia Q
Wisconsin Q
Wyoming Q
Source: Authors’ adaptation of OJJDP’s
Statistical Briefing Book
.

Chapter 4: Juvenile justice system structure and process
83
U.S. Supreme Court cases have had an impact on the
character and procedures of the juvenile justice system
The Supreme Court has made its
mark on juvenile justice
Issues arising from delinquency pro-
ceedings rarely come before the U.S.
Supreme Court. Beginning in the late
1960s, however, the Court decided a
series of landmark cases that dramati-
cally changed the character and proce-
dures of the juvenile justice system.
Kent v. United States
383 U.S. 541, 86 S. Ct. 1045 (1966)
In 1961, while on probation from an
earlier case, Morris Kent, age 16, was
charged with rape and robbery. Kent
confessed to the charges as well as to
several similar incidents. Assuming that
the District of Columbia juvenile court
would consider waiving jurisdiction to
the adult system, Kent’s attorney filed
a motion requesting a hearing on the
issue of jurisdiction.
The juvenile court judge did not rule
on this motion filed by Kent’s attorney.
Instead, he entered a motion stating
that the court was waiving jurisdiction
after making a “full investigation.” The
judge did not describe the investiga-
tion or the grounds for the waiver.
Kent was subsequently found guilty in
criminal court on six counts of house-
breaking and robbery and sentenced to
30 to 90 years in prison.
Kent’s lawyer sought dismissal of the
criminal indictment, arguing that the
waiver had been invalid. He also ap-
pealed the waiver and filed a writ of
habeas corpus asking the state to justify
Kent’s detention. Appellate courts re-
jected both the appeal and the writ, re-
fused to scrutinize the judge’s “investi-
gation,” and accepted the waiver as
valid. In appealing to the U.S. Su-
preme Court, Kent’s attorney argued
that the judge had not made a com-
plete investigation and that Kent was
denied constitutional rights simply be-
cause he was a minor.
The Court ruled the waiver invalid,
stating that Kent was entitled to a
hearing that measured up to “the es-
sentials of due process and fair treat-
ment,” that Kent’s counsel should have
had access to all records involved in
the waiver, and that the judge should
have provided a written statement of
the reasons for waiver.
Technically, the Kent decision applied
only to D.C. courts, but its impact was
widespread. The Court raised a poten-
tial constitutional challenge to parens
patriae as the foundation of the juve-
nile court. Previously, the Court had
interpreted the equal protection clause
of the Fourteenth Amendment to
mean that certain classes of people
could receive less due process if a
“compensating benefit” came with this
lesser protection. In theory, the juve-
nile court provided less due process
but a greater concern for the interests
of the youth. The Court referred to
evidence that this compensating benefit
may not exist in reality and that youth
may receive the “worst of both
worlds”—“neither the protection ac-
corded to adults nor the solicitous care
and regenerative treatment postulated
for children.”
In re Gault
387 U.S. 1, 87 S. Ct. 1428 (1967)
Gerald Gault, age 15, was on proba-
tion in Arizona for a minor property
offense when, in 1964, he and a friend
made a prank telephone call to an
adult neighbor. Identified by the
neighbor, the youth were arrested and
detained.
The victim did not appear at the adju-
dication hearing and the court never
resolved the issue of whether Gault
made the “obscene” remarks. Gault
was committed to a training school for
the period of his minority. The maxi-
mum sentence for an adult would have
been a $50 fine or 2 months in jail.
An attorney obtained for Gault after
the trial filed a writ of habeas corpus
that was eventually heard by the U.S.
Supreme Court. The issue presented
was that Gault’s constitutional rights
(to notice of charges, counsel, ques-
tioning of witnesses, protection against
self-incrimination, a transcript of the
proceedings, and appellate review)
were denied.
The Court ruled that in hearings that
could result in commitment to an insti-
tution, juveniles have the right to no-
tice and counsel, to question witnesses,
and to protection against self-incrimi-
nation. The Court did not rule on a
juvenile’s right to appellate review or
transcripts but encouraged the states to
provide those rights.
The Court based its ruling on the fact
that Gault was being punished rather
than helped by the juvenile court. The
Court explicitly rejected the doctrine
of parens patriae as the core principle
of juvenile justice, describing the con-
cept as murky and of dubious historical
relevance. The Court concluded that
the handling of Gault’s case violated
the due process clause of the Four-
teenth Amendment: “Juvenile court
history has again demonstrated that
unbridled discretion, however benevo-
lently motivated, is frequently a poor
substitute for principle and procedure.”
In re Winship
397 U.S. 358, 90 S. Ct. 1068 (1970)
Samuel Winship, age 12, was charged
with stealing $112 from a woman’s
purse in a store. A store employee
claimed to have seen Winship running
from the scene just before the woman
noticed the money was missing; others
in the store stated that the employee
was not in a position to see the money
being taken. Winship was adjudicated
delinquent and committed to a train-
ing school. New York juvenile courts
operated under the civil court standard
of a “preponderance of evidence.” The

Youth and the Juvenile Justice System: 2022 National Report
84
court agreed with Winship’s attorney
that there was “reasonable doubt” of
Winship’s guilt but based its ruling on
the “preponderance” of evidence.
Upon appeal to the Supreme Court,
the central issue in the case was wheth-
er “proof beyond a reasonable doubt”
should be considered among the “es-
sentials of due process and fair treat-
ment” required during the adjudicato-
ry stage of the juvenile court process.
The Court rejected lower court argu-
ments that juvenile courts were not re-
quired to operate on the same stan-
dards as adult courts because juvenile
courts were designed to “save” rather
than to “punish” children. The Court
ruled that the “reasonable doubt”
standard should be required in all de-
linquency adjudications.
McKeiver v. Pennsylvania
403 U.S. 528, 91 S. Ct. 1976 (1971)
Joseph McKeiver, age 16, was charged
with robbery, larceny, and receiving
stolen goods. He and 20 to 30 other
youth allegedly chased 3 youth and
took 25 cents from them. McKeiver
met with his attorney for only a few
minutes before his adjudicatory hear-
ing. At the hearing, his attorney’s re-
quest for a jury trial was denied by the
court. He was subsequently adjudicat-
ed and placed on probation.
The state supreme court cited recent
decisions of the U.S. Supreme Court
that had attempted to include more
due process in juvenile court proceed-
ings without eroding the essential ben-
efits of the juvenile court. The state su-
preme court affirmed the lower court,
arguing that, of all due process rights,
trial by jury is most likely to “destroy
the traditional character of juvenile
proceedings.”
The U.S. Supreme Court found that
the due process clause of the Four-
A series of U.S. Supreme Court decisions have shaped juvenile justice over the decades
Breed
v.
Jones
(1975)
Waiver of a juvenile to criminal court
following adjudication in juvenile
court constitutes double jeopardy.
Roper
v.
Simmons
(2005)
Minimum age for death
penalty set at 18.
Kent
v.
United States
(1966)
Oklahoma Publishing Co.
v.
District Court
(1977)
Courts must provide the “essen-
tials of due process” in transfer-
ring juveniles to the adult system.
Smith
v.
Daily Mail Publishing Co.
(1979)
Graham
v.
Florida
(2010)
The press may report juvenile court
proceedings under certain circumstances.
Juveniles cannot be sen-
tenced to life without parole
for non-homicide crimes.
In re Gault
(1967)
In hearings that could result in com-
mitment to an institution, juveniles
have four basic constitutional rights.
Eddings
v.
Oklahoma
(1982)
Defendant’s youthful age should
considered a mitigating factor in
deciding whether to apply the
death penalty.
Miller
v.
Alabama
(2012)
Mandatory sentences of
life without parole for
juveniles violate the
Eighth Amendment.
In re Winship
(1970)
In delinquency matters, the
state must prove its case
beyond a reasonable doubt.
Schall
v.
Martin
(1984)
Preventive “pretrial” detention
of juveniles is allowable under
certain circumstances.
Montgomery
v.
Louisiana
(2016)
Ban on mandatory life
without parole sentences
applies retroactively.
McKeiver
v.
Pennsylvania
(1971)
Thompson
v.
Oklahoma
(1988)
Jury trials are not constitution-
ally required in juvenile court
hearings.
Stanford
v.
Kentucky
(1989)
Minimum age for death
penalty set at 16.
>>
1965
1970
1975 1980 1985 1990 2005 2010 2015

Chapter 4: Juvenile justice system structure and process
85
teenth Amendment did not require
jury trials in juvenile court. The impact
of the Court’s Gault and Winship deci-
sions was to enhance the accuracy of
the juvenile court process in the fact-
finding stage. In McKeiver, the Court
argued that juries are not known to be
more accurate than judges in the adju-
dication stage and could be disruptive
to the informal atmosphere of the ju-
venile court, making it more adversarial.
Breed v. Jones
421 U.S. 519, 95 S. Ct. 1779 (1975)
In 1970, Gary Jones, age 17, was
charged with armed robbery. Jones
appeared in Los Angeles juvenile court
and was adjudicated delinquent on
the original and two other robberies.
At the dispositional hearing, the judge
waived the case to criminal court.
Counsel for Jones filed a writ of habeas
corpus, arguing that the waiver to
criminal court violated the double
jeopardy clause of the Fifth Amend-
ment. The court denied this petition,
saying that Jones had not been tried
twice because juvenile adjudication is
not a “trial” and does not place a
youth in jeopardy.
Upon appeal, the U.S. Supreme Court
ruled that an adjudication in juvenile
court, in which a juvenile is found to
have violated a criminal statute, is
equivalent to a trial in criminal court.
Thus, Jones had been placed in double
jeopardy. The Court said that jeopardy
applies at the adjudication hearing
when evidence is first presented. Waiv-
er cannot occur after jeopardy attaches.
Oklahoma Publishing Company v.
District Court in and for Oklahoma
City
480 U.S. 308, 97 S. Ct. 1045 (1977)
The Oklahoma Publishing Company
case involved a court order prohibiting
the press from publishing the name
and photograph of a youth involved in
a juvenile court proceeding. The mate-
rial in question was obtained legally
from a source outside the court. The
U.S. Supreme Court found the court
order to be an unconstitutional in-
fringement on freedom of the press.
Smith v. Daily Mail Publishing
Company
443 U.S. 97, 99 S. Ct. 2667 (1979)
The Daily Mail case held that state law
cannot stop the press from publishing
a youth’s name that it obtained inde-
pendently of the court. Although the
decision did not hold that the press
should have access to juvenile court
files, it held that if information regard-
ing a juvenile case is lawfully obtained
by the media, the First Amendment in-
terest in a free press takes precedence
over the interests in preserving the an-
onymity of juvenile defendants.
Eddings v. Oklahoma
455 U.S. 104 (1982)
The Supreme Court reversed the death
sentence of a 16-year-old tried as an
adult in criminal court. The Court
held that a defendant’s young age, as
well as mental and emotional develop-
ment, should be considered a mitigat-
ing factor of great weight in deciding
whether to apply the death penalty.
The Court noted that adolescents are
less mature, responsible, and self-disci-
plined than adults and are less able to
consider the long-range implications of
their actions. The Court did not ad-
dress whether the Eighth and Four-
teenth Amendments prohibit the im-
position of the death sentence on an
offender because he was only 16 years
old at the time the offense was com-
mitted.
Schall v. Martin
467 U.S. 253, 104 S. Ct. 2403
(1984)
Gregory Martin, age 14, was arrested
in 1977 and charged with robbery, as-
sault, and possession of a weapon. He
and two other youth allegedly hit a
boy on the head with a loaded gun and
stole his jacket and sneakers.
Martin was held pending adjudication
because the court found there was a
“serious risk” that he would commit
another crime if released. Martin’s at-
torney filed a habeas corpus action
challenging the fundamental fairness of
preventive detention. The lower appel-
late court reversed the juvenile court’s
detention order, arguing in part that
pretrial detention is essentially punish-
ment because many juveniles detained
before trial are released before, or im-
mediately after, adjudication.
The U.S. Supreme Court upheld the
constitutionality of the preventive de-
tention statute. The Court stated that
preventive detention serves a legitimate
state objective in protecting both the
youth and society from pretrial crime
and is not intended to punish the
youth. The Court found that enough
procedures were in place to protect
youth from wrongful deprivation of
liberty. The protections were provided
by notice, a statement of the facts and
reasons for detention, and a probable
cause hearing within a short time. The
Court also reasserted the parens patriae
interests of the state in promoting the
welfare of children.
Thompson v. Oklahoma
487 U.S. 815 (1988)
The issue before the U.S. Supreme
Court was whether imposing the death
penalty on a youth who was 15 at the
time of the murder violated constitu-
tional protections against cruel and un-
usual punishment. The Court conclud-

Youth and the Juvenile Justice System: 2022 National Report
86
ed that the Eighth Amendment
prohibited application of the death
penalty to a person who was younger
than 16 at the time of the crime.
Stanford v. Kentucky
492 U.S. 361 (1989)
In
Stanford
the U.S. Supreme Court
decided that the Eighth Amendment
does not prohibit the death penalty for
crimes committed at age 16 or 17.
Roper v. Simmons
543 U.S. 551, 125 S. Ct. 1183
(2005)
In
Roper
, the U.S. Supreme Court
noted that several states had abolished
their juvenile death penalty since
Stan-
ford
and none had established or rein-
stated it. The objective evidence of
“consensus in this case—the rejection
of the juvenile death penalty in the ma-
jority of states; the infrequency of its
use even where it remains on the
books; and the consistency in the trend
toward abolition of the practice—pro-
vide sufficient evidence that today our
society views juveniles, in the words
Atkins used respecting the mentally re-
tarded, as ‘categorically less culpable
than the average criminal’.” Thus, the
Court affirmed the Missouri Supreme
Court judgment that set aside the
death sentence imposed on Christo-
pher Simmons, concluding that the
“Eighth and Fourteenth Amendments
forbid imposition of the death penalty
on offenders who were under the age
of 18 when their crimes were commit-
ted.”
Graham v. Florida
560 U.S. 48, 130 S. Ct. 2011 (2010)
Terrance Graham, age 16, was arrested
and charged with the crimes of bur-
glary and robbery. Graham accepted a
plea deal, requiring 12 months in
county jail followed by a 3-year proba-
tionary period. Graham was released
from jail after 6 months.
Not 6 months later, Graham was ar-
rested for armed robbery. The state of
Florida charged him with violations of
the terms and conditions of his proba-
tion. The trial court held a hearing on
these violations and passed down a
sentence of life imprisonment. Florida
had abolished their system of parole;
Graham could only be released by ex-
ecutive pardon.
Graham filed an appeal claiming that
his Eighth Amendment rights against
cruel and unusual punishment were
being violated by the length of the sen-
tence. The Supreme Court agreed, rul-
ing that the sentencing of a youth of
juvenile age to life without parole for a
nonhomicidal case was a violation of
the cruel and unusual punishment
clause of the Eighth Amendment. The
Court found that there was no national
consensus for life without parole sen-
tences, youth of juvenile age had limit-
ed culpability, and life sentences were
extremely punitive for youth in nonho-
micide cases.
Miller v. Alabama
567 U.S. 460, 132 S. Ct. 2455
(2012)
Evan Miller was 14 when he and a
friend beat his neighbor with a baseball
bat and set fire to his trailer, killing
him in the process. Miller was tried as
a juvenile at first, but was then trans-
ferred to criminal court, pursuant to
Alabama law. He was charged by the
district attorney with murder in the
course of arson, a crime with a manda-
tory minimum sentence of life without
parole. The jury found Miller guilty,
and he was sentenced to a life without
parole term.
Miller filed an appeal claiming that his
sentence was in violation of the Eighth
Amendment clause against cruel and
unusual punishment. The Supreme
Court held that the Eighth Amend-
ment forbids a mandatory sentence of
life in prison without parole for a juve-
nile convicted of homicide. The Court
based their reasoning on prior rulings
in
Roper
, which had prohibited capital
punishment for children, and
Graham
,
which prohibited life without parole
sentences for nonhomicide offenses.
Combining the rationales, the Court
ruled that juveniles could not be sen-
tenced to serve mandatory life without
parole.
Montgomery v. Louisiana
136 S. Ct. 718 (2016)
Henry Montgomery was a 17-year-old
11th-grade student in 1963, when he
was arrested for the murder of a sher-
iff’s deputy. Montgomery, a Black
youth, was tried and convicted for the
murder of the White law enforcement
officer. He originally received an auto-
matic death sentence. In 1966, his
original conviction was overturned by
the Louisiana Supreme Court but he
was re-tried and again convicted of
murder. The sentence in his second
trail was mandatory life without parole.
Following the U.S. Supreme Court’s
decision in
Miller
, Montgomery filed a
post-conviction motion to “correct”
his sentence but the Louisiana Su-
preme Court ruled that
Miller
did not
apply retroactively.
The Supreme Court held that
Miller
did indeed apply retroactively. The
Court based the decision on the princi-
ple that “children are different”—they
are less culpable than adults and more
likely to be reformed. Any individuals
whose sentences were made before
Miller
was decided were entitled to re-
sentencing or parole eligibility consid-
eration.

Chapter 4: Juvenile justice system structure and process
87
State statutes define who is under the jurisdiction of juvenile
court
Statutes set age limits for original
jurisdiction of the juvenile court
In most states, the juvenile court has
original jurisdiction over all youth
charged with a law violation who were
younger than age 18 at the time of the
offense, arrest, or referral to court. Be-
tween 1975 and 2000, four states
changed their upper age: Alabama
raised its upper age to 16 in 1976 and
to 17 in 1977; Wyoming lowered its
upper age to 17 in 1993; and New
Hampshire and Wisconsin lowered
their upper age to 16 in 1996.
Since 2000, 10 states have passed laws
raising their upper age of original juve-
nile court jurisdiction: Connecticut
raised its upper age from 15 to 17 by
July 2012; Massachusetts raised its age
to 17 in 2013; Illinois made the age
17 for all but the most violent felonies
by 2014; New Hampshire’s age be-
came 17 in 2015; South Carolina’s
change to 17 passed in 2016 but it did
not take effect until 2019; New York
raised its age from 15 to 16 in 2018
and to 17 in 2019; North Carolina
also raised its age from 15 to 17 at the
end of 2019; Louisiana raised its age to
17 for all but the most violent felonies
by 2019 (and for all crimes by 2020);
Michigan’s law passed in 2019 raising
the age to 17, but did not take effect
until 2020; and Missouri’s law passed
in 2018 raising the age to 17, but the
effective date was not until 2021.
Oldest age for original juvenile court juris-
diction in delinquency matters, 2019:
Age State
16 Georgia, Michigan, Missouri,
Texas, Wisconsin
17 All other states and the District of
Columbia
Vermont has gone further raising its
upper age to 18 in 2020, and through
age 19, effective in 2022. Though the
implementation is pending, the defini-
tion of a juvenile proceeding in Ver-
mont under another law will allow ju-
venile jurisdiction to be sought
through youthful offender provisions
(blended sentencing) for youth
through age 21.
Many states have higher upper ages of
juvenile court jurisdiction in status of-
fense, abuse, neglect, or dependency
matters—typically through age 20. The
juvenile court may have original juris-
diction over young adults who commit-
ted offenses before they became adults.
As of the end of the 2019 legislative
session, 30 states and the District of
Columbia set no minimum age for de-
linquency matters in statute and 20
states had statutes that set the lowest
age of juvenile court delinquency juris-
diction. Four of these are states that
previously had no lower age set and
one state, Massachusetts, raised its
lower age from 7 to 12. States without
a set minimum age rely on case law or
common law. Children younger than a
certain age are presumed to be incapa-
ble of criminal intent and are exempt
from prosecution and punishment.
Youngest age for original juvenile court
jurisdiction in delinquency matters, 2019:
Age State
6 North Carolina
7 Connecticut, Maryland, New York
8 Arizona
10 Arkansas, Colorado, Kansas,
Louisiana, Minnesota, Mississippi,
North Dakota, Pennsylvania, South
Dakota, Texas, Vermont, Wisconsin
11 Nebraska
12 California, Massachusetts
States often have statutory exceptions
to basic age criteria, such as excluding
married or otherwise emancipated
youth from juvenile court jurisdiction.
Other exceptions, related to the
youth’s age, alleged offense, and/or
prior court history, place certain youth
under the original jurisdiction of the
criminal court. In some states, a com-
bination of the youth’s age, offense,
and prior record places the youth
under the original jurisdiction of both
the juvenile and criminal courts. In
these states, the prosecutor has the au-
thority to decide which court will ini-
tially handle the case.
Juvenile court authority over
youth may extend beyond the
upper age of original jurisdiction
Through extended jurisdiction provi-
sions, legislatures enable the court to
provide services and sanctions for a pe-
riod of time that is in the best interests
of the youth and the public, even for
youth who have reached the age at
which original juvenile court jurisdic-
tion ends. As of the end of the 2019
legislative session, statutes in 34 states
extend juvenile court jurisdiction in
delinquency cases to the 21st birthday.
Oldest age over which the juvenile court
may retain jurisdiction for disposition
purposes in delinquency matters, 2019:
Age State
18 Oklahoma, Texas
19 Alaska, Mississippi, North Dakota
20 Alabama, Arizona,* Arkansas,
Delaware, District of Columbia,
Florida, Georgia, Idaho, Illinois,
Indiana, Iowa, Kentucky, Louisiana,
Maine, Maryland, Massachusetts,
Michigan, Minnesota, Missouri,
Nebraska, Nevada,** New
Hampshire, New Mexico, North
Carolina, Ohio, Pennsylvania, Rhode
Island, South Dakota, Tennessee,
Utah, Virginia, Washington, West
Virginia, Wyoming
21 South Carolina, Vermont
22 Kansas, New York
24 California, Montana, Oregon,
Wisconsin
*** Connecticut, Colorado, Hawaii, New
Jersey
Notes: Extended jurisdiction may be restrict-
ed to certain offenses or youth.
*Arizona statute extends jurisdiction through
age 20, but the state Supreme Court held in
1979 that juvenile court jurisdiction ends at
18.
**Until the full term of the disposition order
for sex offenders.
***Until the full term of the disposition order.
In some states, juvenile courts may im-
pose adult correctional sanctions on
certain youth adjudicated delinquent
that extend the term of confinement
well beyond the upper age of juvenile
jurisdiction—this is known as blended
sentencing.

Youth and the Juvenile Justice System: 2022 National Report
88
Law enforcement agencies refer most of the youth entering
the juvenile justice system for law violations
Local processing of youth
charged with delinquency or
status offenses varies
From state to state, case processing of
youth who have violated the law varies.
Even within states, case processing may
vary from community to community,
reflecting local practice and tradition.
Any description of juvenile justice pro-
cessing in the U.S. must, therefore, be
general, outlining common decision
points.
Law enforcement agencies divert
many youth out of the juvenile
justice system
A youth’s entry into the juvenile justice
system often begins with a victim,
school, or citizen contacting law en-
forcement about an incident or trou-
blesome behavior. Once contacted, po-
lice decide either to send the matter
further into the justice system or to di-
vert the youth away from the system,
often into alternative programs. Law
enforcement generally makes this deci-
sion after talking with the victim, the
youth, and the parents, and after re-
viewing the youth’s prior contacts with
the juvenile justice system. Police may
decide on pre-arrest diversion (also
known as deflection) or may arrest the
youth, but decide not to refer the
youth to court intake. In 2019, just
over one-quarter of juvenile arrests
were handled within the police depart-
ment and resulted in release of the
youth. The remaining arrests were re-
ferred to juvenile court (6 in 10) or for
criminal prosecution (<1 in 10) or to
other agencies (<1 in 10).
Most delinquency cases are
referred to juvenile court by law
enforcement agencies
Law enforcement accounted for 82% of
all delinquency cases referred to juve-
nile court in 2019. The proportion re-
ferred by law enforcement was as high
as 88% in the early 1990s. The remain-
ing referrals were made by others, such
as parents, victims, school personnel,
and probation officers. In contrast, po-
lice referred just 18% of status offense
cases; schools referred 62%.
Intake departments screen cases
referred to juvenile court for
diversion or formal processing
The court intake function is generally
the responsibility of the juvenile proba-
tion department and/or the prosecu-
tor’s office. Intake decides whether to
dismiss the case, to handle the matter
informally, or to file a petition request-
ing formal intervention by the juvenile
court.
To make this decision, an intake officer
or prosecutor first reviews the facts of
the case to determine whether there is
sufficient evidence to prove the allega-
tion. If not, the case is dismissed. If
there is sufficient evidence, intake then
determines whether to divert the youth
or if formal intervention is necessary.
Historically, the goal has been to iden-
tify the “least restrictive” response, i.e.,
to intervene only as much as necessary.
Nearly half of all delinquency cases re-
ferred to juvenile court intake are han-
dled without a petition. Four in 10 de-
linquency cases that are not petitioned
are dismissed. Even in cases that are di-
verted from formal handling, intake
can issue a warning, refer the youth to
community-based programs or services,
or offer the youth an agreement—to
specific conditions for a specific time
period—in exchange for dismissal.
These conditions often are outlined in
a written agreement, generally called a
“consent decree.” Conditions may in-
clude such things as victim restitution,
school attendance, drug counseling, or
a curfew.
Diversion can be offered with or
without “strings attached”
In most jurisdictions, a youth may be
offered an informal disposition only if
he or she admits to committing the
act. The youth’s compliance with the
informal agreement often is monitored
by a probation officer. Thus, this pro-
cess is sometimes labeled “informal
probation.”
If the youth successfully complies with
the informal disposition, the case is dis-
missed. If, however, the youth fails to
meet the conditions, the case is re-
ferred for formal processing and pro-
ceeds as it would have if the initial de-
cision had been to petition the case for
an adjudicatory hearing.
In some communities the intake ap-
proach is to only use services and case
management for those youth that need
it and only refer them to services that
are necessary for positive behavior
change. The diversion is “without
strings” attached—noncompliance with
diversion does not result in court-im-
posed consequences except in serious
cases. Failure in diversion does not re-
sult in placement or detention.
The petition requests a court
hearing
If the case is to be handled formally in
juvenile court, intake files one of two
9-8-8 hotline intended to
divert mental health crises
away from 9-1-1 law
enforcement responders
The National Suicide Hotline Desig-
nation Act of 2020 jumpstarted im-
plementation of a nationwide non-
police mental health crisis response
system so people in crisis are di-
verted from involvement in the jus-
tice system and connected to ap-
propriate services and supports.
The Federal Communications Com-
mission formally designated 9-8-8
as a nationwide 3-digit number for
mental health crisis and suicide pre-
vention services with a two-year
timeline to make 9-8-8 operational
nationwide by mid-year 2022.

Chapter 4: Juvenile justice system structure and process
89
types of petitions: a delinquency peti-
tion requesting an adjudicatory hearing
or a petition requesting a waiver hear-
ing to transfer the case to criminal
court.
A delinquency petition states the alle-
gations and requests that the juvenile
court adjudicate (or judge) the youth a
delinquent, making the juvenile a ward
of the court. This language differs
from that used in the criminal court
system, where an individual is convict-
ed and sentenced.
In response to the delinquency peti-
tion, an adjudicatory hearing is sched-
uled. Even after a delinquency petition
has been filed, court officials can order
the case closed before it reaches adju-
dication and divert the youth out of
the system. If the case reaches an adju-
dicatory hearing (trial), witnesses are
called and the facts of the case are pre-
sented. In nearly all adjudicatory hear-
ings, a judge or judicial officer makes
the determination that the youth was
responsible for the offense(s); however,
in some states, the youth has the right
to a jury trial.
Youth may be held in a secure
detention facility during their case
Juvenile courts may hold youth in-
volved in delinquency cases in a secure
juvenile detention facility while await-
ing their hearing to protect the com-
munity, to protect the child, or both.
After arrest, law enforcement may re-
quest to bring the youth to the local
juvenile detention facility. A juvenile
probation officer or detention worker
reviews the case to decide whether the
youth poses a risk to the community
and should be detained pending a
hearing before a judge. In many juris-
dictions a detention risk assessment
tool is used to inform and give struc-
ture to the decision.
Because the experience of secure de-
tention may cause harm to the youth,
the detention decision should be a
thoughtful process that balances public
safety and the best interests of the
child. Ideally, secure detention is a last
resort that is part of a continuum of
care with several detention alternatives
available for youth facing delinquency
charges in the juvenile justice system.
What are the stages of delinquency case processing in the juvenile justice system?
Note: This chart gives a simplified view of caseflow through the juvenile justice system. Procedures may vary among jurisdictions.
Revocation
Release
Judicial waiver
Detention
Non-law
enforcement
sources
Prosecution
Juvenile
court intake
Diversion
Diversion
Statutory
exclusion
Prosecutorial
discretion
Transfer to
juvenile court
Revocation
Law
enforcement
Formal
processing
Residential
placement
Probation or
other non-
residential
disposition
Reentry to
community
Diversion
Informal
processing/
diversion
Dismissal
Adjudication
Criminal justice system
Release

Youth and the Juvenile Justice System: 2022 National Report
90
In all states, if a youth is held in deten-
tion, a detention hearing must be held
within a period defined by statute,
generally within 24 hours. At the de-
tention hearing, a judge reviews the
case and determines if continued de-
tention is warranted. In 2019, youth
were detained, at least at some point,
between referral to court and case dis-
position in 26% of juvenile court delin-
quency cases.
As part of efforts to reduce the use of
detention, jurisdictions may take steps
to reduce the length of stay in deten-
tion. The fact that a youth was de-
tained initially doesn’t mean they need
to remain confined until their case is
disposed. Efforts to find suitable alter-
natives to detention can enable the
court to safely release the youth. De-
tention may extend beyond the adjudi-
catory and dispositional hearings. If
residential placement is ordered but no
placement beds are available, the youth
may remain in detention until a bed
elsewhere becomes available.
The juvenile court may transfer
the case to criminal court
The prosecutor or intake officer files a
waiver petition if they believe that a
case under jurisdiction of the juvenile
court would be more appropriately
handled in criminal court. The juvenile
court decision in these matters follows
a review of the facts of the case and a
determination that there is probable
cause to believe that the youth com-
mitted the act. With this established,
the court decides whether juvenile
court jurisdiction over the matter
should be waived and the case trans-
ferred to criminal court.
The judge’s decision in such cases gen-
erally centers on the issue of the
youth’s amenability to treatment in the
juvenile justice system. The prosecu-
tion may argue that the youth has been
adjudicated several times previously
and that interventions ordered by the
juvenile court have not kept the youth
from committing subsequent criminal
acts. The prosecutor may also argue
that the crime is so serious that the ju-
venile court is unlikely to be able to in-
tervene for the time period necessary
to rehabilitate the youth.
If the judge decides that the case
should be transferred to criminal court,
juvenile court jurisdiction is waived
and the case is filed in criminal court.
In 2019, juvenile courts waived just
under 1% of all formally processed de-
linquency cases. If the judge does not
approve the waiver request, generally
an adjudicatory hearing is scheduled in
juvenile court.
Some states let prosecutors file
certain cases directly in criminal
court
In more than half of the states, legisla-
tures have decided that in certain cases
(generally those involving serious of-
fenses), youth should be tried in crimi-
nal court. The law excludes such cases
from juvenile court; prosecutors must
file them in criminal court. In a smaller
number of states, legislatures have
given both the juvenile and adult/
criminal courts concurrent jurisdiction
in certain cases. Thus, prosecutors have
discretion to file such cases in either
criminal or juvenile court.
After adjudication, probation staff
prepare a disposition plan
Once the youth is adjudicated delin-
quent in juvenile court, probation staff
develop a case disposition plan. To pre-
Most states have adopted a single risk/needs assessment tool statewide
to measure the youth’s risk of reoffending and their criminogenic needs
Q Statewide uniform assessment: States adopt a single risk assessment tool state-
wide that is required or encouraged by the state or in progress toward this goal with
a specific instrument.
Q Layered/regional assessment: States do not achieve statewide implementation with
a single tool due to layered probation (state and local) or due to regional differences.
Q Locally administered assessment: States lack requirement to implement risk as-
sessment tool allowing local policy to govern the use of risk assessment tools.
Source: Authors’ adaptation of NCJJ’s Juvenile Justice GPS, State Implementation of Risk/Needs As-
sessment Tools.
Statewide uniform (42 states)
Layed/regional (5 states)
Locally administered (4 states)
Assessment tool
implementation
DC

Chapter 4: Juvenile justice system structure and process
91
pare this plan, probation staff assess the
youth, typically using a structured
risk/needs assessment tool. Such tools
are a key component of the Risk-
Needs-Responsivity (RNR) framework.
The tools predict the likelihood that
youth will reoffend and provide infor-
mation on the youth’s dynamic risk
factors that need to change to reduce
their law violating behavior (known as
criminogenic needs) and how to tailor
the intervention to the youth’s learn-
ing style, motivation, abilities, and
strengths.
In addition to assessing the youth, pro-
bation staff must identify available sup-
port systems, programs, and services in
the community for the youth. The
court may also order psychological
evaluations, and diagnostic tests that
may include a period of confinement in
a diagnostic facility.
At the disposition hearing, probation
staff present dispositional recommen-
dations to the judge. The prosecutor
and the youth or the youth’s defense
counsel may also present dispositional
recommendations. Some jurisdictions
use a structured decisionmaking grid,
known as a disposition matrix, which
identifies the most effective responses
to youth in various risk categories.
After considering the recommenda-
tions, the judge orders a disposition in
the case. Each disposition should be
narrowly tailored to meet the specific
interests and needs of each young per-
son.
The majority of youth adjudicated
delinquent are ordered to
probation
Most juvenile dispositions are multifac-
eted and involve some sort of super-
vised probation. In fact, probation is
the most frequent disposition ordered
in juvenile court, however, it is only
one of many options. In 2019, formal
probation was the most severe disposi-
tion ordered in 65% of the cases in
which the youth was adjudicated delin-
quent.
What does good community
supervision practice look
like?
Community supervision has evolved
and become less about short-term
rule compliance—with probation of-
ficers as referees to catch youth
doing something wrong (surveil-
lance) and more like coaching youth
to promote long-term success and
behavior change.
Best practices for juvenile probation
and reentry community supervision
include tailored, youth- and family-
centered supervision plans, achiev-
able goals that support youth’s abil-
ity to complete any conditions
included in the supervision order,
connection with prosocial activities
and adults in the community, and
referral to more intensive treatment
only as needed for substance use,
mental health, and other health
needs.
A probation order may include addi-
tional requirements such as drug coun-
seling, or restitution to the community
or victim. The term of probation may
be for a specified period of time or it
may be open-ended.
Research on adolescent development
has ushered in substantial changes in
how probation operates. There is a
growing understanding that probation
orders should not be uniform, and
must address if probation will be su-
pervised or unsupervised, for a limited
time or open-ended, and include a lim-
ited number of “conditions” (rules the
youth must follow while under proba-
tion supervision), if any, in the order.
Some jurisdictions are using probation
orders that do not include a long list of
conditions, but rather direct the youth
to work with probation on achieving
the goals outlined in their case disposi-
tion or supervision plan.
Although it is not recommended prac-
tice, many jurisdictions confine youth
in detention or longer term facilities
for technical violations of their proba-
tion order. In 2019, technical viola-
tions of probation, parole, or valid
court order accounted for 18% of
youth in detention centers on any
given day.
Review hearings may be held to moni-
tor the youth’s progress, either by the
court or the probation department.
After the judge is satisfied that the
terms of the probation order have been
met, the judge terminates the case.
The judge may order residential
placement
In 2019, juvenile courts ordered resi-
dential placement in 27% of the cases
in which the youth was adjudicated de-
linquent. Residential commitment may
be for a specific or indeterminate time
period. The facility may be publicly or
privately operated and may have a se-
cure, prison-like environment or a
more open (even home-like) setting.
In many states, when the judge com-
mits a youth to the state department of
juvenile corrections, the department
determines where the youth will be
placed and when the youth will be re-
leased. In other states, the judge con-
trols the type and length of stay; in
these situations, review hearings are
held to assess the youth’s progress.
Juvenile reentry or aftercare is
similar to adult parole
Upon release from residential place-
ment, the youth is often ordered to a
period of community supervision (re-
entry, aftercare, or parole). During this
period, the youth is under supervision
of the court, a probation or parole
agency, or the juvenile corrections
agency. Like probation supervision, re-
entry community supervision is chang-
ing. Youth will eventually return to
their communities and research has
shown that youth and their families
need support to successfully make the
transition. Many jurisdictions are pro-

Youth and the Juvenile Justice System: 2022 National Report
92
A juvenile court by any other
name is still a juvenile court
Every state has at least one court
with juvenile jurisdiction, but in
most states it is not actually called
“juvenile court.” The names of the
courts with juvenile jurisdiction vary
by state—district, superior, circuit,
county, family, or probate court, to
name a few. Often, the court of ju-
venile jurisdiction has a separate di-
vision for juvenile matters. Courts
with juvenile jurisdiction generally
have jurisdiction over delinquency,
status offense, and abuse/neglect
matters and may also have jurisdic-
tion in other matters such as adop-
tion, termination of parental rights,
and emancipation. Whatever their
name, courts with juvenile jurisdic-
tion are generically referred to as ju-
venile courts.
viding help to strengthen families and
provide youth with educational and
vocational opportunities, employment
and housing assistance, mental and
physical healthcare, family program-
ming, and substance use treatment to
help youth overcome barriers to suc-
cessful reentry.
If the youth does not follow the condi-
tions of supervision, their release may
be revoked and they may be recommit-
ted to the same facility or committed
to another facility. In 2019, technical
violations of probation, parole, or valid
court order accounted for 11% of
youth in long-term secure facilities on
a typical day.
Status offense and delinquency
case processing differ
A delinquent offense is an act commit-
ted by a juvenile for which an adult
could be prosecuted in criminal court.
There are, however, behaviors that are
law violations only for youth because
of their juvenile status. These “status
offenses” may include behaviors such
as running away from home, truancy,
alcohol possession or use, incorrigibili-
ty, and curfew violations.
In many ways, the processing of status
offense cases parallels that of delin-
quency cases. Not all states, however,
consider all of these behaviors to be
law violations. Many states view such
behaviors as indicators that the child is
in need of supervision. These states
handle status offense matters more like
dependency cases than delinquency
cases, responding to the behaviors by
providing social services. This approach
is in line with the recommendations of
the 1968 federal Juvenile Delinquency
Prevention and Control Act.
Although many youth charged with
status offenses enter the juvenile justice
system through law enforcement, the
initial, official contact may be a school
or child welfare agency. Fewer than 1
in 5 petitioned status offense cases
were referred to juvenile court by law
enforcement in 2019.
The federal Juvenile Justice and Delin-
quency Prevention Act states that juris-
dictions shall not hold status offenders
in secure juvenile facilities for deten-
tion or placement. This policy has been
labeled deinstitutionalization of status
offenders. There is an exception to the
general policy known as the valid court
order exception: a status offender may
be confined in a secure juvenile facility
if they have violated a valid court
order, such as a probation order re-
quiring the youth to attend school or
observe a curfew.
Most judges who hear juvenile justice cases do not specialize; most
carry a mixed caseload
Q All mixed case types: All, or nearly all, judges are not specialized and carry a mixed
caseload of juvenile and adult cases, including often both criminal and civil cases.
Q Mostly mixed: Most judges in the state are not specialized and carry a mixed case-
load.
Q Mostly specialized: Most judges in the state who handle delinquency and family
cases are specialized in this area of practice.
Source: Authors’ adaptation of NCJJ’s Juvenile Justice GPS, Judicial Specialization.
All mixed (3 states)
Mostly mixed (30 states)
Mostly specialized (18 states)
Judicial specialization
DC
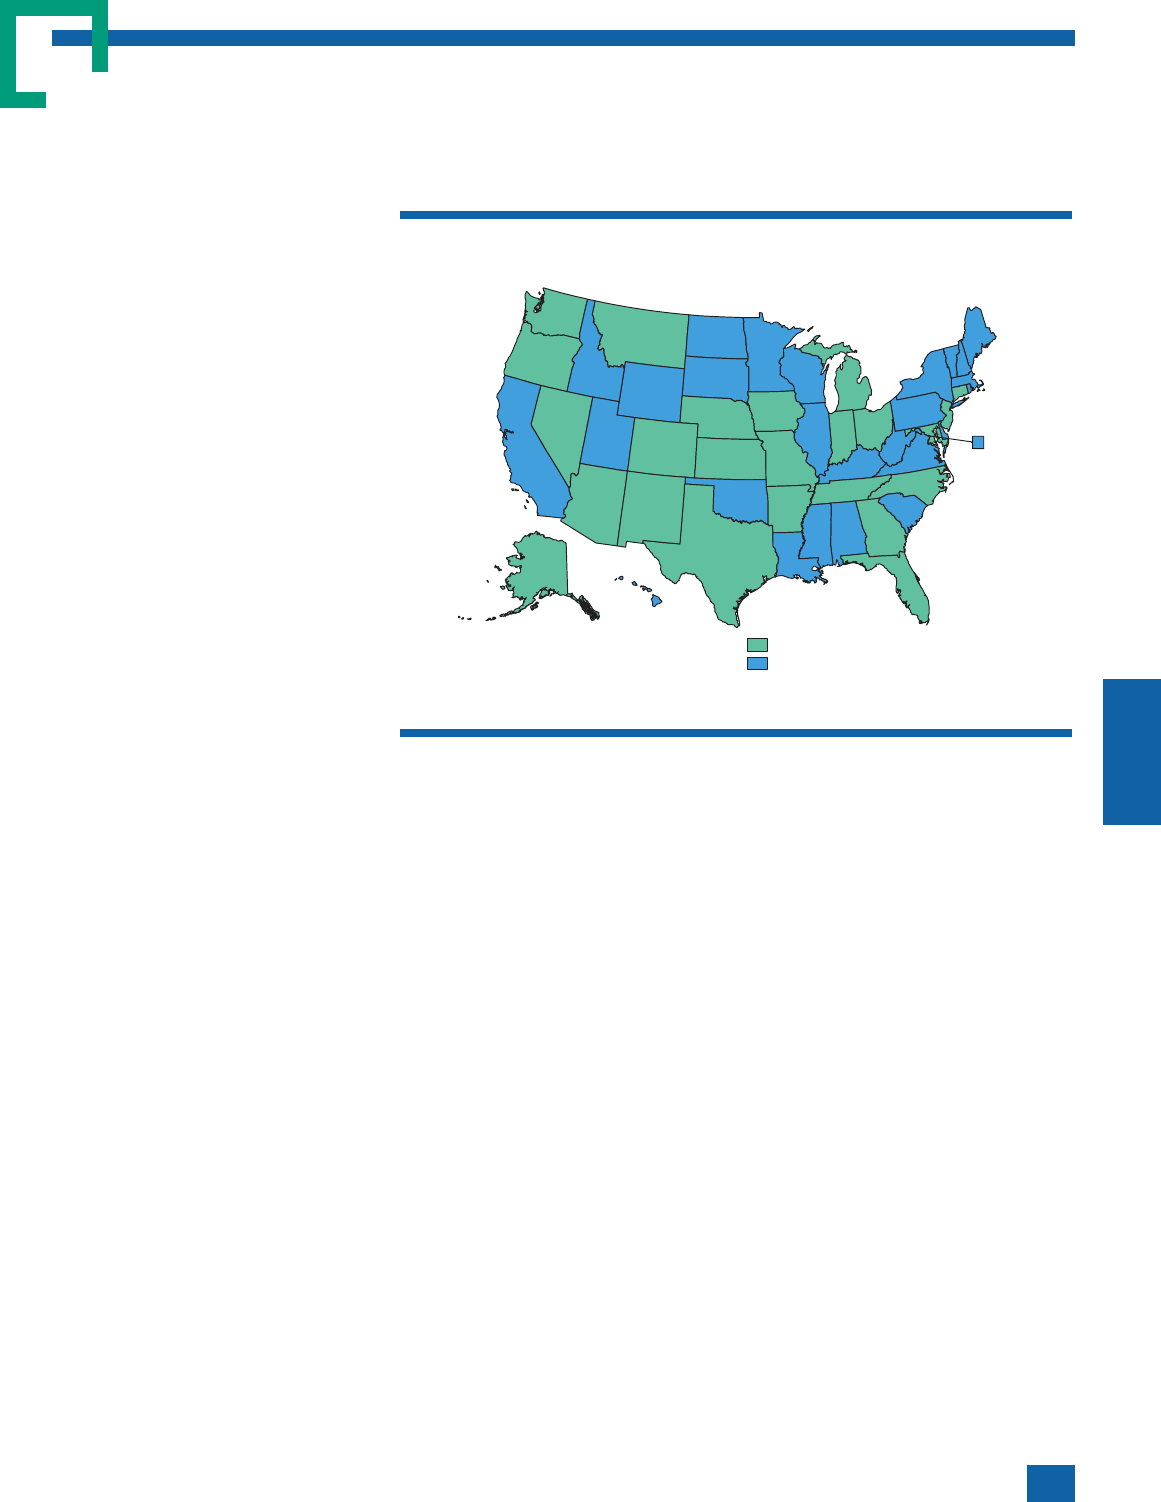
Chapter 4: Juvenile justice system structure and process
93
Once a mainstay of juvenile court, confidentiality has given
way to substantial openness in many states
The first juvenile court was open
to the public, but confidentiality
became the norm over time
The legislation that created the first ju-
venile court in Illinois stated that the
hearings should be open to the public.
Thus, the public could monitor the ac-
tivities of the court to ensure that the
court handled cases in line with com-
munity standards.
In 1920, all but 7 of the 45 states that
established separate juvenile courts per-
mitted publication of information
about juvenile court proceedings. The
Standard Juvenile Court Act, first pub-
lished in 1925, did not ban the publi-
cation of juveniles’ names. By 1952,
however, many states that adopted the
Act had statutes that excluded the gen-
eral public from juvenile court pro-
ceedings. The commentary to the
1959 version of the Act referred to the
hearings as “private, not secret.” It
added that reporters should be permit-
ted to attend hearings with the under-
standing that they not disclose the
identity of the juvenile. The rationale
for this confidentiality was “to prevent
the humiliation and demoralizing ef-
fect of publicity.” It was also thought
that publicity might propel youth into
further delinquent acts to gain more
recognition.
As juvenile courts became more for-
malized and concerns about rising ju-
venile crime increased, the pendulum
began to swing back toward more
openness. By 2010, statutes in 38
states permitted the public to attend
certain hearings in delinquency mat-
ters.
In 2019, there were 24 states with
statutes allowing delinquency adjudica-
tion hearings to be generally open to
the public. In the remaining 26 states
and the District of Columbia the pub-
lic is restricted from attending delin-
quency adjudication hearings, although
there may be limited exceptions.
Delinquency adjudication hearings are closed to the public in more than
half of states
Source: Authors’ adaptation of the Juvenile Law Center’s
Failed Policies, Forfeited Futures
.
Open to the public (24 states)
Closed to the public, with
limited exceptions (27 states)
Adjudication hearings, 2019
DC
Most states specify exceptions to
confidentiality of juvenile court
records
Although legal and social records
maintained by juvenile courts have tra-
ditionally been confidential, legislatures
have made significant changes over the
past decades in how the justice system
treats information about youth in de-
linquency proceedings. Juvenile court
records are generally available to law
enforcement (including prosecutors)
and court personnel (including proba-
tion) for planning purposes to ensure
youth are provided treatment and re-
habilitative services. Records are also
available to the youth, their attorney,
and their parents/guardian. In almost
every state, the juvenile code specifies
other agencies or individuals allowed
access to such records.
Many states have school notification
laws. Under these statutes, schools are
notified when students are involved in
the justice system. Some states limit
notification to adjudication or serious
charges.
After the case is closed, juvenile
record access can lead to severe
collateral consequences
Juvenile records often follow youth
well into adulthood and create barriers
to employment and education. Public
knowledge of a youth’s justice system
involvement works against the juvenile
justice objective of rehabilitation by
limiting the youth’s ability to pursue
personal and professional goals. Public
access to juvenile record information
can have substantial collateral conse-
quences for youth, leading to the deni-
al of secondary education, housing,
employment, military service, and cer-
tain government benefits.
Juvenile record expungement or
sealing can reduce the collateral
consequences of a past case
Protecting youth’s confidentiality in-
cluding their records is at the heart of
the juvenile justice system’s rehabilita-
tive aim. All states allow at least some
juvenile records to be sealed—removed
from public view or removed from
view for some or all system actors—or

Youth and the Juvenile Justice System: 2022 National Report
94
expunged—permanently deleted or de-
stroyed. The majority of those provi-
sions allow records to be unsealed to
inform future investigation or prosecu-
tion. Some statutes use the term ex-
pungement but describe sealing. Some
states rely on confidentiality laws and
have no sealing or expungement provi-
sions. Some states only expunge or seal
records of nonjudicial cases, others
only expunge or seal arrest records not
court records.
In some states, sealing happens auto-
matically after a specified amount of
time crimefree, but in most jurisdic-
tions the youth must petition the court
to request their records be sealed or
expunged even if the charges were
dropped or they were found not guilty.
The process is often complicated, ex-
pensive, and may require an attorney.
Research often relies on the use
of confidential juvenile records
In many states, records that are ex-
punged or sealed are not available for
research or descriptive caseload statis-
tics. In some states, the records are
available for caseload statistics, but are
deidentified and cannot be connected
to any future case activity by research-
ers conducting research requiring detail
on recidivism/subsequent offending.
As part of juvenile justice reform ef-
forts, several states have expanded pro-
visions for expungement or sealing of
juvenile court records. States are also
increasing the use of risk/needs assess-
ments and evidence-based programs
and practices. States must calculate
rates of reoffending to validate risk/
needs assessment instruments and eval-
uate programs and practices to deter-
mine what is effective. Deleting, de-
stroying, or de-identifying records can
confuse those calculations. If recidivism
is calculated without crimefree youth
included because their records are no
longer available, the resulting reoffend-
ing rates could be substantially higher
than if crimefree youth are included.
Most states allow juvenile court records to be made available to certain
other government agencies
Source: Authors’ adaptation of the Juvenile Law Center’s
Failed Policies, Forfeited Futures
.
DC
Completely confidential (other than to the youth or their
attorney or court or law enforcement personnel (1 state)
Delinquency juvenile court
records confidentiality, 2019
Available to others only by court order (6 states)
Available to school or other government agencies
(corrections personnel, social services agencies) (35 states)
Available to any others (media, employers, etc.) (9 states)
Most states allow at least some juvenile records to be sealed (at least
from public view), but those records may later be unsealed
Source: Authors’ adaptation of the Juvenile Law Center’s
Failed Policies, Forfeited Futures
.
DC
Expungement (records destroyed) (19 states)
Sealed from all but not destroyed (29 states)
Sealed from public and not destroyed (3 states)
Availability of sealing
or expungement, 2019

Chapter 4: Juvenile justice system structure and process
95
All states allow certain juveniles to be tried in criminal court
or otherwise face adult sanctions
Transferring juveniles to criminal
court is not a new phenomenon
Juvenile courts have always had mech-
anisms for removing youth charged
with the most serious offenses from
the juvenile justice system. Traditional
transfer laws establish provisions and
criteria for trying certain youth of ju-
venile age in criminal court. Blended
sentencing laws are also used to im-
pose a combination of juvenile and
adult criminal sanctions on some youth
of juvenile age.
Transfer laws address which court (ju-
venile or criminal) has jurisdiction over
certain cases involving youth charged
with law violations. State transfer pro-
visions are typically limited by age and
offense criteria. Transfer mechanisms
vary regarding where the case initiates
and where responsibility for transfer
decisionmaking lies. Transfer provi-
sions fall into the following three gen-
eral categories.
Judicial waiver: In 47 states in 2019,
the juvenile court judge had the au-
thority to waive juvenile court jurisdic-
tion and transfer the case to criminal
court for at least some cases. States
may use terms other than judicial waiv-
er. Some call the process certification,
remand, or bind over for criminal
prosecution. Others transfer or decline
rather than waive jurisdiction.
Statutory exclusion: In 2019, 27
states had statutes that exclude certain
youth from juvenile court jurisdiction.
Under statutory exclusion provisions,
cases originate in criminal rather than
juvenile court. Statutory exclusion is
also known as legislative exclusion.
Prosecutorial discretion: In 14 states
in 2019, original jurisdiction for cer-
tain cases was shared by both criminal
and juvenile courts, and the prosecutor
has the discretion to file such cases in
either court. When the prosecutor de-
cides to “transfer” a case it originates
in criminal court. Transfer under pros-
ecutorial discretion provisions is also
known as prosecutorial waiver, concur-
rent jurisdiction, or direct file.
Most states have “once an adult,
always an adult” provisions
In 35 states, 2019 statutes require that
juveniles who have been tried as adults
must be prosecuted in criminal court
for any subsequent offenses. Nearly all
of these “once an adult, always an
adult” provisions require that the
youth must have been convicted of the
offenses that triggered the initial crimi-
nal prosecution.
Reverse waiver and blended
sentencing serve as mitigating
provisions
Even juveniles subject to the more au-
tomatic transfer mechanisms may be
afforded a chance, at some point in the
process, to make an individualized
showing that they belong in the juve-
nile system. Reverse waiver and blend-
ed sentencing are two kinds of mitigat-
ing provisions that serve to inject
individualized consideration into what
would otherwise be automatic or in-
flexible transfer processes.
Reverse waiver. Laws permit criminal
courts to restore transferred youth to
juvenile court for trial or disposition.
In 2019, of the 42 states with manda-
tory judicial waiver, statutory exclu-
sion, or prosecutor discretion provi-
sions, 26 also had provisions that allow
certain transferred youth to petition for
a “reverse.” Two additional states had
reverse provisions that apply to “once
an adult, always an adult” provisions.
Reverse decision criteria often parallel a
state’s discretionary waiver criteria.
Blended sentencing laws address the
correctional system (juvenile or adult)
in which certain youth found guilty of
certain crimes will be sanctioned.
Blended sentencing statutes can be
placed into the following two general
categories.
Juvenile blended sentencing: In
2019, statutes in 15 states gave juve-
nile court the authority to impose
adult criminal sanctions on youth
charged with certain crimes. The ma-
jority of these blended sentencing laws
authorize the juvenile court to com-
bine a juvenile disposition with a crimi-
nal sentence that is suspended. If the
youth successfully completes the juve-
nile disposition and does not commit a
new offense, the criminal sanction is
not imposed. If, however, the youth
does not cooperate or fails in the juve-
nile sanctioning system, the adult crim-
inal sanction is imposed. Juvenile court
blended sentencing gives the juvenile
court the power to send uncooperative
youth to adult prison, broadening the
typical array of juvenile court disposi-
tional options.
Criminal blended sentencing. In
2019, statutes in 23 states allowed
criminal courts sentencing certain
transferred youth to impose sanctions
otherwise available only to youth han-
dled in juvenile court. The juvenile dis-
position may be conditional—the sus-
pended criminal sentence is intended
to ensure good behavior. Criminal
court blended sentencing gives youth
prosecuted in criminal court one last
chance at a juvenile disposition, thus
mitigating the effects of transfer laws
on an individual basis.

Youth and the Juvenile Justice System: 2022 National Report
96
Most states have multiple ways to impose adult sanctions on juveniles charged with a crime
Judicial waiver
Statutory
Prosecutorial
Once an
adult/
always an Reverse
Blended sentencing
State Discretionary Presumptive Mandatory exclusion discretion adult waiver Juvenile Criminal
Number of states 46 12 12 27 14 35 28 15 23
Alabama
QQQ
Alaska
QQ Q QQ
Arizona
Q QQQQ
Arkansas
QQQQQ
California
QQQQ
Colorado
Q Q Q QQQ Q
Connecticut
Q Q QQQ Q
Delaware
Q QQQQQ
Dist. of Columbia
QQ QQ
Florida
QQQQ
Georgia
QQQQQ
Hawaii
QQ
Idaho
QQQQ
Illinois
QQ Q QQ
Indiana
QQQQQQQ
Iowa
QQQQQ
Kansas
QQQ
Kentucky
QQ QQ
Louisiana
QQQQ
Maine
QQ Q
Maryland
QQQQ
Massachusetts
QQQ
Michigan
QQQQQ
Minnesota
QQ Q Q Q
Mississippi
QQQQ
Missouri
QQQ
Montana
QQ QQQ
Nebraska
QQQQ
Nevada
QQ Q QQ
New Hampshire
QQ Q
New Jersey
QQ
New Mexico
QQQ
New York
QQ
North Carolina
QQ QQ
North Dakota
QQQ Q
Ohio
Q Q QQQ
Oklahoma
Q QQQQ Q
Oregon
QQQQ
Pennsylvania
QQ Q QQ
Rhode Island
QQ Q Q
South Carolina QQQ
South Dakota QQQQ
Tennessee QQQ
Texas QQQ
Utah QQ Q Q
Vermont QQQQ
Virginia QQQQQQ
Washington QQQ
West Virginia QQ Q
Wisconsin QQQQQ
Wyoming QQQ
Q
In states with a combination of provisions for transferring juveniles to criminal court, the exclusion, mandatory waiver, or pros-
ecutorial discretion provisions generally target the oldest youth and/or those charged with the most serious offenses, whereas
younger youth and/or those charged with relatively less serious offenses may be eligible for discretionary waiver.
Note: Table information is as of the end of the 2019 legislative session.
Source: Authors’ adaptation of OJJDP’s
Statistical Briefing Book
.

Chapter 4: Juvenile justice system structure and process
97
In most states, age and offense criteria limit transfer
provisions
Judicial waiver remains the most
common transfer provision
As of the end of the 2019 legislative
session, a total of 47 states have laws
designating some category of cases in
which waiver of jurisdiction by juvenile
court judges transfers certain cases to
criminal court. Such action is usually in
response to a request by the prosecu-
tor. In several states, however, juveniles
or their parents may request judicial
waiver. In most states, waiver is limited
by age and offense boundaries.
Waiver provisions vary in terms of the
degree of decisionmaking flexibility al-
lowed. The decision may be entirely
discretionary, there may be a rebutta-
ble presumption in favor of waiver, or
it may be a mandatory decision. Man-
datory decisions arise when a law or
provision requires a judge to waive the
child after certain statutory criteria
have been met. Most states set a mini-
mum threshold for eligibility, but these
are often quite low. In a few states,
prosecutors may ask the court to waive
virtually any juvenile delinquency case.
Nationally, the proportion of juvenile
cases in which waiver was granted was
less than 1% of petitioned delinquency
cases in 2019. The number of cases
waived in 2019 (3,300) was 75% less
than the number waived in 1994
(13,000), which was the peak year.
Some statutes establish waiver
criteria other than age and offense
In some states, waiver provisions target
youth charged with offenses involving
firearms or other weapons. Most state
statutes also limit judicial waiver to
youth who are no longer “amenable to
treatment.” The specific factors that
determine lack of amenability vary, but
they typically include the youth’s will-
ingness to participate in treatment and
previous dispositional outcomes. Such
amenability criteria are generally not
included in statutory exclusion or con-
current jurisdiction provisions.
In most states, juvenile court judges may waive jurisdiction over
certain cases and transfer them to criminal court
Judicial waiver offense and minimum age criteria, 2019
State
Any
criminal
offense
Certain
felonies
Capital
crimes Murder
Certain
person
offenses
Certain
property
offenses
Certain
drug
offenses
Certain
weapon
offenses
Alabama 14
Alaska NS NS
Arizona NS
Arkansas 14 14 14 14 14
California 16
Colorado 12 12 12 12
Connecticut 15 15 15 15
Delaware NS 14
Dist. of Columbia 15 15 15 15 15 NS
Florida 14
Georgia 15 13 13
Hawaii 14 NS
Idaho 14 NS NS NS NS
Illinois 13 15
Indiana NS 12 16
Iowa 12 10
Kansas 14
Kentucky 14 14
Louisiana 14 14
Maine NS NS NS NS
Maryland 15 NS
Michigan 14
Minnesota 14
Mississippi 13
Missouri 12
Nebraska 16 14
Nevada 16 14 13 16
New Hampshire 15 13 13 15
New Jersey 15 15 15 15 15 15 15
North Carolina 13 13
North Dakota 14 14 14 14 14
Ohio 14 14 16 16
Oklahoma NS
Oregon 15 15 NS NS 15
Pennsylvania 14 14 14 14
Rhode Island 16 NS
South Carolina 17 14 NS NS 14 14
South Dakota NS
Tennessee 14
Texas 14 14 14
Utah 14 16 16 16 16
Vermont 16 12 12 12
Virginia 14 14 14
Washington NS
West Virginia NS NS NS NS NS
Wisconsin 15 14 14 14 14 14
Wyoming NS
Notes: An entry in the column below an offense category means that there is at least one offense
in that category for which a juvenile may be waived from juvenile court to criminal court. The num-
ber indicates the youngest possible age at which a juvenile accused of an offense in that category
may be waived. “NS” means no age restriction is specified for an offense in that category. Table in-
formation is as of the end of the 2019 legislative session.
Source: Authors’ adaptation of OJJDP’s
Statistical Briefing Book
.
Many statutes instruct juvenile courts
to consider other factors when making
waiver decisions, such as the youth’s
offense history, the availability of dis-
positional treatment alternatives, the
time available for sanctions, public
safety, and the best interest of the
child. The waiver process must also

Youth and the Juvenile Justice System: 2022 National Report
98
adhere to constitutional principles of
due process of
Kent v. United States
(1966).
The surge in violence that peaked
in 1994 helped shape current
transfer laws
State transfer laws in their current form
are largely the product of a period of
intense legislative activity that began in
the latter half of the 1980s and contin-
ued through the end of the 1990s.
Prompted in part by public concern
and media focus on the rise in violent
youth crime that began in 1987 and
peaked in 1994, legislatures in nearly
every state revised or rewrote their laws
to lower thresholds and expand eligi-
bility for transfer, shift transfer deci-
sionmaking authority from judges to
prosecutors, and replace individualized
attention with broad automatic and
categorical mechanisms.
Between 1986 and the end of the cen-
tury, the number of states with auto-
matic transfer laws jumped from 20 to
38, and the number with prosecutorial
discretion laws rose from 7 to 15.
Moreover, many states that had auto-
matic or prosecutor controlled transfer
statutes expanded their coverage drasti-
cally. In Pennsylvania, for example, an
automatic transfer law had been in
place since 1933 but had applied only
to murder charges. Amendments that
took place in 1996 added a long list of
violent offenses to this formerly narrow
statutory exclusion.
Transfer laws giving prosecutors
discretion to file in juvenile or
criminal court are least common
As of the end of the 2019 legislative
session, 14 states had prosecutorial dis-
cretion provisions, which gave both ju-
venile and criminal courts original ju-
risdiction in certain cases. Under such
provisions, prosecutors have discretion
to file eligible cases in either court.
Prosecutorial discretion is typically lim-
ited by age and offense criteria focus-
ing on cases involving violent or repeat
crimes or weapons offenses. These stat-
utes are usually silent regarding stan-
dards, protocols, or considerations for
decisionmaking, and no national data
exists on the number of youth tried in
In states with concurrent jurisdiction, the prosecutor has discretion
to file certain cases in either criminal or juvenile court
Prosecutorial discretion offense and minimum age criteria, 2019
State
Any
criminal
offense
Certain
felonies
Capital
crimes Murder
Certain
person
offenses
Certain
property
offenses
Certain
drug
offenses
Certain
weapon
offenses
Arizona 14
Arkansas 16 14 14 14
Colorado 16 16 16
Delaware 16
Dist. of Columbia 16 16 16 16 16
Florida 16 16 14 14 14 14
Georgia NS 13 13
Louisiana 15 15 15 15
Michigan 14 14 14 14 14
Montana 12 12 16 16 16
Nebraska 17 14
Oklahoma 16 15 15 15 16 15
Virginia 14 14 14
Wyoming 13 14 14 14 14
Notes: An entry in the column below an offense category means that there is at least one offense
in that category that is subject to criminal prosecution at the option of the prosecutor. The number
indicates the youngest possible age at which a juvenile accused of an offense in that category is
subject to criminal prosecution. “NS” means no age restriction is specified for an offense in that
category. Table information is as of the end of the 2019 legislative session.
Source: Authors’ adaptation of OJJDP’s
Statistical Briefing Book
.
criminal court under prosecutorial dis-
cretion provisions.
State appellate courts have taken the
view that prosecutorial discretion is
equivalent to the routine charging de-
cisions prosecutors make in criminal
cases. Prosecutorial discretion in charg-
ing is considered an executive function,
which is not subject to judicial review
and does not have to meet the due
process standards established by the
Supreme Court. Some states, however,
do have written guidelines for prosecu-
torial discretion.
Statutory exclusion accounts for
the largest number of transfers
Legislatures transfer large numbers of
youth to criminal court by enacting
statutes that exclude certain cases from
original juvenile court jurisdiction. As
of the end of the 2019 legislative ses-
sion, 27 states had statutory exclusion
provisions. State laws typically set age
and offense limits for excluded offens-
es. The offenses most often excluded
are murder, capital crimes, and other
serious person offenses. (Minor offens-
es such as wildlife, traffic, and water-
craft violations are often excluded from
juvenile court jurisdiction in states
where they are not covered by concur-
rent jurisdiction provisions.)
Exclusion laws and prosecutors
transfer more cases than do
juvenile court judges
Based on data from 11 states with
transfer laws other than judicial waiver
provisions, 4,900 youth were prosecut-
ed in criminal court under those laws.
Applying that case rate to the youth
population in the 24 other states with
such laws that do not make data pub-
lic, results in a rough estimate of 4,000
youth. Thus, approximately 8,900
youth younger than 18 were prosecut-
ed in criminal court under statutory
exclusion and prosecutor discretion
laws. In comparison, 3,300 cases were
transferred to criminal court by juve-
nile court judges.

Chapter 4: Juvenile justice system structure and process
99
Jurisdictional age laws may
transfer as many as 40,800
additional youth to criminal court
Although not typically thought of as
transfers, large numbers of youth
younger than age 18 are tried in crimi-
nal court. States have always been free
to define the respective jurisdictions of
their juvenile and criminal courts.
Nothing compels a state to draw the
line between juvenile and adult at age
18. In 8 states, the upper age of juve-
nile court jurisdiction during 2019 was
set at 15 or 16 and youth could be
held criminally responsible at age 16 or
17, respectively. The number of youth
younger than 18 prosecuted as adults
in these states can only be estimated.
To estimate the number of youth
younger than 18 prosecuted in crimi-
nal court in these states, a study by
Puzzanchera et al. used 2019 delin-
quency petition rates—that is, the rates
at which youth are formally processed
in juvenile court. Specifically, national
age/sex/race petition rates were devel-
oped for delinquency cases based on
estimates developed by the National
Juvenile Court Data Archive. These
rates were applied to corresponding
age/sex/race population estimates for
each of these 8 states. The resulting
counts for each state were summed to
produce an estimate of the number of
cases involving 16- and 17-year-olds
subject to criminal court processing in
these 8 states. Using population and
delinquency case estimates, an estimat-
In states with statutory exclusion provisions, certain serious offenses
are excluded from juvenile court jurisdiction
Statutory exclusion offense and minimum age criteria, 2011
State
Any
criminal
offense
Certain
felonies
Capital
crimes Murder
Certain
person
offenses
Certain
property
offenses
Certain
drug
offenses
Certain
weapon
offenses
Alabama 16 16 16 16
Alaska 16 16 16 16 16
Arizona 15 15 15 15 15
Delaware NS NS NS NS 16
Georgia 13 13
Idaho 14 14 14 14
Illinois 16 16
Indiana 16 16 16 16
Iowa 17 16 16 16
Louisiana 15 15
Maryland 14 16 16 16
Massachusetts 14
Minnesota 16
Mississippi 13 13
Montana NS 17 17 17 17 17
Nevada 16 NS NS NS 16
New Mexico 15
New York 16 16 13 13 14 14
Oklahoma 15 13 15 15 16
Oregon 15 15 15
Pennsylvania NS 15 15
South Carolina 16
South Dakota 16
Utah 16 16 16 16 16
Vermont 14 14 14
Wisconsin 10 10
Notes: An entry in the column below an offense category means that there is at least one offense
in that category that is excluded from juvenile court jurisdiction. The number indicates the youngest
possible age at which a juvenile accused of an offense in that category is subject to exclusion.
“NS” means no age restriction is specified for an offense in that category. Table information is as of
the end of the 2019 legislative session.
Source: Authors’ adaptation of OJJDP’s
Statistical Briefing Book
.
ed 40,800 cases involving youth
younger than 18 were subject to crimi-
nal court processing in 2019 in states
with an upper age threshold younger
than the 18th birthday.
This estimate is based on an assump-
tion that juvenile and criminal courts
would respond in the same way to sim-
ilar offending behavior. It is possible
that some conduct that would be con-
sidered serious enough to merit formal
processing in juvenile court—such as
vandalism, minor thefts, and low-level
public order offenses—would not re-
ceive similar handling in criminal court.
Many states allow transfer of
certain very young youth
In 21 states, no minimum age is speci-
fied in at least one judicial waiver, con-
current jurisdiction, or statutory exclu-
sion provision for transferring juveniles
to criminal court. For example, Penn-
sylvania’s murder exclusion has no
specified minimum age. Other transfer
provisions in Pennsylvania have age
minimums set at 14 and 15. Among
states where statutes specify age limits
for all transfer provisions, age 14 is the
most common minimum age specified
across provisions.
Minimum transfer age specified in statute,
2019:
Age State
None Alaska, Arizona, Delaware, District of
Columbia, Georgia, Hawaii, Idaho,
Indiana, Maine, Maryland, Montana,
Nevada, Oklahoma, Oregon,
Pennsylvania, Rhode Island, South
Carolina, South Dakota, Washington,
West Virginia, Wyoming
10 Iowa, Wisconsin
12 Colorado, Missouri, Vermont
13 Illinois, Mississippi, New Hampshire,
New York, North Carolina
14 Alabama, Arkansas, Florida, Kansas,
Kentucky, Louisiana, Massachusetts,
Michigan, Minnesota, Nebraska, North
Dakota, Ohio, Tennessee, Texas,
Utah, Virginia
15 Connecticut, New Jersey, New
Mexico
16 California

Youth and the Juvenile Justice System: 2022 National Report
100
From 2004 to 2019, most states made changes to their
transfer laws—many narrowing the path to criminal court
30 states changed their transfer
laws between 2004 and 2019
Despite the steady decline in youth
crime and violence rates since the mid-
1990s, in 21 states transfer provisions
remained essentially unchanged be-
tween 2004 and 2019. Among the 30
states making changes to the laws con-
trolling youth transfer to criminal
court, most made changes that nar-
rowed the pool of youth eligible for
transfer. There were 16 states that only
enacted changes that narrowed the eli-
gibility criteria for transfer to criminal
court. These included changes like
“raise the age” reforms which impact
all youth in a given age group, increas-
es in upper or lower age limits, reduc-
tions in the offenses in transfer laws,
removing transfer provisions, or adding
reverse transfer provisions.
Among states that made changes, seven
only made changes that expanded
transfer criteria, such as adding provi-
sions, lowering age limits, or adding
offense categories. There were seven
additional states that made changes in
both directions. For example, New
York raised the upper age of original
juvenile court jurisdiction and expand-
ed their exclusion provisions by adding
offenses and lowering the minimum
age for some.
The net effect is that more states rolled
back provisions—narrowing the criteria
enabling youth to end up in criminal
court. In 2019, there were an estimat-
ed 53,000 youth younger than 18 tried
in criminal court. That figure was
down 64% from the 2005 estimate.
Since 2004, more states have narrowed their transfer provisions than expanded them, contributing to a
reduction in the number of youth eligible to be tried as adults in criminal court
Source: Authors analysis of state statutes and OJJDP’s
Statistical Briefing Book
.
Essentially unchanged (21 states)
Narrowed only (16 states)
Both narrowed and expanded (7 states)
Expanded only (7 states)
Transfer law changes, 2004–2019
DC

Chapter 4: Juvenile justice system structure and process
101
Few juveniles enter the federal justice system
There is no separate federal
juvenile justice system
Youth younger than 18 who are arrest-
ed by federal law enforcement agencies
may be prosecuted and sentenced in
U.S. District Courts and even commit-
ted to the Federal Bureau of Prisons.
The Federal Juvenile Delinquency Act,
Title 18 U.S.C. 5031, lays out the def-
initions of a juvenile and juvenile delin-
quency as well as the procedures for
the handling of juveniles accused of
crimes against the U.S. Although it
generally requires that youth be turned
over to state or local authorities, there
are limited exceptions.
Juveniles initially come into federal law
enforcement custody in a variety of
ways. The federal agencies that arrest
the most young people are the Border
Patrol, Drug Enforcement Agency,
U.S. Marshals Service, and FBI. In
2019, there were a total of 218 youth
younger than 18 arrested by federal
agencies. That figure was slightly fewer
than the average for the 2010–2019
period (219.5). The peak during that
period was 384 in 2011, which was
driven by a spike in drug arrests.
Federal prosecutors may retain
certain serious cases
Following a federal arrest of a person
younger than 21, federal law requires
an investigation to determine whether
the offense was a delinquency offense
under state law. If so, and if the state is
willing and able to deal with the youth,
the federal prosecutor may forego
prosecution and surrender the youth to
state authorities. However, a case may
instead be “certified” by the Attorney
General for federal delinquency prose-
cution, if one of the following condi-
tions exists: (1) the state does not have
or refuses to take jurisdiction over the
case; (2) the state does not have ade-
quate programs or services for the
needs of the youth; or (3) the youth is
charged with a violent felony, drug
trafficking, or firearms offense and the
case involves a “substantial federal in-
terest.”
A case certified for federal delinquency
prosecution is heard in U.S. District
Court by a judge sitting in closed ses-
sion without a jury. Following a find-
ing of delinquency, the court has dis-
position powers similar to those of
state juvenile courts. For instance, it
may order the youth to pay restitution,
serve a period of probation, or under-
go “official detention” in a correction-
al facility. Generally, neither probation
nor official detention may extend be-
yond the youth’s 21st birthday or the
maximum term that could be imposed
on an adult convicted of an equivalent
offense, whichever is shorter. But for
juveniles who are between ages 18 and
21 at the time of sentencing, official
detention for certain serious felonies
may last up to 5 years.
A juvenile in the federal system
may also be “transferred” for
criminal prosecution
When proceedings in a federal case in-
volving a juvenile are transferred for
criminal prosecution, they actually re-
main in district court but are governed
by federal criminal laws rather than
state laws or the Juvenile Justice and
Delinquency Prevention Act. Federal
law authorizes transfer at the written
request of a youth of at least age 15
who is alleged to have committed an
offense after attaining the age of 15 or
upon the motion of the Attorney Gen-
eral in a qualifying case where the
court finds that “the interest of jus-
tice” requires it. Qualifying cases in-
clude those in which a youth is
charged with (1) a violent felony or
drug trafficking or importation offense
committed after reaching age 15; (2)
murder or aggravated assault commit-
ted after reaching age 13; or (3) pos-
session of a firearm during the com-
mission of any offense after reaching
age 13. However, transfer is mandatory
in any case involving a youth age 16 or
older who was previously found guilty
of a violent felony or drug trafficking
offense and who is now accused of
committing a drug trafficking or im-
portation offense or any felony involv-
ing the use, attempted use, threat, or
substantial risk of force.
In 2019, immigration arrests remained a large share of federal arrests of
youth younger than 18
Source: Authors’ analysis of BJS’
Federal Criminal Case Processing Statistics
data tool for 2015
through 2019.
2015 2016 2017 2018 2019
0
10
20
30
40
50
60
Youth younger than 18 arrested and booked by federal agencies
Immigration
Violent
Public order
Supervision
violation
Drugs
Pr
operty

Youth and the Juvenile Justice System: 2022 National Report
102
Sources
Annie E. Casey Foundation. 2018.
Transforming Probation: A Vision for
Getting it Right
. Baltimore, MD:
AECF. Available at www.aecf.org/
resources/transforming-juvenile-
probation.
Bonnie, R., Johnson, R., Chemers, B.
and Schuck, J. (eds). 2013.
Reforming
Juvenile Justice: A Developmental Ap-
proach
. Washington, DC: National Re-
search Council, National Academies of
Sciences. Available at www.nap.edu/
catalog.php?record_id=14685
Bureau of Justice Statistics. 2022. Fed-
eral Criminal Case Processing Statistics
Data Tool. Available at www.bjs.gov/
fjsrc/index.cfm.
Coleman, A. 2020.
Expunging Juve-
nile Records: Misconceptions, Collater-
al Consequences, and Emerging Prac-
tices
. Washington, DC: OJJDP.
Available at ojjdp.ojp.gov/publications/
expunging-juvenile-records.pdf
Federal Bureau of Investigation. 2021.
Crime in the United States 2019
.
Table 68. Available at ucr.fbi.gov/
crime-in-the-u.s/2019/crime-in-the-
u.s.-2019/topic-pages/tables/table-
68.
Fowler, J., and Anderson, R. 2013.
The Pennsylvania Juvenile Justice Re-
cidivism Report: Juveniles with Cases
Closed in 2007, 2008, or 2009
. Penn-
sylvania’s Juvenile Court Judges’ Com-
mission. Available at www.jcjc.state.
pa.us/portal/server.pt/community/
jcjc_home/5030.
General Assembly of North Carolina.
Session Law 2017-57, Senate Bill 257.
Godfrey, K. 2019.
Initiative to Devel-
op Juvenile Reentry Measurement
Standards, Final Technical Report
.
Braintree, MA: PbS Learning Institute,
Inc.
Griffin, P., Addie, S., Adams, B., and
Firestine, K. 2011. Trying Juveniles as
Adults: An Analysis of State Transfer
Laws and Reporting.
Juvenile Offend-
ers and Victims: National Report Series
Bulletin
. Washington, DC: U.S. De-
partment of Justice, Office of Justice
Programs, Office of Juvenile Justice
and Delinquency Prevention.
Griffin, P., and Torbet, P. (eds.). 2002.
Desktop Guide to Good Juvenile Pro-
bation Practice
. Pittsburgh, PA: Na-
tional Center for Juvenile Justice.
Harris, P., Lockwood, B., and
Mengers, L. 2009.
A CJCA White
Paper: Defining and Measuring Recidi-
vism
. Available at www.cjca.net.
Howard Jimmy Davis
v.
State of Mary-
land
. 2021 COA-REG-0051-2020.
Case No. 03-K-17-001763.
Davis
v.
State
, No. 2014, (Md. Ct. Spec. App.
Oct. 9, 2020).
Hutzler, J. 1983. Canon to the Left,
Canon to the Right: Can the Juvenile
Court Survive?
Today’s Delinquent
.
Pittsburgh, PA: National Center for
Juvenile Justice.
Juvenile Justice and Delinquency Pre-
vention Act of 1974, Public Law 93–
415, 18 U.S.C. § 5032, as amended.
Juvenile Justice and Delinquency Pre-
vention Act of 1974, Public Law 93–
415, 42 U.S.C. § 5601, as amended.
Juvenile Justice Reform Act. HR 6964.
2018, Public Law 115-385. Available
at www.congress.gov/bill/115th-
congress/house-bill/6964/text.
Juvenile Law Center. 2014.
Failed Pol-
icies, Forfeited Futures: Revisiting a
Nationwide Scorecard on Juvenile Re-
cords
. Philadelphia, PA: Juvenile Law
Center.
Juvenile Law Center. 2020.
Failed Pol-
icies, Forfeited Futures: Revisiting a
Nationwide Scorecard on Juvenile Re-
cords
. Philadelphia, PA: Juvenile Law
Center. Available at juvenilerecords.jlc.
org/juvenilerecords/#!/map.
Kuhn, J. 1989.
A Digest of Cases of
the United States Supreme Court as to
Juvenile and Family Law, 1962–July
1988
. Reno, NV: National Council of
Juvenile and Family Court Judges.
Kuhn, J. 1990.
Supplement to a Digest
of Cases of the United States Supreme
Court as to Juvenile and Family Law,
Addressing the 1988–1990 Terms
.
Reno, NV: National Council of Juve-
nile and Family Court Judges.
Louisiana Act No. 501, Sentate Bill
No. 324.
Maloney, D., Romig, D., and Arm-
strong, T. 1988. Juvenile Probation:
The Balanced Approach.
Juvenile &
Family Court Journal
, 39(3).
McNamee, G. (ed.). 1999.
A Noble
Experiment? The First 100 Years of the
Cook County Juvenile Court: 1899–
1999
. Chicago, IL: The Chicago Bar
Association with the Children’s Court
Centennial Committee.
Miller
v.
Alabama
, 132 S. Ct. 2455
(2012).
Motivans, M. 2021.
Federal Justice
Statistics, 2019
. Washington, DC: Bu-
reau of Justice Statistics.
National Alliance on Mental Illness.
2020. FCC Designates 988 As A Na-
tionwide Mental Health Crisis And
Suicide Prevention Number. Available
at www.nami.org/About-NAMI/NA-
MI-News/2020/FCC-Designates-
988-as-a-Nationwide-Mental-Health-
Crisis-and-Suicide-Prevention-Number.

Chapter 4: Juvenile justice system structure and process
103
National Center for Juvenile Justice.
2021. Juvenile Justice GPS (Geogra-
phy, Policy, Practice & Statistics).
Available at www.jjgps.org/juvenile-
justice-services#risk-assessment?year=
2020.
National Center for Juvenile Justice.
2021. Juvenile Justice GPS (Geogra-
phy, Policy, Practice & Statistics).
Available at www.jjgps.org/status-
offense-issues#labeling.
National Center for Juvenile Justice.
2021.
National Juvenile Court Data
Archive: Juvenile Court Case Records
2019
[machine-readable data file].
Pittsburgh, PA: NCJJ [producer].
National Council on Crime and Delin-
quency. 1959.
Standard Juvenile Court
Act: Sixth Edition
. New York, NY:
NCCD.
National Suicide Hotline Designation
Act of 2020. Public Law No: 116-172.
New York State Senate. Assembly Bill
A3009C.
Office of Juvenile Justice and Delin-
quency Prevention. Juvenile Justice
System Structure & Process. Statistical
Briefing Book. Available at www.ojjdp.
gov/ojstatbb/structure_process/faqs.
asp [released April 18, 2022.]
Puzzanchera, C., and Hockenberry, S.
2021.
Juvenile Court Statistics 2019
.
Pittsburgh, PA: National Center for
Juvenile Justice.
Puzzanchera, C., Sickmund, M., and
Hurst, H. 2021.
Youth Younger Than
18 Prosecuted in Criminal Court: Na-
tional Estimate, 2019 Cases
. Pitts-
burgh, PA: National Center for Juve-
nile Justice. Available at www.ncjj.org/
pdf/NCJJ_Transfer_estimate_2019.pdf
Puzzanchera, C., Sladky, A., and Kang,
W. 2021.
Easy Access to Juvenile Pop-
ulations: 1990–2020
. Available at
www.ojjdp.gov/ojstatbb/ezapop.
Sheridan, W. 1969.
Legislative Guide
for Drafting Family and Juvenile
Court Acts
. Washington, DC: U.S.
Children’s Bureau.
Sickmund, M. and Puzzanchera, C.
2014.
Juvenile Offenders and Victims:
2014 National Report
. Washington,
DC: U.S. Department of Justice, Of-
fice of Justice Programs, Office of Ju-
venile Justice and Delinquency Preven-
tion.
Sickmund, M., Sladky, A., and Kang,
W. 2021.
Easy Access to Juvenile
Court Statistics: 1985–2019
. Available
at www.ojjdp.gov/ojstatbb/ezajcs.
Smoot, N. 2019. The Juvenile Justice
Reform Act of 2018: Updating the
Federal Approach to Youth Involved,
and At Risk of Becoming Involved, in
the juvenile Justice System.
Juvenile
and Family Court Journal
, 70(3).
Snyder, H., and Sickmund, M. 1995.
Juvenile Offenders and Victims: A Na-
tional Report
. Washington, DC: U.S.
Department of Justice, Office of Jus-
tice Programs, Office of Juvenile Jus-
tice and Delinquency Prevention.
Snyder, H., and Sickmund, M. 1999.
Juvenile Offenders and Victims: 1999
National Report
. Washington, DC:
U.S. Department of Justice, Office of
Justice Programs, Office of Juvenile
Justice and Delinquency Prevention.
Snyder, H., and Sickmund, M. 2006.
Juvenile Offenders and Victims: 2006
National Report
. Washington, DC:
U.S. Department of Justice, Office of
Justice Programs, Office of Juvenile
Justice and Delinquency Prevention.
Snyder, H., Sickmund, M., and Poe
Yamagata, E. 2000.
Juvenile Transfers
to Criminal Court in the 1990’s: Les-
sons Learned from Four Studies
.
Washington, DC: Department of Jus-
tice, Office of Justice Programs, Office
of Juvenile Justice and Delinquency
Prevention.
South Carolina Legislature Act 268
Senate Bill No. 916.
Steinberg, L. 2014.
Age of Opportuni-
ty: Lessons from the New Science of
Adolescence
. New York, NY: Eamon
Dolan/Houghton Mifflin Harcourt.
Szymanski, L. 2010. Are There Some
Juvenile Court Records That Cannot
Be Sealed?
NCJJ Snapshot
. Pittsburgh,
PA: National Center for Juvenile Jus-
tice.
Szymanski, L. 2010. What States Allow
for Open Juvenile Delinquency Hear-
ings?
NCJJ Snapshot
. Pittsburgh, PA:
National Center for Juvenile Justice.
Tanenhaus, D. 2000. The Evolution of
Transfer Out of the Juvenile Court. In
The Changing Borders of Juvenile Jus-
tice
. Chicago, IL: University of Chica-
go Press.
Tanenhaus, D. 2004.
Juvenile Justice
in the Making
. New York, NY: Oxford
University Press.
Taylor, M., Livengood, Z., and Sick-
mund, M. 2020.
Desktop Guide to
Good Juvenile Probation Practice
.
Pittsburgh, PA: National Center for
Juvenile Justice. Available at www.
goodjuvenileprobationpractice.org.
Vermont, Act 201 of 2018. VT ST §§
5102 and 5103.
Weiss, G. 2013.
The Fourth Wave: Ju-
venile Justice Reforms for the Twenty-
first Century
. Washington, DC: Na-
tional Campaign to Reform State
Juvenile Justice Systems.

Youth and the Juvenile Justice System: 2022 National Report
105
Chapter 5
Law enforcement
and youth
5
Law enforcement is the doorway for
most youth who enter the juvenile
justice system. Once a juvenile is ap-
prehended for a law violation, it is the
police officer who first determines if
the juvenile will move deeper into the
justice system or will be diverted.
Law enforcement agencies track the
volume and characteristics of crimes
reported to them and use this infor-
mation to monitor the changing levels
of crime in their communities. Not all
crimes are reported to law enforce-
ment, and many of those that are re-
ported remain unsolved. Law enforce-
ment’s incident-based reporting
systems include characteristics of the
person(s) who committed the crime
as reported by the victim. For these
crimes, even when there is no arrest,
law enforcement records can be used
to develop an understanding of juve-
nile offending. For all other types of
crimes, an understanding of juvenile
involvement comes through the study
of arrest statistics. Arrest statistics can
monitor the flow of juveniles and
adults into the justice system and are
the most frequently cited source of
information on juvenile crime trends.
This chapter describes the volume and
characteristics of juvenile crime from
law enforcement’s perspective. It pres-
ents information on the number and
offense characteristics of juvenile ar-
rests in 2019 and historical trends in
juvenile arrests. This chapter also ex-
amines arrests and arrest trends for fe-
males and youth under age 13 and
compares arrest trends for males and
females and different racial groups. It
includes arrest rate trends for many
specific offenses, including murder and
other violent crimes, property crimes,
and drug and weapons offenses. The
majority of data presented in this
chapter were originally compiled by
the Federal Bureau of Investigation
(FBI) as part of its Uniform Crime
Reporting Program, which includes
the Supplementary Homicide Reports
and the National Incident-Based Re-
porting System. Arrest estimates for
1980–2014 were developed by the
Bureau of Justice Statistics and arrest
estimates for 2015–2019 were devel-
oped by the National Center for Juve-
nile Justice based on data published in
the FBI’s
Crime in the United States
reports for the respective years.

Youth and the Juvenile Justice System: 2022 National Report
106
The FBI’s Uniform Crime Reporting Program monitors law
enforcement’s response to juvenile crime
Police agencies have reported to
the UCR Program since the 1930s
Annually, thousands of police agencies
voluntarily report the following data to
the Federal Bureau of Investigation’s
(FBI’s) Uniform Crime Reporting
(UCR) Program:
Q Number of Index crimes (i.e., mur-
der, rape, robbery, aggravated
assault, burglary, larceny-theft,
motor vehicle theft, and arson)
reported to law enforcement.
Q Number of arrests and the most seri-
ous charge involved in each arrest.
Q Age, sex, and race of persons arrested.
Q Proportion of reported Index crimes
cleared by arrest, and the proportion
of these Index crimes cleared by the
arrest of persons younger than 18.
Q Police dispositions of juvenile arrests.
Q Detailed victim, offender, and cir-
cumstance information in murder
incidents.
What arrest data tell us about kids
and crime
The UCR arrest data provide a sample-
based portrait of the volume and char-
acteristics of arrests in the United
States. Detailed national estimates de-
veloped by the Bureau of Justice Statis-
tics (BJS) for 1980–2014 and the Na-
tional Center for Juvenile Justice
(NCJJ) for 2015–2019 are based on
these sample data. The estimates in-
clude detailed juvenile age groups as
well as details by sex, race, and specific
offenses. The data can be used to ana-
lyze the number and rates of juvenile
arrests within offense categories and
demographic subgroups and to track
changes over various periods. They can
also be used to compare the relative
number of juvenile and adult arrests by
offense categories and demographics
and to monitor the proportion of
crimes cleared by arrests of juveniles.
What do arrest statistics count?
To interpret the material in this chap-
ter properly, the reader needs a clear
understanding of what these statistics
count. Arrest statistics report the num-
ber of arrests that law enforcement
agencies made in a given year—not the
number of individuals arrested nor the
number of crimes committed. The
number of arrests is not the same as
the number of people arrested because
an unknown number of individuals are
arrested more than once during the
year. Nor do arrest statistics represent
the number of crimes that arrested in-
dividuals commit, because a series of
crimes that one person commits may
culminate in a single arrest, and a sin-
gle crime may result in the arrest of
more than one person. This latter situ-
ation, where many arrests result from
one crime, is relatively common in ju-
venile law-violating behavior because
juveniles are more likely than adults to
commit crimes in groups. For this rea-
son, one should not use arrest statistics
to indicate the relative proportions of
crime that juveniles and adults commit.
Arrest statistics are most appropriately
a measure of entry into the justice sys-
tem.
Arrest statistics also have limitations in
measuring the volume of arrests for a
particular offense. Under the UCR
Program, the FBI requires law enforce-
ment agencies to classify an arrest by
the most serious offense charged in
that arrest. For example, the arrest of a
youth charged with aggravated assault
and possession of a weapon would be
reported to the FBI as an arrest for ag-
gravated assault. Therefore, when ar-
The official definition of rape has changed and impacts the
Violent Crime Index
Since 1927, the FBI had defined forc-
ible rape as “the carnal knowledge of
a female, forcibly and against her
will.” Beginning in 2013, the FBI ad-
opted a broader definition of rape:
“Penetration, no matter how slight, of
the vagina or anus with any body part
or object, or oral penetration by a sex
organ of another person, without the
consent of the victim.” Unlike the
definition in place for more than 80
years, the new definition does not re-
quire force and is gender neutral.
Under current reporting practices, law
enforcement agencies may submit
data on rape arrests based on either
the new or legacy definition. Due to
differences in agency reporting prac-
tices, national estimates for the of-
fenses of “rape” and “sex offenses”
are not available after 2012. Addition-
ally, estimates for the Violent Crime
Index (which included “forcible rape”)
are not shown, as this category is no
longer compatible with prior years.
Changes to the definition of rape im-
pact the Violent Crime Index. For
many years, the primary means of as-
sessing trends in violent crime was to
monitor four offenses that law en-
forcement agencies nationwide con-
sistently report. These four crimes—
murder and nonnegligent
manslaughter, forcible rape, robbery,
and aggravated assault—formed the
Violent Crime Index. Due to changes
in the official definition of rape, track-
ing violence through the Violent Crime
Index is no longer tenable, as the
meaning of the included offenses is no
longer consistent before and after
2013. In this chapter, we use a modi-
fied measure of violence that includes
the offenses of murder, robbery, and
aggravated assault. In any given year
prior to the rape definition change,
these three offenses accounted for
more than 95% of arrests for Violent
Crime Index offenses. Note that these
changes do not impact the Property
Crime Index, which includes the of-
fenses of burglary, larceny-theft, motor
vehicle theft, and arson.

Chapter 5: Law enforcement and youth
107
The juvenile proportion of arrests exceeded the juvenile proportion of
crimes cleared by arrest in each offense category
rest statistics show that law enforce-
ment agencies made an estimated
16,080 arrests of young people for
weapons law violations in 2019, it
means that a weapons law violation was
the most serious charge in these
16,080 arrests. An unknown number
of additional arrests in 2019 included a
weapons charge as a lesser offense.
What do clearance statistics count?
Clearance statistics measure the pro-
portion of reported crimes that were
cleared (or “closed”) by either arrest or
other, exceptional means (such as the
death of the offender or unwillingness
of the victim to cooperate). A single
arrest may result in many clearances.
For example, 1 arrest could clear 10
burglaries if the person was charged
with committing all 10 crimes. Or
multiple arrests may result in a single
clearance if a group of people commit-
ted the crime.
For those interested in juvenile justice
issues, the FBI also reports the propor-
tion of clearances that involved arrests
of only persons younger than age 18.
This statistic is a better indicator of the
proportion of crime that this age
group commits than is the proportion
of arrests, although there are some
concerns that even the clearance statis-
tic overestimates the proportion of
crimes that juveniles commit. Research
has shown that juvenile offenders are
more easily apprehended than adult of-
fenders; thus, the juvenile proportion
of clearances probably overestimates
juveniles’ responsibility for crime.
To add to the difficulty in interpreting
clearance statistics, the FBI’s current
reporting guidelines require that clear-
ances involving both juveniles and
adults be classified as clearances for
crimes that adults commit. Because the
juvenile clearance proportions include
only those clearances in which no
adults were involved, they underesti-
mate juvenile involvement in crime. Al-
though these data do not present a de-
finitive picture of juvenile involvement
in crime, they are the closest measure
generally available of the proportion of
crime known to law enforcement that
is attributed to persons younger than
age 18.
Source: Author's analysis of the FBI’s Crime in the United States, 2019.
Arson
Motor vehicle theft
Larceny−theft
Burglary
Aggravated assault
Robbery
Murder
Property Crime Index
Violent crime
0% 5% 10% 15% 20% 25% 30% 35% 40%
8%
9%
8%
11%
5%
8%
14%
22%
7%
7%
8%
12%
8%
10%
13%
17%
17%
20%
Clearance
Arrest
Percent involving youth
Incident-based data collection
replaces summary reporting
Since the 1930s, law enforcement
agencies across the U.S. have vol-
untarily reported aggregate level
crime and arrest data to the FBI’s
Uniform Crime Reporting Program’s
Summary Reporting System (SRS).
Out of necessity, details about
crime and arrests captured through
the UCR program were confined to
aggregate counts, thereby limiting a
complete understanding of crime
incidents. The National Incident-
Based Reporting System (NIBRS)
was developed to overcome these
and other limitations.
Created in the 1980s, the purpose
of NIBRS is to provide statistics
about crime that would lead to bet-
ter decisionmaking. By capturing
detailed information about crime in-
cidents, such as information about
multiple offenses within the same
incident, information about victims
and persons known to have com-
mitted the offense(s) and the rela-
tionships between them, as well as
the time of day and location(s) of
crime incidents, NIBRS is a much
more effective tool for policymak-
ers, analysts, and the general pub-
lic to truly understand crime and
make informed decisions about
how to address the problem. Put
simply, NIBRS captures the com-
plexity of crime incidents that can-
not be achieved by a system based
on aggregate counts.
In 2016, the FBI approved the tran-
sition of all federal, state, county,
local, and tribal law enforcement
agencies from SRS to NIBRS. The
target date for the transition was
January 2021. The FBI expects
75% of all U.S. law enforcement
agencies to report their crime data
through NIBRS by the effective date,
representing 80% of the U.S. popu-
lation. Based on the FBI’s normal
release schedule, data for calendar
year 2021—the first year of NIBRS-
based estimates—would be avail-
able sometime in the fall of 2022.

Youth and the Juvenile Justice System: 2022 National Report
108
Law enforcement agencies in the U.S. made 696,620 arrests
of persons under age 18 in 2019
Females accounted for 31% of all juvenile arrests in 2019, youth ages 16–17 accounted for 48%, and
White youth accounted for 63%
2019
estimated number
of juvenile arrests
Percent of total juvenile arrests, 2019
Most serious offense Female
Ages
16–17 White Black
American
Indian Asian
Total 696,620 31% 48% 63% 34% 2% 1%
Violent crime 44,010 21 50 49 48 2 2
Murder and nonnegligent manslaughter 860 11 70 47 50 3 0
Rape NA NA NA NA NA NA NA
Robbery 16,080 12 56 36 62 1 2
Aggravated assault 27,070 26 46 56 40 2 1
Property Crime Index 119,790 33 49 55 42 2 2
Burglary 20,700 14 46 57 40 2 2
Larceny-theft 83,690 40 50 55 41 2 2
Motor vehicle theft 13,610 20 48 47 50 2 1
Arson 1,800 15 27 69 27 2 1
Nonindex
Other (simple) assault 126,130 38 37 59 38 2 1
Forgery and counterfeiting 850 23 69 62 36 1 2
Fraud 3,690 33 58 50 46 2 1
Embezzlement 540 46 87 47 50 0 3
Stolen property (buying, receiving,
possessing) 8,940 18 58 35 62 1 2
Vandalism 31,950 20 38 70 27 2 1
Weapons (carrying, possessing, etc.) 16,080 10 53 56 41 1 2
Prostitution and commercialized vice 290 71 74 47 51 0 2
Sex offense (except rape and prostitution) NA NA NA NA NA NA NA
Drug abuse violation 81,320 26 63 75 21 2 2
Gambling 190 29 63 58 38 0 3
Offenses against the family and children 3,060 41 43 67 23 10 0
Driving under the influence 5,570 26 93 89 6 3 2
Liquor laws 26,650 42 68 86 7 6 1
Drunkenness 3,470 33 70 77 12 10 1
Disorderly conduct 53,990 37 36 55 42 3 1
Vagrancy 350 25 45 72 25 2 1
All other offenses (except traffic) 144,160 30 50 67 29 2 1
Curfew and loitering 14,650 34 44 66 30 3 2
U.S. population ages 10–17: 33,266,572 49% 25% 75% 17% 2% 6%
Q Larceny-theft, simple assault, drug abuse violations, and disorderly conduct offenses accounted for half of all juvenile arrests
in 2019.
Q In 2019, females accounted for 40% of all juvenile arrests for larceny-theft, 38% of all juvenile arrests for simple assault, and
37% of juvenile arrests for disorderly conduct.
Q Youth ages 16-17 accounted for half (50%) of all juvenile arrests for violent crime in 2019, and an even larger proportion of ju-
venile arrests for murder (70%).
Q Black youth, who accounted for 17% of the juvenile population in 2019, were involved in 62% of juvenile arrests for robbery
and stolen property offenses, and 50% of arrests for murder and motor vehicle theft.
NA: Data for rape and sex offenses are not available because of the change in the definition for reporting rape (see sidebar on page 3).
Notes: UCR data do not distinguish the ethnic group Hispanic; Hispanics may be of any race. In 2019, 88% of Hispanics ages 10–17 were classified ra-
cially as White. Detail may not add to totals because of rounding.
Source: Authors’ analysis of arrest data from the National Center for Juvenile Justice.

Chapter 5: Law enforcement and youth
109
In 2019, 6% of male arrests and 8% of female arrests
involved a person younger than age 18
In 2019, juveniles were involved in about 1 in 5 arrests for robbery and arson, and 1 in 10 arrests for
larceny-theft, stolen property offenses, and weapons law violations
Juvenile arrests as a percentage of total arrests, 2019
Most serious offense
All
persons Male Female White Black
American
Indian Asian
Total 7% 6% 8% 6% 9% 6% 6%
Violent crime 9 9 9812 76
Murder and nonnegligent manslaughter 8 8 7 8 8 13 1
Rape
Robbery 22 23 16 17 25 11 24
Aggravated assault 7 7 8 6 8 6 4
Property Crime Index 11 12 10 9 16 11 13
Burglary 12 13 8 10 17 18 13
Larceny-theft 10 11 10 9 14 9 13
Motor vehicle theft 17 18 15 12 29 19 10
Arson 20 21 14 19 22 20 9
Nonindex
Other (simple) assault 12 11 16 11 15 10 9
Forgery and counterfeiting 2 2 1 2 2 1 2
Fraud 3 3 3 2 5 4 2
Embezzlement 4 4 4 3 5 1 6
Stolen property (buying, receiving,
possessing) 10 11 8 6 18 8 9
Vandalism 18 19 15 18 18 16 11
Weapons (carrying, possessing, etc.) 10 10 11 11 10 13 12
Prostitution and commercialized vice 1 1 1 1 1 0 0
Sex offense (except rape and prostitution)
Drug abuse violation 5 5 5 5 4 9 6
Gambling 8 8 8 8 10 0 2
Offenses against the family and children 4 3 5 4 3 7 2
Driving under the influence 1 1 1 1 0 1 0
Liquor laws 15 13 21 17 7 18 13
Drunkenness 1 1 2 1 1 1 1
Disorderly conduct 17 15 22 15 24 10 14
Vagrancy 2 2 2 2 1 1 1
All other offenses (except traffic) 4 4 5 4 5 4 4
Q Juvenile females accounted for about 1 in 6 simple assault arrests involving females in 2019, while male juveniles accounted
for about 1 in 10 simple assault arrests involving males.
Q In 2019, juveniles accounted for 9% of violent crime arrests and 11% of Property Crime Index arrests. On average, juveniles
accounted for 11% of all violent crime arrests during the 2010s, compared with 16% during the 2000s, and they accounted
for 16% of all Property Crime Index arrests in the 2010s, compared with 28% in the 2000s.
Q Overall, in 2019, 6% of arrests of Whites and 9% of arrests of Blacks involved a person younger than age 18. This pattern of
juveniles being involved in a greater proportion of arrests of Blacks than of Whites was found across nearly all offenses. How-
ever, for liquor law violations, the reverse was true.
Note: Detail may not add to totals because of rounding.
Source: Authors’ analysis of arrest data from the National Center for Juvenile Justice.

Youth and the Juvenile Justice System: 2022 National Report
110
Across most offenses, juvenile arrests fell proportionately
more than adult arrests between 2010 and 2019
The number of arrests of juveniles in 2019 was 58% fewer than the number of arrests in 2010, while adult
arrests fell 18% during the same period
Percent change in arrests, 2010–2019
All persons Juveniles Adults
Most serious offense All Male Female All Male Female All Male Female
Total –23% –25% –17% –58% –58% –56% –18% –21% –10%
Violent crime –10 –12 –3 –36 –37 –33 –6 –8 2
Murder and nonnegligent manslaughter –1 –2 8 –15 –15 –11 0 –1 10
Rape
Robbery –34 –36 –14 –41 –42 –29 –31 –34 –11
Aggravated assault –6 –7 –2 –40 –41 –36 –1 –3 3
Property Crime Index –35 –35 –34 –67 –65 –71 –25 –26 –23
Burglary –41 –45 –19 –68 –69 –61 –33 –37 –11
Larceny-theft –36 –35 –37 –70 –67 –74 –26 –26 –27
Motor vehicle theft 13 5 49 –14 –18 8 20 12 60
Arson –20 –24 1 –61 –61 –55 8 4 25
Nonindex
Other (simple) assault –21 –23 –13 –40 –42 –36 –17 –20 –7
Forgery and counterfeiting –42 –38 –49 –50 –47 –57 –42 –38 –49
Fraud –40 –34 –48 –36 –35 –37 –40 –34 –48
Embezzlement –19 –18 –19 22 13 36 –20 –19 –20
Stolen property (buying, receiving,
possessing) –7 –10 6 –39 –40 –34 –1 –4 12
Vandalism –29 –32 –13 –59 –61 –45 –15 –19 –3
Weapons (carrying, possessing, etc.) –4 –5 9 –49 –48 –52 7 5 29
Prostitution and commercialized vice –57 –49 –61 –73 –55 –76 –57 –49 –61
Sex offense (except rape and prostitution)
Drug abuse violation –5 –12 26 –52 –58 –24 1 –7 31
Gambling –75 –81 –24 –86 –89 29 –74 –79 –27
Offenses against the family and children –23 –28 –6 –19 –27 –4 –23 –28 –7
Driving under the influence –27 –30 –21 –54 –54 –53 –27 –29 –20
Liquor laws –66 –67 –64 –72 –74 –69 –64 –65 –62
Drunkenness –44 –46 –31 –73 –75 –66 –43 –46 –30
Disorderly conduct –50 –51 –46 –65 –67 –62 –44 –46 –39
Vagrancy –32 –34 –21 –84 –84 –82 –28 –31 –16
All other offenses (except traffic) –11 –14 0 –51 –54 –45 –7 –11 4
Curfew and loitering –85 –85 –82 –85 –85 –82 NA NA NA
Q The overall decline in juvenile arrests was comparable for males (58%) and females (56%) between 2010 and 2019. Across
most offenses, however, the relative decline was greater for juvenile males than juvenile females (e.g., robbery, burglary, sim-
ple assault, and vandalism).
Q Arrests declined for juveniles and adults between 2010 and 2019, and for most offenses, the relative decline in juvenile arrests
outpaced that of adults, regardless of gender. For example, arrests for robbery, aggravated assault, simple assault, and disor-
derly conduct declined more for juvenile than adult males, a pattern that was replicated in arrests of females. Somewhat less
common, however, was a decline in juvenile arrests coupled with an increase for adults. For example, juvenile arrests for
weapons law violations for males and females decreased between 2010 and 2019 but increased for their adult counterparts.
NA = Curfew and loitering offenses are status offenses that only apply to juveniles.
Source: Authors’ analysis of arrest data from the Bureau of Justice Statistics and the National Center for Juvenile Justice.

Chapter 5: Law enforcement and youth
111
The proportion of juvenile arrests involving females has
grown
Females accounted for 31% of
juvenile arrests in 2019
In 2019, law enforcement agencies
made an estimated 696,620 arrests of
persons younger than age 18. Females
accounted for 212,650 of those arrests,
or less than one-third (31%) of all ar-
rests in that year. Although males ac-
counted for the majority (69%) of juve-
nile arrests in 2019, the female share
was relatively high for certain offenses,
including liquor law violations (42%),
larceny-theft (40%), simple assault
(38%), and disorderly conduct (37%).
In comparison, females accounted for a
smaller share of murder (11%), robbery
(12%), and burglary (14%) arrests.
The female share of juvenile
arrests has grown
Overall, juvenile arrests have declined
considerably in the last two decades.
For example, between 2000 and 2019,
juvenile arrests fell 68%. During the
same period, the number of juvenile
arrests involving males fell 70% while
the number of female juvenile arrests
fell 61%. In fact, from 2000 through
2019, arrests of juvenile females de-
creased less than male arrests in most
offense categories (e.g., robbery, ag-
gravated and simple assault, burglary,
and drug abuse violations).
Percent change, 2000-2019:
Most serious offense Male Female
All offenses –70% –61%
Violent crime –55 –49
Robbery –43 –25
Aggravated assault –61 –53
Property Crime Index –78 –74
Burglary –79 –73
Larceny-theft –78 –75
Motor vehicle theft –74 –68
Simple assault –51 –35
Vandalism –74 –56
Drug abuse violation –64 –26
Driving under the influence –76 –61
Liquor laws –83 –72
Drunkenness –87 –73
Disorderly conduct –71 –56
Curfew –91 –90
80 83 86 89 92 95 98 01 04 07 10 13 16 19
0%
5%
10%
15%
20%
25%
30%
Female percent of youth arrests
Aggravated assault
Robbery
Violent crime
Murder
Year
Violent crime
Q Juvenile arrests for both aggravated assault and larceny-theft have been on the de-
cline since 2000, but the declines have been greater for males than females—61%
and 78%, respectively, for males, compared with 53% and 75% for females. Fol-
lowing this disproportionate decrease in arrests, the female share of aggravated as-
sault and larceny-theft arrests has grown, from 23% in 2000 to 26% in 2019 for ag-
gravated assault, and from 37% to 40% for larceny-theft.
Source: Authors’ analysis of arrest data from the Bureau of Justice Statistics and the National Center
for Juvenile Justice.
80 83 86 89 92 95 98 01 04 07 10 13 16 19
0%
10%
20%
30%
40%
50%
Female percent of youth arrests
Larceny−theft
Motor vehicle theft
Burglary
Arson
Property Crime Index
Year
Property crime
The increases in the female proportion of violent crime and property
crime arrests since 1980 were tied to changes in arrests for aggravated
assault and larceny-theft

Youth and the Juvenile Justice System: 2022 National Report
112
As a result of the relatively larger de-
cline in juvenile male arrests, females
accounted for a larger proportion of
juvenile arrests in 2019 than they did
20 years prior. In 2019, females ac-
counted for 31% of all juvenile arrests,
up from 25% in 2000. Between 2000
and 2019, the number of simple as-
sault arrests declined more for juvenile
males (51%) than females (35%). As a
result, the female share of simple as-
sault arrests increased from 31% to
38%. Likewise, female juvenile arrests
for larceny-theft fell 75% in the last 20
years, while arrests of males fell 78%.
The net result was that females ac-
counted for 40% of such arrests in
2019, compared with 37% in 2000.
Gender differences also occurred in ar-
rest trends for adults. For example, be-
tween 2000 and 2019, adult male ar-
rests for simple assault fell 24% while
adult female arrests increased 11%. As a
result, adult females accounted for a
larger share of simple assault arrests in
2019 (28%) than in 2000 (21%). Simi-
larly, adult male arrests for larceny-theft
fell 20% while adult female arrests in-
creased 10%. Therefore, the female
proportion of arrests grew for each of-
fense for adults, as it did for juveniles.
80 83 86 89 92 95 98 01 04 07 10 13 16 19
0%
5%
10%
15%
20%
25%
30%
Year
Female percent of youth arrests
Drug abuse
80 83 86 89 92 95 98 01 04 07 10 13 16 19
0%
5%
10%
15%
20%
25%
30%
Year
Female percent of youth arrests
Driving under
the influence
80 83 86 89 92 95 98 01 04 07 10 13 16 19
0%
10%
20%
30%
40%
50%
Year
Female percent of youth arrests
Liquor law violations
80 83 86 89 92 95 98 01 04 07 10 13 16 19
0%
5%
10%
15%
20%
25%
30%
35%
Year
Female percent of youth arrests
Drunkenness
80 83 86 89 92 95 98 01 04 07 10 13 16 19
0%
10%
20%
30%
40%
Year
Female percent of youth arrests
Other (simple) assault
80 83 86 89 92 95 98 01 04 07 10 13 16 19
0%
4%
8%
12%
16%
20%
Year
Female percent of youth arrests
Vandalism
Between 1980 and 2019, the female proportion of juvenile arrests
increased substantially for simple assault, vandalism, liquor law
violations, drunkenness, and disorderly conduct
Q The growth in the female proportion of arrests for the offenses shown above over
the last 10 years is largely attributable to disproportionate changes in arrests of
male and female youth. Specifically, across these offenses, arrests of males and fe-
males have been on the decline since 2010, but the relative decline in male arrests
outpaced the decline for females. For example, drug arrests involving males fell
58% between 2010 and 2019, compared with a 24% decline for females. The result
of such disproportionate declines is that the female share of youth arrests for each
offense has grown.
Source: Authors’ analysis of arrest data from the Bureau of Justice Statistics and the National Center
for Juvenile Justice.
80 83 86 89 92 95 98 01 04 07 10 13 16 19
0%
10%
20%
30%
40%
Year
Female percent of youth arrests
Disorderly conduct
80 83 86 89 92 95 98 01 04 07 10 13 16 19
0%
5%
10%
15%
20%
25%
30%
35%
Year
Female percent of youth arrests
Curfew and loitering

Chapter 5: Law enforcement and youth
113
Youth under age 13 account for a small proportion of juvenile
arrests
Arrest rates for very young juve-
niles declined in the last two
decades
In 1980, there were an estimated
1,259 arrests of persons ages 10–12 for
every 100,000 persons in this age
group in the U.S. population. Follow-
ing a 39% increase through 1994, the
rate declined steadily. By 2019, the ar-
rest rate had fallen to 421, a decline of
74% from the 1994 peak, and 4%
above the 2018 low point.
The proportion of juvenile arrests in-
volving the very young alternated be-
tween periods of growth and decline.
In 1980, 9% of all juvenile arrests were
arrests of persons under age 13. The
proportion reached a peak in 1989 at
11%, declined to a low of 6% in 2009,
and then reached 8% in 2019. Part of
the increase since 2009 can be attribut-
ed to the fact that, while arrests for all
juveniles have been on the decline, the
relative decline for older juveniles out-
paced that of younger juveniles. Since
2009, arrests of juveniles under age 13
fell 50% while arrests of juveniles ages
13–17 fell 62%.
Across most offenses, arrest rates for
young juveniles in 2019 were at or
near historically low levels. However,
for some offenses, arrests of young ju-
veniles have been on the rise in recent
years, and the types of youth entering
the juvenile justice system has changed.
For example, since the late 1980s, ar-
rest rates for larceny-theft and burglary
for younger juveniles fell more than
90% by 2019. Similarly, following an
86% decline since 1994, the robbery
arrest rate for young juveniles reached
a new low in 2019. The same cannot
be said, however, for arrests of young
juveniles for aggravated and simple as-
sault, both of which have been on the
rise in recent years. Since 2015, the ag-
gravated assault arrest rate for young
juveniles increased 8% and the rate for
simple assault increased 20%. As a re-
sult, even though the overall arrest rate
declined, the number of young juve-
80 83 86 89 92 95 98 01 04 07 10 13 16 19
0%
2%
4%
6%
8%
10%
12%
14%
Young (under age 13) percent of youth arrests
Violent crime
Murder
Robbery
Aggravated assault
Year
The proportion of juvenile Property Crime Index arrests involving youth
younger than age 13 declined from 16% in the late 1980s to 6% in 2019
Q Compared to other Property Crime Index offenses, the proportion of arson arrests
involving youth younger than age 13 is high; since 2005, one-fourth of all juvenile
arson arrests involved a youth younger than age 13.
Source: Authors’ analysis of arrest data from the Bureau of Justice Statistics and the National Center
for Juvenile Justice.
80 83 86 89 92 95 98 01 04 07 10 13 16 19
0%
5%
10%
15%
20%
25%
30%
35%
40%
Young (under age 13) percent of youth arrests
Arson
Burglary
Motor vehicle theft
Property Crime Index
Larceny−theft
Year
In 2019, 7% of juvenile violent crime arrests involved youth younger
than age 13, down from a high of 10% in the early 2000s
Q Aggravated assault is by far the most common violent crime involving youth young-
er than age 13. Since 1998, arrests for aggravated assault accounted for 80% or
more of violent crime arrests involving youth younger than age 13.
Source: Authors’ analysis of arrest data from the Bureau of Justice Statistics and the National Center
for Juvenile Justice.

Youth and the Juvenile Justice System: 2022 National Report
114
niles entering the juvenile justice sys-
tem charged with assaults has grown in
recent years. This implies there were:
(1) different factors influencing the
volume and/or nature of law-violating
behavior by young juveniles over this
time period, and/or (2) differential re-
sponses by law enforcement to these
behaviors.
Arrest rates of young males
declined more than those of
young females in recent years
Since 2010, the overall arrest rate for
youth ages 10–12 fell 29%, but the rel-
ative decline in the male rate (48%) was
greater than that of the female rate
(41%). In fact, across most offenses,
the arrest rate for young females de-
clined less than that of their young
male peers. For drug offenses, the fe-
male rate actually increased 24% while
the male rate declined 47%. As a result,
a greater number and proportion of
the young juvenile arrestees in 2019
were female than in 2010.
Percent change in young juvenile (ages
10–12) arrest rate, 2010–2019:
Most serious offense Male Female
All offenses –48% –41%
Violent crime –36 –14
Aggravated assault –35 –13
Property Crime Index –65 –73
Burglary –63 –56
Larceny-theft –68 –76
Simple assault –30 –13
Stolen property –71 –58
Vandalism –51 –45
Weapons law violation –60 –42
Drug abuse violation –47 24
Liquor law violations –33 –24
Disorderly conduct –57 –50
Curfew –80 –77
Source: Analysis of arrest data from the
Bureau of Justice Statistics and the National
Center for Juvenile Justice.
Analysis of race-specific arrest
rate trends for very young juve-
niles is not possible
The FBI’s UCR Program captures in-
formation on the gender of arrestees
subdivided into a large set of detailed
age groups (e.g., under 10, 10–12,
13–14, 15, 16, and 17). It also cap-
tures information on the race of arrest-
ees, but the only age breakdown asso-
ciated with these counts is “under 18”
and “18 and above.” Therefore, age-
specific arrest trends for racial groups,
including trends for young juveniles,
cannot be analyzed with UCR data.
80 83 86 89 92 95 98 01 04 07 10 13 16 19
0%
2%
4%
6%
8%
10%
12%
Year
Young (under age 13) percent of youth arrests
Weapons
80 83 86 89 92 95 98 01 04 07 10 13 16 19
0%
1%
2%
3%
4%
Year
Young (under age 13) percent of youth arrests
Drug abuse
80 83 86 89 92 95 98 01 04 07 10 13 16 19
0%
2%
4%
6%
8%
10%
12%
14%
Year
Young (under age 13) percent of youth arrests
Disorderly conduct
80 83 86 89 92 95 98 01 04 07 10 13 16 19
0%
2%
4%
6%
8%
10%
Year
Young (under age 13) percent of juvenile arrests
Curfew and loitering
80 83 86 89 92 95 98 01 04 07 10 13 16 19
0%
4%
8%
12%
16%
Year
Young (under age 13) percent of youth arrests
Other (simple) assault
80 83 86 89 92 95 98 01 04 07 10 13 16 19
0%
5%
10%
15%
20%
25%
Year
Young (under age 13) percent of youth arrests
Vandalism
Between 1980 and 2019, the proportion of juvenile arrests involving
youth younger than 13 declined for vandalism but increased for disor-
derly conduct
Q In 1980, 22% of juvenile vandalism arrests involved youth younger than 13; by
2019, 14% of such arrests involved youth younger than 13.
Q The proportion of juvenile arrests for disorderly conduct involving youth younger
than 13 increased from 8% in 1980 to 12% in 2019.
Q Despite an increase since 2007, a small proportion (3% in 2019) of juvenile drug ar-
rests involve youth younger than 13.
Source: Authors’ analysis of arrest data from the Bureau of Justice Statistics and the National Center
for Juvenile Justice.

Chapter 5: Law enforcement and youth
115
The juvenile arrest rate for violent crimes reached a new low
in 2019
Violent crime arrest rates declined
substantially after 1994
The juvenile arrest rate (i.e., the num-
ber of arrests per 100,000 juveniles in
the population) for violent crimes was
relatively stable between 1980 and
1987. This period of stability was fol-
lowed by substantial growth, as the vi-
olent crime arrest rate increased 73%
through 1994. This rapid growth led
to speculation about changes in the
nature of juvenile offenders—concerns
that spurred state legislators to pass
laws that facilitated an increase in the
flow of youth into the adult justice sys-
tem. Since the 1994 peak, the juvenile
arrest rate for violent crime declined
annually through 2004, increased each
of the next two years, then declined
again through 2013. After a few years
of stability, the rate fell 4% in the last
year, reaching its lowest level (131.7)
since at least 1980, and 72% below the
1994 peak.
Violent crime arrest rates declined
more for males than females
In 1980, the juvenile male violent
crime arrest rate was 8 times greater
than the female rate. By 2019, the
male rate was 3.7 times greater. This
convergence of male and female arrest
rates is due to the large relative in-
crease in the female rate through the
mid-1990s and the larger relative de-
crease in the male rate through 2019.
Between 1980 and 1994, the male rate
increased 62%, while the female rate
increased 133%. Since 1994, the male
rate fell 74%, while the female rate fell
61% through 2019.
Arrest rates declined for all racial
groups since the mid-1990s
Violent crime arrest rates declined for
all race groups since their mid-1990s
peak. For White and Asian youth, the
rate fell through 2013, then remained
relatively stable through 2019, while
the rate for American Indian youth fell
through 2014, then increased through
2019. The rate for Black youth de-
clined from 1996 through 2002, in-
creased through 2006, and then de-
80 83 86 89 92 95 98 01 04 07 10 13 16 19
0
100
200
300
400
500
Year
Arrests per 100,000 youth ages 10−17
Violent crime
The juvenile arrest rate for violent crime was cut in half between 2006
and 2019
Q The violent crime arrest rate in 2019 for Black juveniles was more than 4 times the
rate for White juveniles, 3 times the rate for American Indian juveniles, and 12 times
the rate for Asian juveniles.
Source: Authors’ analysis of arrest data from the Bureau of Justice Statistics and the National Center
for Juvenile Justice, and population data from the U.S. Bureau of the Census. (See arrest rate data
source note at the end of this chapter for details.)
clined through 2019 to reach its lowest
level since at least 1980.
Violent crime arrest rate trends by gender and race
80 83 86 89 92 95 98 01 04 07 10 13 16 19
0
400
800
1,200
1,600
Year
Arrests per 100,000 youth ages 10−17
Black
White
80 83 86 89 92 95 98 01 04 07 10 13 16 19
0
50
100
150
200
250
300
350
Year
Arrests per 100,000 youth ages 10−17
Amer. Indian
White
Asian
80 83 86 89 92 95 98 01 04 07 10 13 16 19
0
200
400
600
800
Year
Arrests per 100,000 youth ages 10–17
Male
Female
80 83 86 89 92 95 98 01 04 07 10 13 16 19
0
40
80
120
160
Year
Arrests per 100,000 youth ages 10−17
Female

Youth and the Juvenile Justice System: 2022 National Report
116
After 6 years of increase, the juvenile arrest rate for murder
declined in the last year
The 2019 murder arrest rate was
19% above the 2012 lowpoint
Between the mid-1980s and the peak
in 1993, the juvenile arrest rate for
murder more than doubled. Since the
1993 peak, however, the rate fell sub-
stantially through 2000, remained rela-
tively stable through 2007, and then
declined to its lowest level in 2012.
This trend reversed, however, as the
rate increased through 2018, then de-
clined in the last year. Compared with
the period from 1984 through 2000,
the juvenile murder arrest rate between
2010 and 2019 has been historically
low and relatively stable. In fact, the
number of juvenile arrests for murder
in the 4-year period from 1992
through 1995 exceeded the total num-
ber of such arrests since 2010.
Male arrests drove murder arrest
rate trends
During the 1980s and 1990s, the juve-
nile male arrest rate for murder was,
on average, about 13 times greater
than the female rate. Both displayed
generally similar trends.
The female murder arrest rate peaked
in 1994 at 63% above its 1980 level,
whereas the male rate peaked in 1993
at 123% above the 1980 rate. Since
reaching their peaks, the rates for both
fell substantially. The male rate reached
a lowpoint in 2012, 84% below the
1993 peak, while the female rate
reached its lowpoint in 2015, 80%
below the 1994 peak. Despite recent
increases, rates for both in 2019 were
near their historical lowpoints.
The juvenile murder arrest rate
pattern was linked to the arrests
of Black juveniles
The Black-to-White ratio of juvenile
arrest rates for murder grew from
about 4-to-1 in 1980 to nearly 9-to-1
in 1993, reflecting the greater increase
in the Black rate over this period—the
White rate increased 47% while the
Black rate tripled. Since 1993, both
rates fell through 2004, with the Black
rate falling considerably more (81% vs.
67%). More recently, the White rate
has increased since 2013, while the rate
for Black youth has declined since
2017. As a result, the Black-to-White
ratio of juvenile arrest rates for murder
in 2019 was less than 5-to-1.
80 83 86 89 92 95 98 01 04 07 10 13 16 19
0
2
4
6
8
10
12
14
Year
Arrests per 100,000 youth ages 10−17
Murder
Despite the increase between 2012 and 2018, the juvenile murder rate in
2019 was 80% less than its 1993 peak
Note: Murder arrest rates for American Indian youth and Asian youth are not presented because the
small number of arrests and small population sizes produce unstable rate trends.
Source: Analysis of arrest data from the Bureau of Justice Statistics and the National Center for Juve-
nile Justice, and population data from the U.S. Bureau of the Census. (See arrest rate data source note
at the end of this chapter for details.)
Murder arrest rate trends by gender and race
80 83 86 89 92 95 98 01 04 07 10 13 16 19
0
10
20
30
40
50
60
Year
Arrests per 100,000 youth ages 10−17
Black
White
80 83 86 89 92 95 98 01 04 07 10 13 16 19
0
1
2
3
4
5
6
7
Year
Arrests per 100,000 youth ages 10−17
White
80 83 86 89 92 95 98 01 04 07 10 13 16 19
0
5
10
15
20
25
Year
Arrests per 100,000 youth ages 10−17
Male
Female
80 83 86 89 92 95 98 01 04 07 10 13 16 19
0.0
0.4
0.8
1.2
1.6
Year
Arrests per 100,000 youth ages 10−17
Female
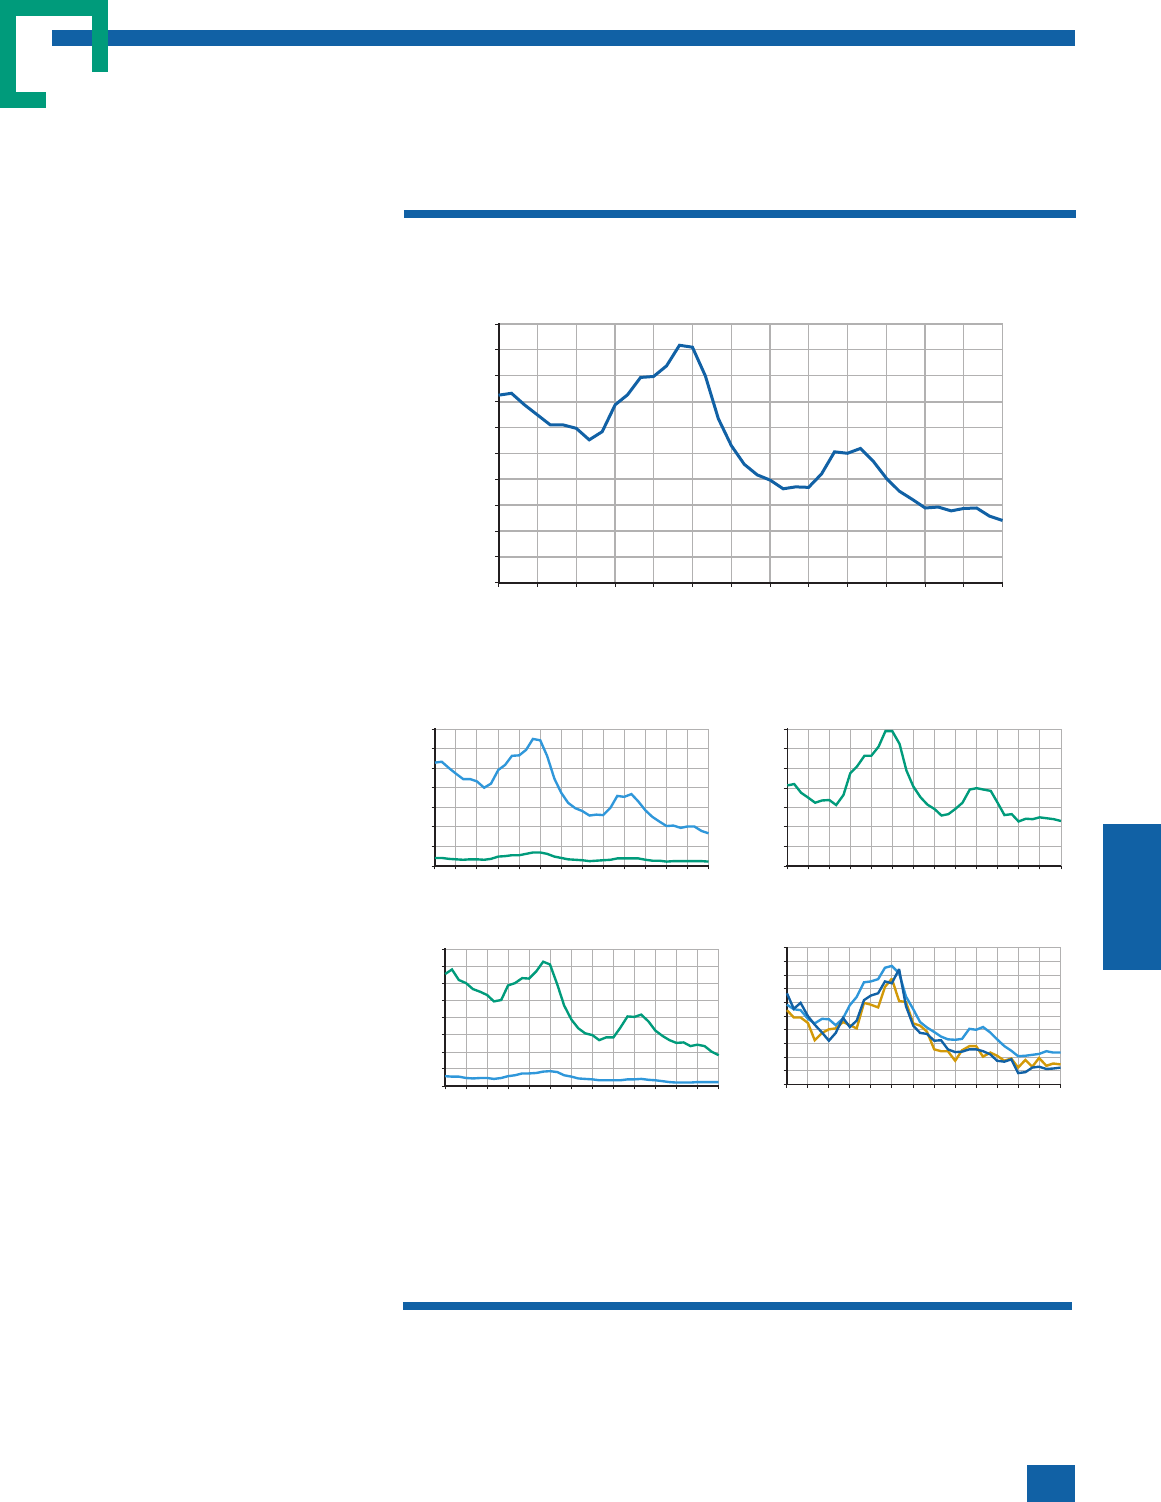
Chapter 5: Law enforcement and youth
117
The juvenile arrest rate for robbery reached a historic low
point in 2019
The juvenile arrest rate for robbery
was cut in half between 2008 and
2019
The juvenile arrest rate trend for rob-
bery is marked by alternating periods
of growth and decline. The rate de-
clined for most of the 1980s, increased
steadily to reach a peak in 1994, and
then declined 60% by 2002. Following
an increase through 2008, the rate fell
once again through 2013, held rela-
tively stable through 2017, and then
declined 16% in the last two years. By
2019, the rate reached a new lowpoint,
and was 53% below the 2008 level.
Arrest rate trends by gender and
race parallel the overall robbery
arrest rate pattern
Across gender and race subgroups,
robbery arrest rates decreased through
the late 1980s and climbed to a peak
in the mid-1990s. By 2002, the rates
for males and females had fallen 60%
and 62%, respectively, from their 1995
peak. Following these declines, the
rates for both increased through 2008.
More recently, the male rate declined
18% since 2017, while the female rate
declined 7% since 2016. By 2019, the
male rate was at its lowest level since at
least 1980 and the female rate was 2%
above the 2013 lowpoint.
The trends in arrest rates within racial
groups were similar over the past three
decades. For each racial group, the ju-
venile robbery arrest rate fell by 60% or
more between the mid-1990s and the
early 2000s, then alternated between
periods of growth and decline. Juvenile
robbery arrest rates reached a historic
low in 2013 for White, American Indi-
an, and Asian youth. From their low
points to 2019, rates increased 13% for
White youth, 19% for American Indian
youth, and 49% for Asian youth. Un-
like the pattern for other race groups,
the robbery arrest rate for Black youth
declined steadily between 2008 and
2019—falling 57% to reach its lowest
level since at least 1980.
80 83 86 89 92 95 98 01 04 07 10 13 16 19
0
40
80
120
160
200
Year
Arrests per 100,000 youth ages 10−17
Robbery
The juvenile arrest rate for robbery reached a historically low level in
2019, 74% below the 1994 peak
Q Despite the large relative decline in the robbery arrest rate for Black youth, racial
differences in juvenile arrest rates for robbery remained high in 2019. Specifically,
the rate for Black youth was about 8 times the rate for White youth, 12 times the
rate for American Indian youth, and 14 times the rate for Asian youth.
Source: Analysis of arrest data from the Bureau of Justice Statistics and the National Center for Juve-
nile Justice, and population data from the U.S. Bureau of the Census. (See arrest rate data source note
at the end of this chapter for details.)
Robbery arrest rate trends by gender and race
80 83 86 89 92 95 98 01 04 07 10 13 16 19
0
200
400
600
800
Year
Arrests per 100,000 youth ages 10−17
Black
White
80 83 86 89 92 95 98 01 04 07 10 13 16 19
0
20
40
60
80
100
Year
Arrests per 100,000 youth ages 10−17
Amer. Indian
White
Asian
80 83 86 89 92 95 98 01 04 07 10 13 16 19
0
50
100
150
200
250
300
350
Year
Arrests per 100,000 youth ages 10−17
Male
Female
80 83 86 89 92 95 98 01 04 07 10 13 16 19
0
5
10
15
20
25
30
35
Year
Arrests per 100,000 youth ages 10−17
Female

Youth and the Juvenile Justice System: 2022 National Report
118
Similar to robbery, the juvenile arrest rate for aggravated
assault reached a new low in 2019
The juvenile aggravated assault
arrest rate declined steadily since
the 1994 peak
The juvenile arrest rate for aggravated
assault more than doubled between
1980 and 1994 and then fell substan-
tially and consistently. In fact, with the
exception of 2005, the rate declined
each year between 1994 and 2019. By
2019, the rate had fallen 71% from the
1994 peak, and, like robbery, reached
its lowest level since at least 1980.
The rate for females increased
more and declined less than the
male rate
The juvenile arrest rate for aggravated
assault for males doubled between
1980 and its 1994 peak, while the fe-
male rate increased by more than 170%
to reach a peak in 1995. Since their re-
spective peaks, the rates for both
groups declined through 2019, but the
relative decline was greater for males
(74%) than for females (61%). As a re-
sult, in 2019, the male arrest rate
reached its lowest level since at least
1980 while the female rate was 3%
above its 1983 low point. The dispro-
portionate increase in the female arrest
rate for aggravated assault compared
with that of males indicates that factors
that impinged differently on females
and males affected the rates. One pos-
sible explanation may be found in poli-
cy changes over this period that en-
couraged arrests in domestic violence
incidents, which have higher rates of
arrests of females than other types of
aggravated assault incidents.
The period from 1980 through 1994
saw substantial increases in aggravated
assault arrest rates for juveniles in each
racial group—Black (149% increase),
Asian (126%), White (97%), and Amer-
ican Indian (73%)—followed by a peri-
od of decline. The rate reached a his-
toric low in 2014 for American Indian
youth, 2016 for White youth, and
2017 for Asian youth. From their low
points to 2019, rates increased 96% for
American Indian youth, 12% for Asian
youth, and 1% for White youth. Unlike
the pattern for other race groups, the
aggravated assault arrest rate for Black
youth declined through 2019, reaching
its lowest level since at least 1980 and
75% below the 1994 peak.
80 83 86 89 92 95 98 01 04 07 10 13 16 19
0
50
100
150
200
250
300
Year
Arrests per 100,000 youth ages 10−17
Aggravated assault
The juvenile arrest rate for aggravated assault was cut in half between
2008 and 2019
Q The Black-White disparity in aggravated assault arrest rates peaked in 1988, when
the Black rate was more than 4 times the White rate; by 2019, the Black-White ratio
was a little more than 3-to-1.
Source: Analysis of arrest data from the Bureau of Justice Statistics and the National Center for Juve-
nile Justice, and population data from the U.S. Bureau of the Census. (See arrest rate data source note
at the end of this chapter for details.)
Aggravated assault arrest rate trends by gender and race
80 83 86 89 92 95 98 01 04 07 10 13 16 19
0
200
400
600
800
Year
Arrests per 100,000 youth ages 10−17
Black
White
80 83 86 89 92 95 98 01 04 07 10 13 16 19
0
50
100
150
200
250
Year
Arrests per 100,000 youth ages 10−17
Amer. Indian
White
Asian
80 83 86 89 92 95 98 01 04 07 10 13 16 19
0
100
200
300
400
500
Year
Arrests per 100,000 youth ages 10−17
Male
Female
80 83 86 89 92 95 98 01 04 07 10 13 16 19
0
20
40
60
80
100
120
Year
Arrests per 100,000 youth ages 10−17
Female

Chapter 5: Law enforcement and youth
119
The juvenile arrest rate for property crimes in 2019 was at its
lowest level since at least 1980
After 1994, the juvenile property
crime arrest rate fell continuously
for more than a decade
Between 1980 and 1994, the juvenile
arrest rate for Property Crime Index
offenses varied little, always remaining
within 10% of the average for the peri-
od. After years of relative stability, the
juvenile Property Crime Index arrest
rate began a decline in the mid-1990s
that continued annually until reaching
a then-historic low in 2006, down 54%
from its 1988 peak. This decline was
followed by a 10% increase over the
next 2 years, and then a 72% decline
between 2008 and 2019. As a result,
juveniles were far less likely to be ar-
rested for property crimes in 2019
than in any previous year.
Property crime arrest rates
reached a historic low in 2019 for
all but American Indian youth
Male and female juvenile Property
Crime Index arrest rates followed simi-
lar patterns after the mid-1990s. Both
rates declined between 1994 and 2006
(57% for males and 40% for females),
increased for about two years, and then
declined again. Between 2010 and
2019, the relative decline in the female
rate outpaced the decline in the male
rate (71% and 64%, respectively). How-
ever, the net result was that both rates
reached a historic low in 2019.
Juvenile Property Crime Index arrest
rates fell 80% or more for each racial
group between 1990 and 2019. As a
result, arrest rates in 2019 were at their
lowest level for White, Black, and Asian
youth, while the rate for American In-
dian youth in 2019 was just 1% above
its 2018 low point. On average, the
Black juvenile arrest rate for property
crimes was 3 times the White arrest
rate over the last 10 years, much small-
er than the disparity in arrest rates for
violent crimes over the same period,
which averaged more than 5 times the
White rate.
80 83 86 89 92 95 98 01 04 07 10 13 16 19
0
500
1,000
1,500
2,000
2,500
3,000
Year
Arrests per 100,000 youth ages 10−17
Property Crime Index
The juvenile Property Crime Index arrest rate fell 72% between 2008
and 2019
Q The Property Crime Index is dominated by larceny-theft, which, in 2019, accounted
for 70% of all juvenile Property Crime Index arrests. Therefore, the trends in Proper-
ty Crime Index arrests largely reflect the trends in arrests for larceny-theft.
Source: Analysis of arrest data from the Bureau of Justice Statistics and the National Center for Juve-
nile Justice, and population data from the U.S. Bureau of the Census. (See arrest rate data source note
at the end of this chapter for details.)
Property Crime Index arrest rate trends by gender and race
80 83 86 89 92 95 98 01 04 07 10 13 16 19
0
1,000
2,000
3,000
4,000
5,000
Year
Arrests per 100,000 youth ages 10−17
Black
White
80 83 86 89 92 95 98 01 04 07 10 13 16 19
0
500
1,000
1,500
2,000
2,500
3,000
Year
Arrests per 100,000 youth ages 10−17
Amer. Indian
White
Asian
80 83 86 89 92 95 98 01 04 07 10 13 16 19
0
1,000
2,000
3,000
4,000
Year
Arrests per 100,000 youth ages 10−17
Male
Female
80 83 86 89 92 95 98 01 04 07 10 13 16 19
0
200
400
600
800
1,000
1,200
1,400
Year
Arrests per 100,000 youth ages 10−17
Female

Youth and the Juvenile Justice System: 2022 National Report
120
The juvenile arrest rate for burglary reached a new low in
2019, 92% below the 1980 peak
Juvenile arrests for burglary fell
more than adult arrests
In 2019, the juvenile arrest rate for bur-
glary reached its lowest point in the past
40 years, nearly one-tenth of its 1980
level. While adult arrests for burglary also
declined over the period, the decline for
juveniles outpaced that of adults. For ex-
ample, between 2010 and 2019, the
number of juvenile burglary arrests fell
68% while adult burglary arrests fell 33%.
In 2010, 23% of all burglary arrests were
arrests of a juvenile; in 2019, reflecting
the greater decline in juvenile arrests, 12%
of burglary arrests were juvenile arrests.
Juvenile male arrest rates for bur-
glary declined more than female
rates
The substantial decline in the juvenile
burglary arrest rate was primarily the re-
sult of a decline in juvenile male arrests.
Between 1980 and 2019, the male rate
fell 92% while the female rate dropped
81%. By 2019, the male rate reached its
lowest level since at least 1980, and the
female rate was 3% above the 2018 low-
point. Following the larger relative decline
for males, females accounted for a larger
share of juvenile burglary arrests in 2019
(14%) than in 1980 (6%).
Juvenile burglary arrest rates for
White and Black youth reached a
new low in 2019
Between 1980 and 2019, the juvenile
burglary arrest rate declined for all racial
groups: 95% for Asians, 93% for Whites,
90% for American Indians, and 88% for
Blacks. As a result, rates for White and
Black youth in 2019 were at their lowest
level since 1980, while the rates for Amer-
ican Indian and Asian youth were 19%
and 18%, respectively, above their 2018
low point.
80 83 86 89 92 95 98 01 04 07 10 13 16 19
0
100
200
300
400
500
600
700
800
Year
Arrests per 100,000 youth ages 10−17
Burglary
The juvenile burglary arrest rate fell 75% between 2008 and 2019
Q Following the larger relative decline in the juvenile burglary rate for males, the gen-
der disparity in arrest rates has diminished. In 1980, the juvenile male arrest rate for
burglary was more than 14 times the female rate; in 2019, the male rate was 6
times the female rate.
Source: Analysis of arrest data from the Bureau of Justice Statistics and the National Center for Juve-
nile Justice, and population data from the U.S. Bureau of the Census. (See arrest rate data source note
at the end of this chapter for details.)
Burglary arrest rate trends by gender and race
80 83 86 89 92 95 98 01 04 07 10 13 16 19
0
200
400
600
800
1,000
1,200
1,400
Year
Arrests per 100,000 youth ages 10−17
Black
White
80 83 86 89 92 95 98 01 04 07 10 13 16 19
0
100
200
300
400
500
600
700
Year
Arrests per 100,000 youth ages 10−17
Amer. Indian
White
Asian
80 83 86 89 92 95 98 01 04 07 10 13 16 19
0
200
400
600
800
1,000
1,200
1,400
Year
Arrests per 100,000 youth ages 10−17
Male
Female
80 83 86 89 92 95 98 01 04 07 10 13 16 19
0
20
40
60
80
100
Year
Arrests per 100,000 youth ages 10−17
Female

Chapter 5: Law enforcement and youth
121
Following a 73% decline since 2008, the juvenile arrest rate
for larceny-theft reach a new low in 2019
Juvenile larceny-theft rates
declined annually since 2008
The juvenile arrest rate for larceny-
theft generally increased between 1980
and the mid-1990s and then fell 52%
between 1994 and 2006, reaching a
then-historic low. Following an in-
crease between 2006 and 2008, the
rate then declined for the next 11
years. By 2019, the rate was 69%
below the prior low-point in 2006, and
85% below the 1991 peak. The overall
decline in arrests for such a high-vol-
ume offense translated into significant-
ly fewer juveniles charged with proper-
ty crimes entering the justice system.
The female larceny-theft arrest
rate decreased more than the
male rate since 2010
Male and female juvenile larceny-theft
arrest rates followed similar patterns
after the mid-1990s. Both rates de-
clined between 1994 and 2006 (58%
for males and 39% for females), in-
creased briefly, and then declined
again. Between 2010 and 2019, the
relative decline in the female rate out-
paced the decline in the male rate (73%
and 67%, respectively). The net result
was that both rates reached a historic
low in 2019.
Race-specific trends in the larceny-theft
arrest rate mirrored the overall trend.
The rates declined between 1994 and
2006 for all race group: 66% each for
Asians and American Indians, 53% for
Whites, and 52% for Blacks. Following
a brief interruption, rates for all race
groups declined considerably since
2010 (77% for Asians, 74% for Whites,
62% for American Indians, and 61% for
Blacks) and, by 2019, were at their
lowest level since 1980.
80 83 86 89 92 95 98 01 04 07 10 13 16 19
0
200
400
600
800
1,000
1,200
1,400
1,600
1,800
Year
Arrests per 100,000 youth ages 10−17
Larceny-theft
The juvenile arrest rate for larceny-theft in 2019 was 85% below the
1991 peak
Q Between 1980 and the mid-2000s, the proportion of larceny-theft arrests involving
Black youth stayed within a limited range (24% to 29%). However, following the
larger decline in arrests involving White youth since 2006 (75% vs. 57% for Black
youth), the proportion of larceny-theft arrests involving Black youth has grown, from
29% in 2006 to 41% in 2019.
Source: Analysis of arrest data from the Bureau of Justice Statistics and the National Center for Juve-
nile Justice, and population data from the U.S. Bureau of the Census. (See arrest rate data source note
at the end of this chapter for details.)
Larceny-theft arrest rate trends by gender and race
80 83 86 89 92 95 98 01 04 07 10 13 16 19
0
500
1,000
1,500
2,000
2,500
3,000
Year
Arrests per 100,000 youth ages 10−17
Black
White
80 83 86 89 92 95 98 01 04 07 10 13 16 19
0
400
800
1,200
1,600
2,000
Year
Arrests per 100,000 youth ages 10−17
Amer. Indian
White
Asian
80 83 86 89 92 95 98 01 04 07 10 13 16 19
0
500
1,000
1,500
2,000
2,500
Year
Arrests per 100,000 youth ages 10−17
Male
Female
80 83 86 89 92 95 98 01 04 07 10 13 16 19
0
200
400
600
800
1,000
1,200
Year
Arrests per 100,000 youth ages 10−17
Female

Youth and the Juvenile Justice System: 2022 National Report
122
The motor vehicle theft arrest rate for juveniles declined in
the last 2 years
The juvenile arrest rate for motor
vehicle theft peaked in 1989
The juvenile arrest rate for motor vehi-
cle theft more than doubled between
1983 and 1989, up 141%. After the
1989 peak, the juvenile arrest rate for
motor vehicle theft declined steadily to
reach a historic low in 2013 (90%
below the 1989 peak), then increased
again. Despite a decline in the past 2
years, the 2019 rate was 17% above the
2013 low point. Trends for juveniles
and adults followed similar patterns
until recently; in the 10-year period
between 2010 and 2019, the number
of juvenile motor vehicle theft arrests
fell 14%, while adult motor vehicle
theft arrests increased 20%.
Male and female juvenile arrest rates
for motor vehicle theft displayed gen-
erally similar trends in the 1980s and
1990s. However, the male rate peaked
in 1989, but the female rate did not
peak until 1994. Both rates fell sub-
stantially from their peak (91% for
males, 86% for females), to reach a his-
toric low in 2013. Despite recent de-
clines, the rates for both in 2019 were
above the 2013 low point.
From 1983 to their peak years, arrest
rates for motor vehicle theft nearly
doubled for White juveniles (peak year
1990), more than doubled for Asian
juveniles (peak year 1988), increased
nearly 150% for American Indian juve-
niles (peak year 1989), and more than
tripled for Black juveniles (peak year
1989). Rates for White, Black, and
Asian youth reached a historic low in
2013, while the low point for Ameri-
can Indians came one year later. By
2019, motor vehicle theft arrest rates
for all racial groups were well below
their late 1980s or early 1990s peaks.
80 83 86 89 92 95 98 01 04 07 10 13 16 19
0
50
100
150
200
250
300
350
Year
Arrests per 100,000 youth ages 10−17
Motor vehicle theft
Since the 2013 low point, the juvenile arrest rate for motor vehicle theft
increased through 2017, then declined 16% by 2019
Q Juvenile motor vehicle theft arrest rates decreased for most demographic sub-
groups since 2017: 18% for males, 9% for females, 38% for Asians, 20% for
Blacks, and 13% for Whites. The rate for American Indians increased 3% during
the same period.
Source: Analysis of arrest data from the Bureau of Justice Statistics and the National Center for Juve-
nile Justice, and population data from the U.S. Bureau of the Census. (See arrest rate data source note
at the end of this chapter for details.)
Motor vehicle theft arrest rate trends by gender and race
80 83 86 89 92 95 98 01 04 07 10 13 16 19
0
200
400
600
800
1,000
Year
Arrests per 100,000 youth ages 10−17
Black
White
80 83 86 89 92 95 98 01 04 07 10 13 16 19
0
50
100
150
200
250
300
350
Year
Arrests per 100,000 youth ages 10−17
Amer. Indian
White
Asian
80 83 86 89 92 95 98 01 04 07 10 13 16 19
0
100
200
300
400
500
600
700
Year
Arrests per 100,000 juveniles ages 10−17
Male
Female
80 83 86 89 92 95 98 01 04 07 10 13 16 19
0
20
40
60
80
100
Year
Arrests per 100,000 youth ages 10−17
Female
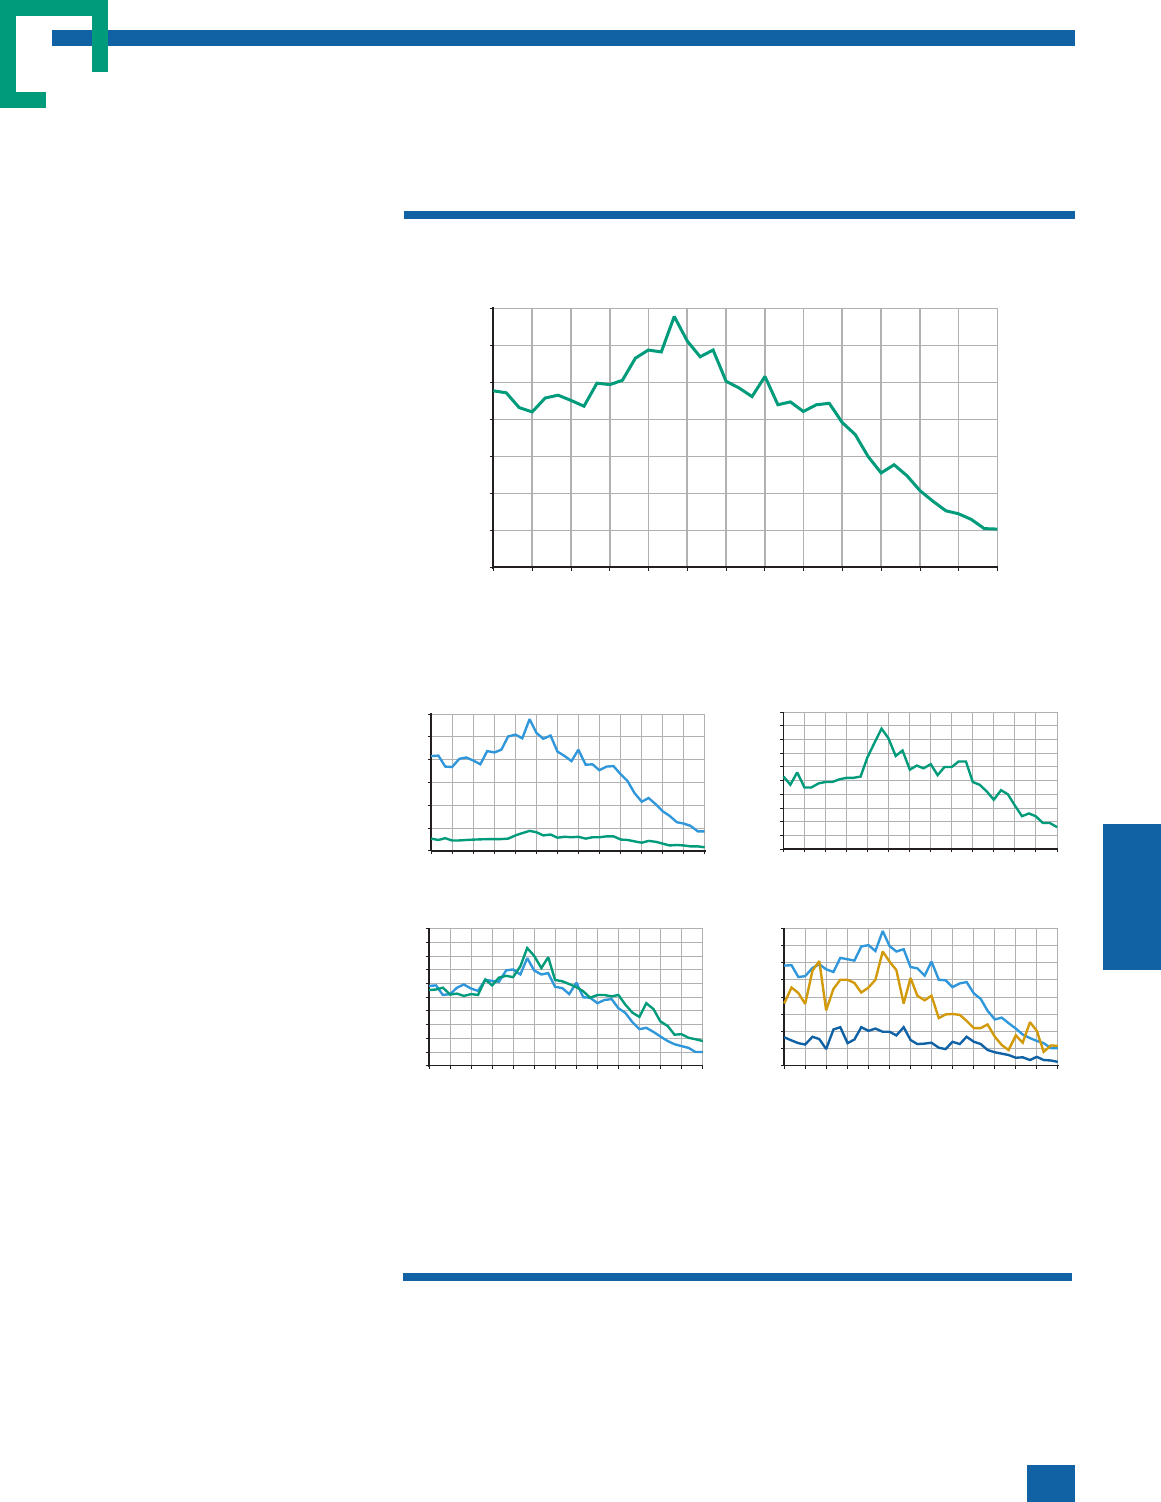
Chapter 5: Law enforcement and youth
123
Following a 63% decline since 2011, the juvenile arrest rate
for arson in 2019 reached a historic low
Most juvenile arrests for arson
involve youth under age 15
Unlike other Property Crime Index of-
fenses, the majority of juvenile arson
arrests involve youth under the age of
15. In 2019, youth under age 15 ac-
counted for more than half (57%) of all
juvenile arson arrests. In comparison,
33% of all juvenile burglary arrests and
30% of all juvenile larceny-theft arrests
in 2019 involved youth under age 15.
Overall, juveniles accounted for 7% of
all arrests in 2019, but their share of
arson arrests (20%) was considerably
higher.
The arson arrest rate declined
considerably since the 1994 peak
After a period of relative stability in the
1980s, the juvenile arrest rate for arson
increased more than 50% between
1987 and 1994. Since the 1994 peak,
the rate generally declined through
2019, falling 85% to reach a new low
point. This general pattern was repli-
cated in the trends for males and fe-
males. Between 1987 and 1994, the
male rate increased 52% and the female
rate increased 80%. Since the 1994
peak, both rates fell more than 80%;
the net result was that, by 2019, both
rates were at their lowest level since
1980.
Race-specific trends in arrest rates for
arson followed a similar pattern be-
tween 1980 and 2019. Rates for
White, Black, and American Indian ju-
veniles reached a peak in 1994, while
the rate for Asians peaked 3 years earli-
er. Since their respective peaks and
2019, rates for all race groups declined
substantially: 92% for Asians, 87% for
Whites, 83% for American Indians, and
79% for Blacks. As a result, rates for
White, Black, and Asian youth in 2019
were at their lowest level, while the
rate for American Indian youth re-
mained above the 2017 low point.
80 83 86 89 92 95 98 01 04 07 10 13 16 19
0
5
10
15
20
25
30
35
Year
Arrests per 100,000 youth ages 10−17
Arson
The juvenile arrest rate for arson in 2019 was 85% below the 1994 peak
Q Compared with other property crimes, the disparity between arson arrest rates for
Black juveniles and White juveniles was relatively low. In 2019, the arson arrest rate
for Black juveniles was about twice the rate for White juveniles, but for burglary and
larceny-theft, the Black rate was more than three times the White rate.
Source: Analysis of arrest data from the Bureau of Justice Statistics and the National Center for Juve-
nile Justice, and population data from the U.S. Bureau of the Census. (See arrest rate data source note
at the end of this chapter for details.)
Arson arrest rate trends by gender and race
80 83 86 89 92 95 98 01 04 07 10 13 16 19
0
10
20
30
40
50
Year
Arrests per 100,000 youth ages 10−17
Black
White
80 83 86 89 92 95 98 01 04 07 10 13 16 19
0
10
20
30
40
Year
Arrests per 100,000 youth ages 10−17
Amer. Indian
White
Asian
80 83 86 89 92 95 98 01 04 07 10 13 16 19
0
10
20
30
40
50
60
Year
Arrests per 100,000 youth ages 10−17
Male
Female
80 83 86 89 92 95 98 01 04 07 10 13 16 19
0
2
4
6
8
10
Year
Arrests per 100,000 youth ages 10−17
Female

Youth and the Juvenile Justice System: 2022 National Report
124
The juvenile arrest rate for simple assault in 2019 remained
well above the 1981 low point
Simple assault accounted for the
majority of assault arrests
The juvenile arrest rate for simple as-
sault increased 176% between 1980
and 1997, then held relatively stable
through the mid-2000s. The rate then
fell 50% by 2017. Despite an increase
in the last two years, the rate in 2019
remained well below the levels of the
late 1990s and mid-2000s. Compara-
tively, the rate for juvenile aggravated
assault arrests declined 71% between its
1994 peak and 2019. As a result of the
greater decrease in aggravated assault
rates, a larger proportion of assaults
that law enforcement handled in recent
years has been for the less serious
form. In 2019, 82% of assault arrests
were for simple assault, compared with
68% in 1980.
Growth in the female arrest rate
for simple assault outpaced the
male rate
The male juvenile arrest rate for simple
assault reached a peak in 1997, while
the female rate peaked in 2004. Be-
tween 1980 and their respective peaks,
the increase in the female arrest rate far
outpaced the increase in the male rate
(321% vs. 146%). By 2019, both rates
were well below their peaks, by 56%
for males and by 42% for females. As a
result, the female proportion of juve-
nile arrests for simple assault grew
from 21% in 1980 to 38% in 2019.
Simple assault arrest rates peaked in
1996 for Asian youth, 1997 for White
and American Indian youth, and 2005
for Black youth. Since their respective
peaks and 2019, rates for all race
groups declined: 73% for Asians, 52%
for Whites, 49% for Blacks, and 48%
for American Indian youth.
80 83 86 89 92 95 98 01 04 07 10 13 16 19
0
100
200
300
400
500
600
700
800
Year
Arrests per 100,000 youth ages 10−17
Other (simple) assault
The juvenile arrest rate for simple assault declined 48% between 2004
and 2019
Q The relative decline in juvenile arrest rates over the past 10 years was the same for
simple assault and aggravated assault (39% each). However, while the aggravated
assault rate reached a historic low in 2019, the simple assault rate remained well
above the 1981 low point.
Source: Analysis of arrest data from the Bureau of Justice Statistics and the National Center for Juve-
nile Justice, and population data from the U.S. Bureau of the Census. (See arrest rate data source note
at the end of this chapter for details.)
Simple assault arrest rate trends by gender and race
80 83 86 89 92 95 98 01 04 07 10 13 16 19
0
400
800
1,200
1,600
2,000
Year
Arrests per 100,000 youth ages 10−17
Black
White
80 83 86 89 92 95 98 01 04 07 10 13 16 19
0
200
400
600
800
Year
Arrests per 100,000 youth ages 10−17
Amer. Indian
White
Asian
80 83 86 89 92 95 98 01 04 07 10 13 16 1
0
200
400
600
800
1,000
1,200
Year
Arrests per 100,000 youth ages 10−17
Male
Female
80 83 86 89 92 95 98 01 04 07 10 13 16 19
0
100
200
300
400
500
Year
Arrests per 100,000 youth ages 10−17
Female

Chapter 5: Law enforcement and youth
125
The juvenile arrest rate for weapons law violations in 2019
was 77% below the 1994 peak
The juvenile weapons arrest fell
65% since 2006
Between 1980 and 1994, the juvenile
arrest rate for weapons law violations
increased 146%. Then the rate fell sub-
stantially, so that by 2002 the rate was
just 21% more than the 1980 level.
This decline was interrupted between
2002 and 2006, when the juvenile
weapons law violation arrest rate in-
creased 32%. The rate has since fallen
65%, bringing the 2019 rate to its low-
est level since at least 1980, and 77%
below the 1994 peak. It must be re-
membered that these statistics do not
reflect all arrests for weapons offenses.
An unknown number of other arrests
for more serious crimes also involved a
weapons offense as a secondary charge,
but the FBI’s arrest statistics classify
such arrests by their most serious
charge and not the weapons offense.
The weapons arrest rate for White
and Black youth reached a new
low in 2019
Between 1980 and 1994, the arrest
rate for weapons law violations in-
creased proportionally more for fe-
males (256%) than for males (139%).
Since the peak, both rates experienced
brief periods of decline and growth
through the mid-2000s, then declined
steadily through 2019. While the rela-
tive decline in both rates was the same
between 2006 and 2019 (64%), the
male rate reached a historic low in
2019 but the female rate was 3% above
the 1980 low point.
Arrest rates for weapons law violations
peaked in 1993 for Black juveniles, in
1994 for White and Asian juveniles,
and in 1995 for American Indian juve-
niles. The increase between 1980 and
the peak year was the greatest for Black
juveniles (215%), followed by Whites
(126%), Asians (104%), and American
Indians (83%). Similar to trends for
males and females, the rates for all ra-
cial groups dropped quickly after their
peaks, grew between 2002 and 2006,
and fell again. Since 2006, the rate for
White youth and Black youth declined
(67% and 59%, respectively) to a new
low in 2019, while the rate for Asian
youth fell 62% to reach a low in 2017,
then stayed within a limited range
through 2019. Conversely, the rate for
American Indian youth fell 65% to
reach a low in 2014 and then increased
through 2019.
80 83 86 89 92 95 98 01 04 07 10 13 16 19
0
40
80
120
160
200
240
Year
Arrests per 100,000 youth ages 10−17
Weapons
The juvenile arrest rate for weapons law violations reached a new low in
2019, 77% below the 1994 peak
Q Juvenile arrests for weapons law violations typically involve older juveniles (ages
15–17). Since 2005, older juveniles accounted for at least two-thirds of juvenile
weapons law violation arrests.
Source: Analysis of arrest data from the Bureau of Justice Statistics and the National Center for Juve-
nile Justice, and population data from the U.S. Bureau of the Census. (See arrest rate data source note
at the end of this chapter for details.)
Weapons law violation arrest rate trends by gender and race
80 83 86 89 92 95 98 01 04 07 10 13 16 19
0
100
200
300
400
500
Year
Arrests per 100,000 youth ages 10−17
Black
White
80 83 86 89 92 95 98 01 04 07 10 13 16 19
0
40
80
120
160
200
Year
Arrests per 100,000 youth ages 10−17
Amer. Indian
White
Asian
80 83 86 89 92 95 98 01 04 07 10 13 16 19
0
100
200
300
400
Year
Arrests per 100,000 youth ages 10−17
Male
Female
80 83 86 89 92 95 98 01 04 07 10 13 16 19
0
5
10
15
20
25
30
35
Year
Arrests per 100,000 youth ages 10−17
Female

Youth and the Juvenile Justice System: 2022 National Report
126
The juvenile drug abuse violation arrest rate was cut in half
in the last 10 years and reached its lowest level since 1980
Racial disparity in drug arrests
increased in the 1980s and early
1990s
The annual juvenile arrest rates for
drug abuse violations (a category that
includes both drug possession and
drug sales) varied within a limited
range in the 1980s. A closer look at ju-
venile drug arrest rates finds sharp ra-
cial differences. The drug abuse viola-
tion arrest rate for White juveniles
generally declined between 1980 and
1991 while the Black rate increased
dramatically. The White rate fell 54%,
compared with a 190% increase for
Black youth. In 1980, the White and
Black arrest rates were essentially
equal, with Black youth involved in
14% of all juvenile drug arrests. By
1991, the Black rate was nearly 6 times
the White rate, and Black youth were
involved in 52% of all juvenile drug ar-
rests.
Drug arrests soared for all youth
between 1991 and 1997
Between 1991 and 1997, the juvenile
arrest rate for drug abuse violations in-
creased 138% and then declined. Most
of the decline took place in the last 10
years, when the rate fell 52%. By 2019,
the arrest rate reached its lowest level
since at least 1980, and was 64% below
the 1997 peak.
After a period of substantial growth in
the early and mid-1990s, the male ju-
venile arrest rate for drug abuse viola-
tions generally declined after 1996
while the female rate remained relative-
ly stable through the mid-2000s. Both
rates declined in the last 10 years (57%
for males, 24% for females). By 2019,
the male rate reached a new historic
low, while the female rate was more
than twice the 1991 low point.
The drug abuse violation arrest rate for
Black youth declined considerably after
the 1996 peak, and most of the decline
took place since 2006 (69%). Con-
versely, after reaching a peak in 1997,
the White rate stayed within a limited
range through 2010, then declined
51%. By 2019, the rate for Black youth
was at its lowest level since at least
1980, but the rate for White youth was
44% above the 1991 low point.
80 83 86 89 92 95 98 01 04 07 10 13 16 19
0
100
200
300
400
500
600
700
Year
Arrests per 100,000 youth ages 10−17
Drug abuse
The juvenile drug abuse arrest rate declined annually since 2010
Q The juvenile drug abuse arrest rate declined for all racial groups in the past 10
years, falling 56% for Black youth, 51% for White youth, 46% for Asian youth, and
3% for American Indian youth.
Q Drug abuse arrest rates for American Indian youth in 2019 were 3 times their 1991
low point, and the rate for Asian youth was 22% above their 1989 low point.
Source: Analysis of arrest data from the Bureau of Justice Statistics and the National Center for Juve-
nile Justice, and population data from the U.S. Bureau of the Census. (See arrest rate data source note
at the end of this chapter for details.)
Drug abuse violation arrest rate trends by gender and race
80 83 86 89 92 95 98 01 04 07 10 13 16 19
0
400
800
1,200
1,600
Year
Arrests per 100,000 youth ages 10−17
Black
White
80 83 86 89 92 95 98 01 04 07 10 13 16 19
0
100
200
300
400
500
600
Year
Arrests per 100,000 youth ages 10−17
Amer. Indian
White
Asian
80 83 86 89 92 95 98 01 04 07 10 13 16 19
0
200
400
600
800
1,000
1,200
Year
Arrests per 100,000 youth ages 10−17
Male
Female
80 83 86 89 92 95 98 01 04 07 10 13 16 19
0
50
100
150
200
250
Year
Arrests per 100,000 youth ages 10−17
Female

Chapter 5: Law enforcement and youth
127
The juvenile arrest rate for disorderly conduct in 2019 was
77% below the 1996 peak
80 83 86 89 92 95 98 01 04 07 10 13 16 19
0
100
200
300
400
500
600
700
Year
Arrests per 100,000 youth ages 10−17
Disorderly conduct
The juvenile arrest rate for disorderly conduct declined annually since
2006
Q Since 2006, the juvenile arrest rate for disorderly conduct declined 70% or more for
White, Black, and Asian youth, and was cut in half for American Indian youth. By
2019, the rates for White youth and Black youth were at their lowest levels since at
least 1980, while the rates for American Indian youth and Asian youth were above
their historic low years (2016 and 2018, respectively).
Source: Analysis of arrest data from the Bureau of Justice Statistics and the National Center for Juve-
nile Justice, and population data from the U.S. Bureau of the Census. (See arrest rate data source note
at the end of this chapter for details.)
Disorderly conduct arrest rate trends by gender and race
80 83 86 89 92 95 98 01 04 07 10 13 16 19
0
400
800
1,200
1,600
Year
Arrests per 100,000 youth ages 10−17
Black
White
80 83 86 89 92 95 98 01 04 07 10 13 16 19
0
100
200
300
400
500
600
Year
Arrests per 100,000 youth ages 10−17
Amer. Indian
White
Asian
80 83 86 89 92 95 98 01 04 07 10 13 16 19
0
200
400
600
800
1,000
1,200
Year
Arrests per 100,000 youth ages 10−17
Male
Female
80 83 86 89 92 95 98 01 04 07 10 13 16 19
0
100
200
300
400
500
Year
Arrests per 100,000 youth ages 10−17
Female
In 2019, the juvenile disorderly
conduct arrest rate reached its
lowest level since 1980
The juvenile arrest rate for disorderly
conduct more than doubled between
1984 and 1996, declined through
2000, then increased again through
2006. This period of increase was fol-
lowed by 13 years of decline through
2019, during which time the juvenile
disorderly conduct arrest rate fell more
than 70%, and reached its lowest level
since 1980.
Female and male juvenile arrest
rates for disorderly conduct fol-
lowed a similar pattern
For both females and males, the juve-
nile arrest rate for disorderly conduct
increased between 1984 and 1996, but
the increase in the female rate out-
paced that of males (192% vs. 97%).
After reaching its peak in 1996, the
male rate experienced brief periods of
decline and growth through 2006.
The female rate also declined after
1996, but this decline was followed by
a period of growth that saw the rate
reach a new peak in 2006. Since 2006,
the rate for both males and females de-
clined continuously through 2019, but
the decline in the male rate exceeded
the decline in the female rate (75% vs.
70%). By 2019, the juvenile male ar-
rest rate for disorderly conduct was at
its lowest point since at least 1980,
while the female rate was 4% above its
1984 lowpoint. As a result of these
changes, the female share of juvenile
arrests for disorderly conduct has
steadily grown, from 16% in 1984 to
37% in 2019

Youth and the Juvenile Justice System: 2022 National Report
128
Age-specific arrest rates for violent crime in 2019 were well
below their mid-1990s peak for all juvenile age groups
What is the age-crime curve?
Most displays of juvenile and adult ar-
rest rates show data that combines all
ages younger than 18 into the juvenile
group and all ages 18 and older into
the adult group. However, UCR data
allow the calculation of age-specific ar-
rest rates. When graphed, these rates
show a mountain-shaped curve—which
increases from adolescence through
young adulthood and then declines—
often referred to as the “age-crime
curve.” This age-crime curve is seen
across offense categories, although the
exact shape of the curve may change
along with various factors, such as of-
fense or gender. Variations are also
seen over time.
Although the overall juvenile arrest
rate for violent crime offenses was
131.7 per 100,000 youth ages 10–17
in 2019, the age-specific rates ranged
from 24.4 for children ages 10–12 to
281 for 17-year-olds. The age with the
highest rate were adults ages 25 to 29
with a rate of 345.8. In 2019, all ages
between 18 and 34 had violent crime
arrest rates greater than 300. After
youth ages 10–12, the age group with
the next lowest rate were adults age 60
(44.7 per 100,000 persons ages 60–
64).
The shape of the age-crime curve
has changed for some offenses
For both murder and aggravated as-
sault, age-specific arrest rates in 2019
were substantially below the levels of
the mid-1990s. The biggest declines
were in the age groups that had the
highest rates. For example, between
the mid-1990s peak and 2019, age-
specific murder arrest rates fell 60% or
more for all persons under age 25, and
the rates for aggravated assault fell
more than 50% for persons under age
23.
Simple assault arrest rates in 2019 were
higher than the rates in 1980 for all ju-
0
10
20
30
40
50
60
10 15 20 25 30 35 40 45 50 55 60 65
Age
1980
1993
2019
Murder
Arrests per 100,000 population in age group
0
100
200
300
400
500
600
10 15 20 25 30 35 40 45 50 55 60 65
Age
1980
1994
2019
Weapons
Arrests per 100,000 population in age group
0
100
200
300
400
10 15 20 25 30 35 40 45 50 55 60 65
Age
1980
1994
2019
Robbery
Arrests per 100,000 population in age group
0
500
1,000
1,500
2,000
2,500
3,000
10 15 20 25 30 35 40 45 50 55 60 65
Age
1980
1997
2019
Drug abuse
Arrests per 100,000 population in age group
0
200
400
600
800
1,000
1,200
10 15 20 25 30 35 40 45 50 55 60 65
Age
1980
1994
2019
Violent crime
Arrests per 100,000 population in age group
0
1,000
2,000
3,000
4,000
5,000
10 15 20 25 30 35 40 45 50 55 60 65
Age
1980
1988
2019
Property Crime Index
Arrests per 100,000 population in age group
The shape of the age-crime curve varies across offense categories and
over time within offenses
Q Violent crime arrest rates were higher in 2019 than in 1980 for adults age 30 and
over; for juveniles, 2019 rates were well below the rates in 1980.
Q Property Crime Index arrest rates in 2019 were below 1980 rates for ages younger
than 30; for youth younger than 18, the rates in 2019 were at least 80% below the
rates in 1980.
Q For murder and robbery, 2019 arrests rates declined for all age groups from their
peak year, and the relative decline was greater for juveniles than young adults. For
example, murder arrest rates dropped an average of 81% for youth ages
15–17, 71% for young adults ages 18–20, and 64% for young adults ages 21–24.
Q The 2019 arrest rates for weapons offenses were less than the 1980 rates for all
ages, and the largest relative declines were for those ages 15 through 18.
Q Unlike other offense categories, the 2019 arrest rates for drug abuse violations
were higher than the 1980 arrest rates for all adults age 18 or older.
Note: Rates are shown for 2019, 1980, and the year with the highest juvenile arrest rate peak for each
offense.
Source: Analysis of arrest data from the Bureau of Justice Statistics and the National Center for Juve-
nile Justice, and population data from the U.S. Bureau of the Census. (See arrest rate data source
note at the end of this chapter for details.)
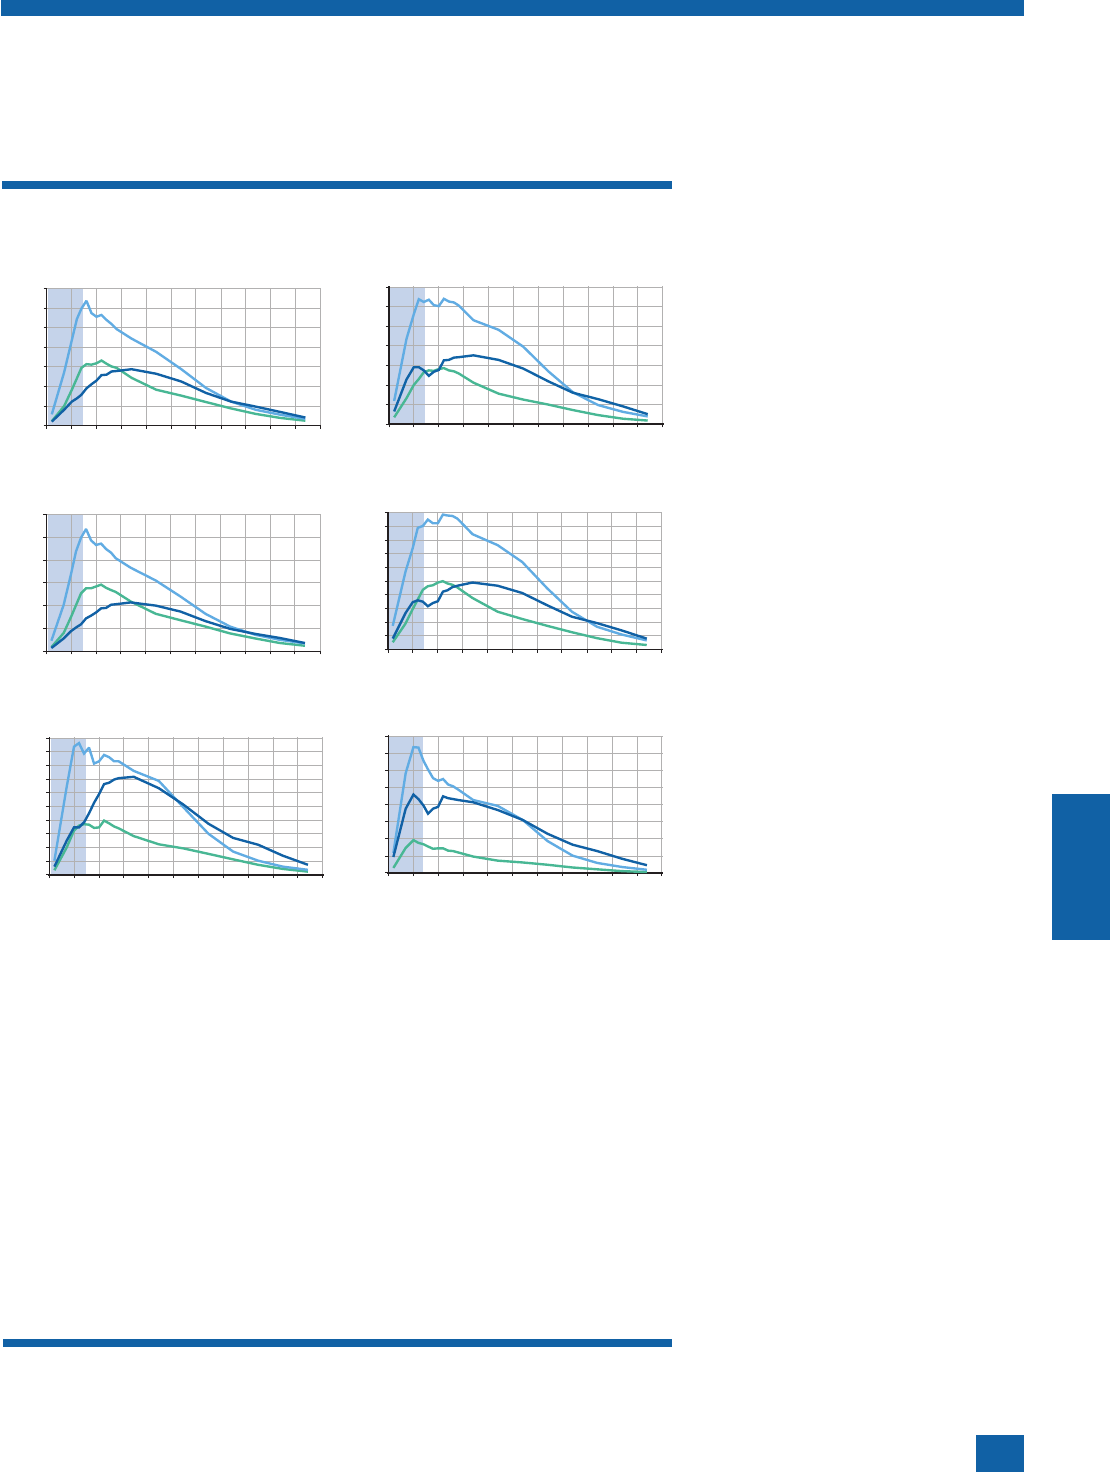
Chapter 5: Law enforcement and youth
129
venile age groups, and for adults ages
21 and older, but the 2019 rates were
below the 1997 level for all age groups
through age 45. In fact, between 1997
and 2019, age-specific arrests rates for
simple assault fell 45% or more for each
juvenile age group as well as adults
ages 18–24. However, unlike the pat-
tern in 1997, when the simple assault
arrest rate peaked at age 21, the rate in
2019 peaked at age 27.
Age-crime curves vary by gender
within offense categories
A closer look at the age-specific arrest
rates for assault by gender shows some
very different patterns for males and
females. The age-specific arrest rates
for both aggravated and simple assault
declined for males and females from
their respective peak years through
2019, but the relative declines were
greater for males than females for all
offense-age combinations.
For aggravated assault, 2019 arrest
rates for males were below the levels of
1980 for all age groups under 30, but
for females, age-specific rates in 2019
were higher than the corresponding
rates in 1980 for all but 16-year-olds.
For simple assault, the 2019 age-specif-
ic arrest rates for males were below the
1980 rates for persons ages 16–23,
while the rates for females in 2019
were above the 1980 rates for all age
groups.
0
200
400
600
800
1,000
1,200
10 15 20 25 30 35 40 45 50 55 60 65
Age
1980
1994
2019
Aggravated assault:
male
Arrests per 100,000 population in age group
0
400
800
1,200
1,600
2,000
10 15 20 25 30 35 40 45 50 55 60 65
Age
1980
1997
2019
Simple assault:
male
Arrests per 100,000 population in age group
0
40
80
120
160
200
10 15 20 25 30 35 40 45 50 55 60 65
Age
1980
1994
2019
Aggravated assault:
female
Arrests per 100,000 population in age group
0
200
400
600
800
10 15 20 25 30 35 40 45 50 55 60 65
Age
1980
1997
2019
Simple assault:
female
Arrests per 100,000 population in age group
0
100
200
300
400
500
600
700
10 15 20 25 30 35 40 45 50 55 60 65
Age
1980
1994
2019
Aggravated assault
Arrests per 100,000 population in age group
0
200
400
600
800
1,000
1,200
1,400
10 15 20 25 30 35 40 45 50 55 60 65
Age
1980
1997
2019
Simple assault
Arrests per 100,000 population in age group
Age-specific arrest rates for aggravated assault and simple assault vary
by gender
Q Overall, the 2019 aggravated assault arrest rates for youth younger than 15 were
about the same as in 1980.
Q The 2019 age-specific simple assault arrests rates for juveniles were higher than
the corresponding rates in 1980 for all but persons ages 18–20, but the patterns
varied by gender. Across all ages, 2019 simple assault arrest rates for females were
higher than in 1980; for males, the rates in 2019 were lower than in 1980 for per-
sons ages 16–23.
Q Assault arrest rates for females were well below the rates for males, but the magni-
tude of the difference varied by offense. For example, for simple assault, female
rates for persons under age 23 were about half the rate of males of the same age;
for aggravated assault, female rates were about one-third the corresponding rates
for males.
Note: Rates are shown for 2019, 1980, and the year with the highest juvenile arrest rate peak for each
offense.
Source: Analysis of arrest data from the Bureau of Justice Statistics and the National Center for Juve-
nile Justice, and population data from the U.S. Bureau of the Census. (See arrest rate data source
note at the end of this chapter for details.)

Youth and the Juvenile Justice System: 2022 National Report
130
Clearance figures implicate juveniles in about 1 in 20 murders,
1 in 15 aggravated assaults, and 1 in 7 robberies in 2019
Clearances give insight into the
relative involvement of juveniles
and adults in crime
Clearance statistics measure the pro-
portion of reported crimes that are re-
solved by an arrest or other, exception-
al means (e.g., death of the person
who committed the crime, unwilling-
ness of the victim to cooperate). A sin-
gle arrest may result in many clearances
if the person arrested committed sever-
al crimes. Or multiple arrests may re-
sult in a single clearance if the crime
was committed by a group of people.
The FBI reports information on the
proportion of clearances that involved
persons under age 18. This statistic is a
better indicator of the proportion of
crime committed by this age group
than is the arrest proportion, although
there are some concerns that even the
clearance statistic overestimates the ju-
venile proportion of crimes. Neverthe-
less, trends in clearance proportions are
reasonable indicators of changes in the
relative involvement of juveniles in var-
ious crimes.
The juvenile share of violent crime
returned to levels of the late
1980s
The FBI’s
Crime in the United States
series shows that the proportion of vio-
lent crimes attributed to juveniles has
declined nearly every year since 2006.
The juvenile proportion of violent
crimes cleared by arrest (or exceptional
means) grew from an average of 9% in
the 1980s to 14% in 1994, then fell to
12% in 1998, where it remained
through most of the 2000s. By 2011,
the proportion fell below 10%, and has
remained at or below 8% since 2015.
In 2019, juveniles committed 1 in 13
violent crimes known to law enforce-
ment.
Each of the violent crime offenses
showed an increase in juvenile clear-
ances between 1980 and the mid-
1990s. The juvenile proportion of
murder clearances peaked in 1994 at
10% and then fell. Between 2010 and
2019, the proportion has stayed within
a limited range, averaging 4% over the
past 10 years. The juvenile proportion
of robbery clearances peaked in 1995
(20%), and then declined through the
mid-2000s. In the last 10 years, the
proportion varied between 12% and
14%; in 2019, about 1 in 7 (14%) rob-
beries were attributed to juveniles.
After reaching a peak in 1994 (13%),
the juvenile proportion of aggravated
assault clearances was relatively con-
stant through the mid-2000s, and then
declined through 2019. The propor-
tion stayed within a limited range over
the last 5 years, and well below the
1987 low point.
80 83 86 89 92 95 98 01 04 07 10 13 16 19
0%
2%
4%
6%
8%
10%
12%
14%
16%
Year
Percent of clearances involving youth
Violent crime
The juvenile share of property crime has fallen substantially since 1980
Note: Prior to 2013, rape is included in the calculation for violent crimes, but is excluded in the calcula-
tion for 2013 through 2019.
Source: Authors’ analysis of the FBI’s
Crime in the United States
reports for 1980 through 2019.
80 83 86 89 92 95 98 01 04 07 10 13 16 19
0%
5%
10%
15%
20%
25%
30%
Year
Percent of clearances involving youth
Property Crime Index
The juvenile proportion of violent crimes cleared by arrest or
exceptional means has remained relatively stable in the last 5 years

Chapter 5: Law enforcement and youth
131
A juvenile committed roughly 1 in
12 property crimes known to law
enforcement in 2019
In the 1980s, the juvenile proportion
of cleared Property Crime Index of-
fenses decreased from 28% to 20%.
This proportion then increased in the
early 1990s, peaking in 1995 at 25%.
After 1995, the juvenile proportion of
clearances for Property Crime Index
offenses generally declined, so that by
2019 it was at its lowest level (8%)
since at least 1980.
By 2019, juvenile clearance propor-
tions for the crimes of burglary, larce-
ny-theft, and arson were at their lowest
levels since 1980 (8%, 8%, and 17%, re-
spectively). For motor vehicle theft, the
juvenile proportion of clearances
reached a low-point in 2014 (9%) and
then increased to 13% in 2019.
The juvenile proportion of crimes
cleared varied with community
size
In general, larger cities had a lower
proportion of clearances attributed to
juvenile arrests for violent crimes and
Property Crime Index offenses in
2019.
Percent of clearances involving juveniles,
2019:
Population served by
reporting agencies
Violent
crime
Property
Crime
Index
All agencies 7.8% 8.4%
1 million or more 7.3 5.9
500,000 to 999,999 7.1 7.7
250,000 to 499,999 8.0 10.1
100,000 to 249,000 8.1 9.4
50,000 to 99,999 8.0 9.0
25,000 to 49,999 8.1 8.4
10,000 to 24,999 8.1 7.3
under 10,000 10.5 8.0
Source: Authors’ analysis of the FBI’s
Crime
in the United States 2019
.
Note: Arson clearance data were first reported in 1981.
Source: Authors’ analysis of the FBI’s
Crime in the United States
reports for 1980 through 2019.
80 83 86 89 92 95 98 01 04 07 10 13 16 19
0%
5%
10%
15%
20%
25%
30%
Year
Percent of clearances involving youth
Burglary
80 83 86 89 92 95 98 01 04 07 10 13 16 19
0%
5%
10%
15%
20%
25%
30%
Year
Percent of clearances involving youth
Larceny−theft
80 83 86 89 92 95 98 01 04 07 10 13 16 19
0%
5%
10%
15%
20%
25%
Year
Percent of clearances involving youth
Motor vehicle theft
80 83 86 89 92 95 98 01 04 07 10 13 16 19
0%
10%
20%
30%
40%
50%
Year
Percent of clearances involving youth
Arson
In 2019, the juvenile shares of clearances for burglary, larceny-theft, and
arson were at their lowest points since 1980
80 83 86 89 92 95 98 01 04 07 10 13 16 19
0%
2%
4%
6%
8%
10%
12%
Year
Percent of clearances involving youth
Murder
80 83 86 89 92 95 98 01 04 07 10 13 16 19
0%
5%
10%
15%
20%
25%
Year
Percent of clearances involving youth
Robbery
80 83 86 89 92 95 98 01 04 07 10 13 16 19
0%
2%
4%
6%
8%
10%
12%
14%
Year
Percent of clearances involving youth
Aggravated assault
Clearance statistics imply that juvenile involvement in aggravated
assault has declined since 2006

Youth and the Juvenile Justice System: 2022 National Report
132
In 2019, about one-third of the states had a juvenile
violent crime arrest rate above the national average
0 to 89 (14 states)
89 to 139 (15 states)
139 to 185 (9 states)
185 or above (6 states)
Data not available (7 states)
2019 violent crime
arrests per 100,000
youth ages 10–17
DC
Among states with at least minimally adequate reporting, those with high juvenile violent crime arrest rates
in 2019 were Delaware, Maryland, and Nevada
Arrests of youth under age 18
per 100,000 youth ages 10–17, 2019
Arrests of youth under age 18
per 100,000 youth ages 10–17, 2019
State
Reporting
population
coverage
Violent
Crime
Robbery
Aggrav.
assault
Other
assault Weapon State
Reporting
population
coverage
Violent
Crime
Robbery
Aggrav.
assault
Other
assault Weapon
U.S. total 77% 139 53 83 378 49 Missouri 63% 165 52 107 460 36
Alabama 2 35 23 12 46 35 Montana 88 183 4 178 638 18
Alaska 94 198 33 158 514 25 Nebraska 91 100 67 32 828 59
Arizona 77 181 51 127 618 50 Nevada 96 298 84 212 679 93
Arkansas 88 144 28 113 603 39 New Hampshire 94 44 10 31 534 3
California 97 168 72 94 187 67 New Jersey 100 111 52 57 131 68
Colorado 85 145 51 92 398 68 New Mexico 65 129 17 108 498 49
Connecticut 100 76 41 34 485 43 New York 51 106 49 54 203 26
Delaware 100 327 116 210 906 64 North Carolina 69 104 54 44 308 51
Dist. of Columbia 0 NA NA NA NA NA North Dakota 100 80 9 68 699 29
Florida 100 157 65 89 412 45 Ohio 79 102 40 60 505 35
Georgia 22 99 33 62 392 56 Oklahoma 99 89 25 62 205 40
Hawaii 81 90 59 31 344 15 Oregon 88 116 35 80 316 21
Idaho 98 77 7 65 378 49 Pennsylvania 25 197 49 144 404 50
Illinois 1 327 180 140 889 160 Rhode Island 100 85 26 57 428 95
Indiana 40 94 20 73 323 42 South Carolina 84 115 37 73 516 90
Iowa 82 168 26 143 632 45 South Dakota 92 118 15 100 750 122
Kansas 55 104 19 84 427 30 Tennessee 95 194 70 119 618 66
Kentucky 97 67 30 34 213 23 Texas 90 136 48 85 336 25
Louisiana 75 243 47 188 689 106 Utah 89 65 16 48 389 46
Maine 100 26 7 20 441 6 Vermont 100 60 11 48 443 32
Maryland 100 323 198 122 872 103 Virginia 96 80 39 39 348 34
Massachusetts 86 86 16 70 226 18 Washington 93 124 60 62 418 33
Michigan 96 92 23 67 289 31 West Virginia 53 21 3 18 104 2
Minnesota 96 145 70 72 418 55 Wisconsin 94 136 42 91 451 77
Mississippi 42 76 29 42 373 60 Wyoming 88 66 0 66 849 22
NA = Arrest counts were not available for the District of
Columbia in the FBI’s
Crime in the United States 2019
.
Notes: Arrest rates for jurisdictions with less than com-
plete reporting may not be representative of the entire
state. In the map, rates were classified as “Data not
available” when agencies with jurisdiction over more than
50% of their state’s population did not report. Readers
should consult the related technical note at the end of
this chapter. Detail may not add to totals because of
rounding.
Source: Analysis of arrest data from
Crime in the United
States 2019
(Washington, DC: Federal Bureau of Investi-
gation, 2019) tables 3 and 22, and population data from
the National Center for Health Statistics’
Vintage 2019
Postcensal Estimates of the Resident Population of the
United States (April 1, 2010, July 1, 2010–July 1, 2019),
by Year, County, Single-Year of Age (0, 1, 2, . . . , 85
Years and Over), Bridged Race, Hispanic Origin, and
Sex
[machine-readable data files available online at
www.cdc.gov/nchs/nvss/bridged_race.htm, as of July 9,
2020].

Chapter 5: Law enforcement and youth
133
High juvenile property crime arrest rates in 2019 did not
necessarily mean high violent crime arrest rates
0 to 250 (10 states)
250 to 389 (9 states)
389 to 650 (17 states)
650 or above (8 states)
Data not available (7 states)
2019 Property Crime
Index arrests per 100,000
youth ages 10–17
DC
Among states with at least minimally adequate reporting, those with high juvenile Property Crime Index
arrest rates in 2019 were Montana, Nebraska, and North Dakota
Arrests of youth under age 18
per 100,000 youth ages 10–17, 2019
Arrests of youth under age 18
per 100,000 youth ages 10–17, 2019
State
Reporting
population
coverage
Property
Crime
Index
Burglary
Larceny-
theft
Motor
vehicle
theft
Vandalism
State
Reporting
population
coverage
Property
Crime
Index
Burglary
Larceny-
theft
Motor
vehicle
theft
Vandalism
U.S. total 77% 389 67 270 46 93 Missouri 63% 461 60 342 55 109
Alabama 2 808 0 785 23 69 Montana 88 724 68 588 60 269
Alaska 94 444 152 205 72 149 Nebraska 91 952 48 807 85 323
Arizona 77 489 84 343 57 254 Nevada 96 414 74 295 39 110
Arkansas 88 506 82 387 34 94
New Hampshire
94 208 22 170 15 167
California 97 168 61 74 30 54 New Jersey 100 247 49 176 19 56
Colorado 85 619 64 466 77 170 New Mexico 65 183 30 142 10 65
Connecticut 100 400 61 270 65 85 New York 51 359 62 254 39 147
Delaware 100 597 157 352 80 152 North Carolina 69 383 91 253 34 65
Dist. of Columbia
0 NA NA NA NA NA North Dakota 100 747 92 565 79 245
Florida 100 597 140 347 107 44 Ohio 79 354 50 275 25 94
Georgia 22 397 67 302 24 54 Oklahoma 99 357 69 239 42 47
Hawaii 81 288 35 240 9 19 Oregon 88 465 60 355 36 144
Idaho 98 439 56 342 24 129 Pennsylvania 25 377 60 278 32 125
Illinois 1 441 33 334 40 167 Rhode Island 100 358 76 239 25 199
Indiana 40 312 34 241 35 48 South Carolina 84 444 85 323 31 77
Iowa 82 694 108 500 74 231 South Dakota 92 623 55 471 90 178
Kansas 55 313 41 240 23 119 Tennessee 95 566 81 362 117 128
Kentucky 97 272 60 158 44 50 Texas 90 312 47 227 35 45
Louisiana 75 701 173 453 65 105 Utah 89 616 48 533 26 209
Maine 100 462 69 352 28 181 Vermont 100 251 78 143 26 147
Maryland 100 656 108 443 93 142 Virginia 96 345 32 287 21 54
Massachusetts 86 122 29 73 17 45 Washington 93 276 56 192 24 110
Michigan 96 278 38 208 29 45 West Virginia 53 33 8 21 3 20
Minnesota 96 700 54 560 80 123 Wisconsin 94 699 62 545 84 276
Mississippi 42 439 102 292 42 45 Wyoming 88 595 88 446 57 241
NA = Arrest counts were not available for the District of
Columbia in the FBI’s
Crime in the United States 2019
.
Notes: Arrest rates for jurisdictions with less than com-
plete reporting may not be representative of the entire
state. In the map, rates were classified as “Data not
available” when agencies with jurisdiction over more than
50% of their state’s population did not report. Readers
should consult the related technical note at the end of
this chapter. Detail may not add to totals because of
rounding.
Source: Analysis of arrest data from
Crime in the United
States 2019
(Washington, DC: Federal Bureau of Investi-
gation, 2019) tables 3 and 22, and population data from
the National Center for Health Statistics’
Vintage 2019
Postcensal Estimates of the Resident Population of the
United States (April 1, 2010, July 1, 2010–July 1, 2019),
by Year, County, Single-Year of Age (0, 1, 2, . . . , 85
Years and Over), Bridged Race, Hispanic Origin, and
Sex
[machine-readable data files available online at
www.cdc.gov/nchs/nvss/bridged_race.htm, as of July 9,
2020].

Youth and the Juvenile Justice System: 2022 National Report
134
What do police do with juveniles they arrest?
Many large local police depart-
ments have personnel designated
to address problems related to
juveniles
The Bureau of Justice Statistics’ Local
Police Departments, 2016 report, part
of the Law Enforcement Management
and Administrative Statistics (LEMAS)
data collection series, provides detailed
characteristics of an estimated 12,261
local police departments throughout
the U.S. In 2016, these local depart-
ments employed nearly 600,000 full-
time persons, and more than 468,000
of these employees were sworn person-
nel with full arrest powers.
Many local police departments had
personnel designated to address specif-
ic crime-related problems or serve in
various functions. In some instances,
these issues were addressed by a spe-
cialized unit that had full-time person-
nel. Departments serving 100,000 or
more residents were more likely than
those serving less than 100,000 resi-
dents to have the personnel necessary
to operate such units.
In 2016, the majority of local police
departments serving 100,000 or more
residents assigned personnel full-time
to specialized units for child abuse
(72%), drug enforcement (89%), gangs
(71%), domestic violence (69%), school
safety (59%), and juvenile crimes
(50%). However, the proportions were
much lower among departments serv-
ing less than 100,000 residents: child
abuse (6%), drug enforcement (14%),
gangs (3%), domestic violence (6%),
school safety (11%), and juvenile
crimes (7%).
Most arrested juveniles were
referred to court
In nine states, statutes define some
persons younger than age 18 as adults
for prosecution purposes. These per-
sons are not under the original jurisdic-
tion of the juvenile justice system; they
are under the jurisdiction of the crimi-
nal justice system. For arrested youth
who are younger than 18 and under
the original jurisdiction of their state’s
juvenile justice system, the FBI’s UCR
Program monitors what happens as a
result of the arrest. This is the only as-
pect of the UCR data collection that is
sensitive to state variations in the legal
definition of a juvenile.
In 2019, 42% of arrests involving
youth eligible in their state for process-
ing in the juvenile justice system were
handled within law enforcement agen-
cies, 49% were referred to juvenile
court, and 4% were referred directly to
criminal court. The others were re-
ferred to a welfare agency or to anoth-
er police agency. The proportion of ju-
venile arrests referred to juvenile court
in 2019 was less than the proportion
in 1980 (58%).
In 2019, juvenile arrests were less like-
ly to result in referral to juvenile court
in large cities (population over
250,000) than in moderate-size cities
(population 100,000–250,000) or
small cities (population less than
100,000). In large cities, 43% of juve-
nile arrests resulted in referral to juve-
nile court, compared with 56% in
moderate-size cities and 49% in small
cities. Conversely, a larger proportion
of juvenile arrests in larger cities (50%)
were handled in the department and
released than in moderate-size (43%)
or small cities (42%).

Chapter 5: Law enforcement and youth
135
Sources
Bureau of Justice Statistics. Arrest Data
Analysis Tool [available online at www.
bjs.gov/index.cfm?ty=datool&surl=/
arrests/index.cfm, retrieved December
12, 2018].
Federal Bureau of Investigation. Vari-
ous years.
Crime in the United States
for 1980 through 2019. Washington,
DC: FBI.
Federal Bureau of Investigation. Na-
tional Incident-Based Reporting Sys-
tem. Available: www.fbi.gov/services/
cjis/ucr/nibrs [retrieved December 14,
2020].
Federal Bureau of Investigation. 2018.
30 Questions and Answers about
NIBRS Transition
. Available: www.fbi.
gov/file-repository/ucr/30-faqs-
about-
nibrs-transition-oct-2018.pdf/view.
Federal Bureau of Investigation. 2020.
Five Things to Know About NIBRS:
Transitioning to the National Incident-
Based Reporting System Will Offer
More Robust Crime Statistics Data to
Police, Public
. Available: www.fbi.gov/
news/stories/five-things-to-know-
about-
nibrs-112520.
Hyland, S., and Davis, E. 2019.
Local
Police Departments, 2016: Personnel
,
Washington, DC: U.S. Department of
Justice, Bureau of Justice Statistics.
National Center for Health Statistics.
2004.
Bridged-Race Intercensal Esti-
mates of the July 1, 1990–July 1,
1999, United States Resident Popula-
tion by County, Single-Year of Age,
Sex, Race, and Hispanic Origin
[data
files]. Prepared by the U.S. Census Bu-
reau with support from the National
Cancer Institute. Available online at
www.cdc.gov/nchs/nvss/bridged_
race.htm [released July 26, 2004].
National Center for Health Statistics.
2012.
Intercensal Estimates of the Res-
ident Population of the United States
for July 1, 2000–July 1, 2009, by Year,
Arrest rate source note
Arrest estimates developed by the
Bureau of Justice Statistics for 1980–
2014 were retrieved from their
Arrest
Data Analysis Tool
[available online at
www.bjs.gov/index.cfm?ty=datool&
surl=/arrests/index.cfm, retrieved De-
cember 12, 2018]; the National Cen-
ter for Juvenile Justice developed ar-
rest estimates for 2015–2019 based
on data published in the FBI’s
Crime
in the United States
reports for the
respective years; population data for
1980–1989 is from the U.S. Census
Bureau,
U.S. Pop u la tion Es ti mates by
Age, Sex, Race, and His pan ic Origin:
1980 to 1999
[machine-readable data
files available online, re leased April
11, 2000]; population data for 1990–
1999 is from the National Center for
Health Statistics (prepared by the
U.S. Census Bureau with support
from the National Cancer Institute),
Bridged-Race Intercensal Estimates
of the July 1, 1990–July 1, 1999,
United States Resident Population by
County, Single-Year of Age, Sex,
Race, and Hispanic Origin
[machine-
readable data files available online at
www.cdc.gov/nchs/nvss/bridged_
race.htm, released July 26, 2004];
population data for 2000–2009 is
from the National Center for Health
Statistics (prepared under a collabor-
ative arrangement with the U.S. Cen-
sus Bureau),
Intercensal Estimates of
the Resident Population of the United
States for July 1, 2000–July 1, 2009,
by Year, County, Single-Year of Age (0,
1, 2, . . . , 85 Years and Over), Bridged
Race, Hispanic Origin, and Sex
[ma-
chine-readable data files available on-
line at www.cdc.gov/nchs/nvss/
bridged_race.htm, as of October 26,
2012, following release by the U.S.
Census Bureau of the revised un-
bridged intercensal estimates by
5-year age group on October 9, 2012];
and population data for 2010–2019
are from the National Center for Health
Statistics (prepared under a collabora-
tive arrangement with the U.S. Census
Bureau),
Vintage 2019 Postcensal Es-
timates of the Resident Population of
the United States (April 1, 2010, July
1, 2010–July 1, 2019), by Year, County,
Single-Year of Age (0, 1, 2, . . . , 85
Years and Over), Bridged Race, His-
panic Origin, and Sex
[machine-read-
able data files available online at www.
cdc.gov/nchs/nvss/bridged_race.htm,
as of July 9, 2020, following release
by the U.S. Census Bureau of the un-
bridged vintage 2019 postcensal esti-
mates by 5-year age group, retrieved
on July 29, 2020].
Technical note
Arrest rates for jurisdictions with less
than complete reporting may not be
representative of the entire state. Al-
though juvenile arrest rates may
largely reflect juvenile behavior, many
other factors can affect the magni-
tude of these rates. Arrest rates are
calculated by dividing the number of
youth arrests made in the year by the
number of youth living in the jurisdic-
tion. Therefore, jurisdictions that ar-
rest a relatively large number of non-
resident juveniles would have a
higher arrest rate than jurisdictions
where resident youth behave similar-
ly. Jurisdictions (especially small
ones) that are vacation destinations
or that are centers for economic ac-
tivity in a region may have arrest rates
that reflect the behavior of nonresident
youth more than that of resident
youth. Other factors that influence ar-
rest rates in a given area include the
attitudes of citizens toward crime, the
policies of local law enforcement
agencies, and the policies of other
components of the justice system. In
many areas, not all law enforcement
agencies report their arrest data to the
FBI. Rates for such areas are neces-
sarily based on partial information and
may not be accurate. Comparisons of
juvenile arrest rates across jurisdic-
tions can be informative. Because of
factors noted, however, comparisons
should be made with caution.

Youth and the Juvenile Justice System: 2022 National Report
136
County, Single-Year of Age (0, 1, 2,
. . . , 85 Years and Over), Bridged
Race, Hispanic Origin, and Sex
[data
files]. Prepared under a collaborative
arrangement with the U.S. Census Bu-
reau. Available online at www.cdc.gov/
nchs/nvss/bridged_race.htm [released
October 26, 2012, following release by
the U.S. Census Bureau of the revised
unbridged intercensal estimates by
5-year age group on October 9, 2012].
National Center for Health Statistics.
2020.
Postcensal Estimates of the Resi-
dent Population of the United States
(April 1, 2010, July 1, 2010–July 1,
2019) by Year, County, Single-year of
Age (0, 1, 2, . . . , 85 Years and Over),
Bridged Race, Hispanic Origin, and
Sex (Vintage 2019)
[data files]. Pre-
pared under a collaborative arrange-
ment with the U.S. Census Bureau.
Available online: cdc.gov/nchs/nvss/
bridged_race.htm [released July 9,
2020, following release by the U.S.
Census Bureau of the unbridged vin-
tage 2019 postcensal estimates by
5-year age groups].
U.S. Census Bureau.
U.S. Pop u la tion
Es ti mates by Age, Sex, Race, and His-
pan ic Origin: 1980 to 1999
[data
files]. Available online [re leased April
11, 2000].

Youth and the Juvenile Justice System: 2022 National Report
137
Chapter 6
Youth in
juvenile court
6
Law enforcement agencies refer
approximately two-thirds of all arrest-
ed youth to a court with juvenile
jurisdiction for further processing.
As with law enforcement, the court
may decide to divert some youth away
from the formal justice system to
other agencies for service. Prosecutors
may file some juvenile cases directly to
criminal (adult) court. Those cases
that progress through the juvenile
court system may result in adjudica-
tion and court-ordered probation or
out-of-home placement or may be
transferred from juvenile court to
criminal court. While their cases are
being processed, youth may be held
in secure detention.
This chapter quantifies the flow of
cases through the juvenile court
system. It documents the nature of,
and trends in, cases received and the
court’s response, and examines gender
and race differences. (Chapter 4, on
juvenile justice system structure and
process, describes the juvenile court
process in general, the history of juve-
nile courts in the U.S., and state varia-
tions in current laws. Chapter 2, on
victims, discusses the handling of child
maltreatment matters.) The chapter
also discusses racial disproportionality
in the juvenile justice system and pres-
ents an analysis of juvenile court refer-
ral histories from a sample birth co-
hort of youth born in 2000.
The information presented in this
chapter is drawn from the National
Juvenile Court Data Archive, which
is funded by NIJ with support from
OJJDP, and the Archive’s primary
publication,
Juvenile Court Statistics
.

Youth and the Juvenile Justice System: 2022 National Report
138
The
Juvenile Court Statistics
report series details the
activities of U.S. juvenile courts
Juvenile Court Statistics
reports
have provided data on court
activity since the late 1920s
The
Juvenile Court Statistics
series is
the primary source of information on
the activities of the nation’s juvenile
courts. The first
Juvenile Court Statis-
tics
report, published in 1929 by the
Children’s Bureau of the U.S. Depart-
ment of Labor, described cases handled
in 1927 by 42 courts. In 1974, the
Office of Juvenile Justice and Delin-
quency Prevention (OJJDP) took on
the project. Since 1975, the National
Center for Juvenile Justice (NCJJ) has
been responsible for this OJJDP data
collection effort through the National
Juvenile Court Data Archive project.
The project not only produces the
Ju-
venile Court Statistics
reports but also
conducts research and archives data for
use by other researchers.
Throughout its history, the
Juvenile
Court Statistics
series has depended on
the voluntary support of courts with
juvenile jurisdiction. Courts contribute
data originally compiled to meet their
own information needs. The data
NCJJ receives are not uniform but re-
flect the natural variation that exists
across court information systems. To
develop national estimates, NCJJ re-
structures compatible data into a com-
mon format. In 2019, juvenile courts
with jurisdiction over virtually 100% of
the U.S. juvenile population contribut-
ed at least some data to the national
reporting program. Because not all
contributed data can support the na-
tional reporting requirements, the na-
tional estimates for 2019 were based
on data from more than 2,500 jurisdic-
tions containing nearly 87% of the na-
tion’s juvenile population (i.e., youth
age 10 through the upper age of origi-
nal juvenile court jurisdiction in each
state).
Juvenile Court Statistics
documents the number of cases
courts handled
Just as the FBI’s Uniform Crime Re-
porting Program counts arrests made
by law enforcement (i.e., a workload
measure, not a crime measure), the
Juvenile Court Statistics
series counts
delinquency and status offense cases
handled by courts with juvenile juris-
diction during the year. Each case rep-
resents the initial disposition of a new
referral to juvenile court for one or
more offenses. A youth may be in-
volved in more than one case in a year.
Therefore, the
Juvenile Court Statistics
series does not provide a count of indi-
vidual youth brought before juvenile
courts.
Cases involving multiple charges
are categorized by their most
serious offense
In a single case where a youth is
charged with robbery, simple assault,
and a weapons law violation, the case is
counted as a robbery case (similar to
the FBI Uniform Crime Reporting
Program’s hierarchy rule). Thus, the
Juvenile Court Statistics
series does not
provide a count of the number of
crimes committed by youth. In addi-
tion, given that only the most serious
offense is used to classify the case,
counts of—and trends for—less serious
offenses must be interpreted cautiously.
Similarly, cases are categorized by their
most severe or restrictive disposition.
For example, a case in which the judge
orders the youth to a training school
and to pay restitution to the victim
would be characterized as a case in
which the youth was placed in a resi-
dential facility.
Juvenile Court Statistics
describes
delinquency and status offense
caseloads
The
Juvenile Court Statistics
series de-
scribes delinquency and status offense
cases handled by juvenile courts. The
reports provide demographic profiles
of the youth referred and the reasons
for the referrals (offenses). The series
documents the juvenile courts’ differ-
ential use of petition, detention, adju-
dication, and disposition alternatives by
case type. The series also can identify
trends in the volume and characteristics
of court activity. However, care should
be exercised when interpreting gender,
age, or racial differences in the analysis
of juvenile delinquency or status of-
fense cases because reported statistics
do not control for the seriousness of
the behavior leading to each charge or
the extent of a youth’s court history.
The
Juvenile Court Statistics
series
does not provide national estimates of
the number of youth referred to court,
their prior court histories, or their fu-
ture recidivism. Nor does it provide
data on criminal court processing of
juvenile cases. Criminal court cases in-
volving youth younger than age 18
who are defined as adults in their state
are not included. The series was de-
signed to produce national estimates of
juvenile court activity, not to describe
the law-violating activities of youth.

Chapter 6: Youth in juvenile court
139
Juvenile courts handled 722,600 delinquency cases in
2019—down from 1.2 million in 1985
Juvenile court caseloads have
decreased and changed
In 2019, U.S. courts with juvenile ju-
risdiction handled an estimated
722,600 cases in which the youth was
charged with a delinquency offense—
an offense for which an adult could be
prosecuted in criminal court. Thus,
U.S. juvenile courts handled 1,980 de-
linquency cases per day in 2019. In
comparison, approximately 1,100 de-
linquency cases were processed daily in
1960. After a substantial increase
(60%) between 1985 and the peak in
1997, the volume of delinquency cases
handled by juvenile courts decreased
61% through 2019. This is in line with
the decrease in the number of juvenile
arrests made between 1997 and 2019.
Most delinquency cases are
referred by law enforcement
Delinquency and status offense cases
are referred to juvenile courts by a
number of different sources, including
law enforcement agencies, social servic-
es agencies, victims, probation officers,
schools, or parents.
Percent of cases referred by law
enforcement agencies:
Offense 2019
Delinquency 82%
Person 87
Property 91
Drugs 90
Public order 62
Status offense (formal cases) 18
Runaway 33
Truancy 1
Curfew 93
Ungovernability 31
Liquor 86
In 2019, 82% of delinquency cases
were referred by law enforcement
agencies. This proportion has changed
little over the past two decades. Law
enforcement agencies are generally
much less likely to be the source of re-
ferral for formally handled status of-
fense cases (involving offenses that are
not crimes for adults) than delinquency
Youth were charged with a person offense in one-third of the
delinquency cases handled by juvenile courts in 2019
Number
of cases
Percent change
Most serious offense
Percent of
total cases
1985–
2019
2010–
2019
Total delinquency 722,600 100% –38% –45%
Person offense 237,000 33 29 –29
Violent Crime Index 53,600 7 –13 –22
Criminal homicide 1,100 0 –4 34
Forcible rape 8,300 1 59 –3
Robbery 18,600 3 –26 –26
Aggravated assault 25,700 4 –14 –25
Simple assault 153,100 21 45 –30
Other violent sex offense 7,500 1 12 –26
Other person offense 22,700 3 118 –38
Property offense 214,500 30 –70 –56
Property Crime Index 145,600 20 –72 –58
Burglary 38,600 5 –73 –55
Larceny-theft 89,600 12 –73 –63
Motor vehicle theft 15,300 2 –57 –2
Arson 2,100 0 –69 –54
Vandalism 35,900 5 –58 –54
Trespassing 19,500 3 –63 –54
Stolen property offense 7,000 1 –77 –51
Other property offense 6,600 1 –64 –35
Drug law violation 96,400 13 25 –40
Public order offense 174,700 24 –11 –48
Obstruction of justice 81,000 11 20 –49
Disorderly conduct 48,300 7 7 –51
Weapons offense 16,000 2 –20 –46
Liquor law violation 4,100 1 –77 –69
Nonviolent sex offense 11,500 2 –12 5
Other public order offense 13,900 2 –57 –44
Q Property crimes accounted for 30% of delinquency cases in 2019.
Q The number of juvenile court referrals decreased 38% between 1985 and 2019;
however, during the 10-year period between 2010 and 2019, juvenile court re-
ferrals decreased by nearly half (45%).
Note: Detail may not add to totals because of rounding. Calculations are based on unrounded
numbers.
Source: Authors’ adaptation of Hockenberry and Puzzanchera’s
Juvenile Court Statistics 2019
.
cases. The exceptions are curfew cases
and status liquor law violation cases
(underage drinking and possession of
alcohol).

Youth and the Juvenile Justice System: 2022 National Report
140
The juvenile court caseload increased steadily between 1985
and 1997 and then declined to its lowest level in 2019
Juvenile court cases have
decreased steadily since the
late 1990s
The number of delinquency cases in-
creased 60% between 1985 and the
1997 peak, before decreasing 61%
through 2019. Cases involving proper-
ty or drug offenses followed a similar
pattern; property offenses increased
29% through 1995 and drug offense
cases more than doubled (147%)
through 1997. Both offense types de-
creased steadily through 2019—down
76% and 49%, respectively. Public order
and person offense cases more than
doubled to their respective peaks in
2004 and 2005. Public order offense
cases decreased 59% through 2019 and
person offense cases decreased 45%.
In more recent years, juvenile court
cases involving violent crime offenses
decreased 22% in the 10-year period
between 2010 and 2019. More specifi-
cally, robbery was down 26%, aggravat-
ed assault 25%, and forcible rape 3%.
In contrast, criminal homicide cases in-
creased 34% during the period.
There were also large declines in cases
involving property offenses. Larceny-
theft cases decreased the most during
the 10-year period, down 63%, fol-
lowed by burglary (55%), arson, van-
dalism, and trespassing (down 54%
each), and stolen property offenses
(51%). Motor vehicle theft cases de-
creased 2% between 2010 and 2019.
Trends in juvenile court cases largely
parallel trends in arrests of persons
younger than 18. FBI data show that
arrest rates for persons younger than
18 charged with violent offenses and
Property Crime Index offenses have
dropped substantially since their peaks
in the mid-1990s.
The juvenile court caseload decreased 38% between 1985 and 2019
Q In the 10-year period between 2010 and 2019, caseloads decreased for the four
general offense categories. Property offense cases fell 56%, followed by public
order offense cases (48%), drug offense cases (40%), and person offense cases
(29%). The overall delinquency caseload decreased 45% during the same time
period.
Source: Authors’ adaptation of Hockenberry and Puzzanchera’s
Juvenile Court Statistics 2019
.
85 87 89 91 93 95 97 99 01 03 05 07 09 11 13 15 17 19
0
400,000
800,000
1,200,000
1,600,000
2,000,000
Year
Number of cases
Total delinquency
Delinquency cases by offense category
87 91 95 99 03 07 11 15 19
0
40,000
80,000
120,000
160,000
200,000
Year
Number of cases
Drugs
87 91 95 99 03 07 11 15 19
0
100,000
200,000
300,000
400,000
500,000
Year
Number of cases
Public order
87 91 95 99 03 07 11 15 19
0
100,000
200,000
300,000
400,000
500,000
Year
Number of cases
Person
87 91 95 99 03 07 11 15 19
0
200,000
400,000
600,000
800,000
1,000,000
Year
Number of cases
Property

Chapter 6: Youth in juvenile court
141
An offense classification may
encompass situations with a
wide range of seriousness
The four general offense catego-
ries—person, property, drugs, and
public order—are each very broad
in terms of the seriousness of the
offenses they comprise. Within
these general categories, individual
offenses (e.g., aggravated assault,
robbery) may also encompass
a wide range of seriousness. For
example:
Aggravated assault is the unlawful
intentional infliction of serious bodi-
ly injury or unlawful threat or at-
tempt to inflict bodily injury or death
by means of a deadly or dangerous
weapon with or without actual in-
fliction of injury. The following situa-
tions are examples of aggravated
assault:
Q A gang attempts to kill a rival
gang member in a drive-by
shooting, but he survives the
attack.
Q A son fights with his father,
causing injuries that require
treatment at a hospital.
Q A student raises a chair and
threatens to throw it at a teacher
but does not.
Robbery is the unlawful taking or
attempted taking of property in the
immediate possession of another
person by force or threat of force.
The following situations are exam-
ples of robbery:
Q Masked gunmen with automatic
weapons demand cash from a
bank.
Q A gang of young men beat up a
tourist and steal his wallet and
valuables.
Q A school bully says to another
student, “Give me your lunch
money, or I’ll punch you.”
Trend patterns for juvenile court caseloads from 1985 through 2019
varied substantially across offenses
Q Robbery cases peaked in 1996, fell through 2004, and increased again through
2008, before declining through 2019. As a result, the number of robbery cases in
2019 was 26% less than the number in 1985.
Q Aggravated assault cases peaked in 1995, at 62,700 and then fell off sharply. In
comparison, simple assault cases climbed steadily through 2005, then decreased
through 2019. Unlike other offenses, the number of simple assault cases in 2019
outnumbered the number reported in 1985.
Q Burglary and larceny-theft caseloads peaked in the 1990s and steadily decreased
through 2019 to their lowest levels since at least 1985.
Q After a steady decline following the peak in 1994, weapons offense cases increased
through the mid 2000s before decreasing again through 2019.
Source: Authors’ adaptation of Hockenberry and Puzzanchera’s
Juvenile Court Statistics
2019.
87 91 95 99 03 07 11 15 19
0
50,000
100,000
150,000
200,000
250,000
300,000
Year
Number of cases
Simple assault
87 91 95 99 03 07 11 15 19
0
10,000
20,000
30,000
40,000
50,000
60,000
Year
Number of cases
Weapons
87 91 95 99 03 07 11 15 19
0
20,000
40,000
60,000
80,000
Year
Number of cases
Aggravated assault
87 91 95 99 03 07 11 15 19
0
100,000
200,000
300,000
400,000
500,000
Year
Number of cases
Larceny−theft
87 91 95 99 03 07 11 15 19
0
10,000
20,000
30,000
40,000
Year
Number of cases
Robbery
87 91 95 99 03 07 11 15 19
0
40,000
80,000
120,000
160,000
200,000
Year
Number of cases
Burglary

Youth and the Juvenile Justice System: 2022 National Report
142
Cases increased for males and females through the mid-
1990s; since then, cases have declined for both
Females account for a relatively
small share of delinquency cases
In 2019, juvenile courts handled more
than 200,300 delinquency cases involv-
ing females—just over one-quarter of
all delinquency cases handled in 2019.
Females made up a fairly large share of
cases in some offense categories—
simple assault (37%), disorderly con-
duct (36%), larceny-theft (35%), and li-
quor law cases (33%). For other of-
fense categories, the female share of
the case-load was relatively small—vio-
lent sex offenses other than rape (6%),
robbery and weapons offenses (11%
each), burglary offenses (12%), and
criminal homicide (14%).
Most serious offense
Female
proportion
Total delinquency 28%
Person offense 31
Violent Crime Index 16
Criminal homicide 14
Forcible rape 4
Robbery 11
Aggravated assault 24
Simple assault 37
Other violent sex offense 6
Other person offense 30
Property offense 25
Property Crime Index 28
Burglary 12
Larceny-theft 35
Motor vehicle theft 22
Arson 15
Vandalism 19
Trespassing 23
Stolen property offense 14
Other property offense 26
Drug law violation 26
Public order offense 28
Obstruction of justice 27
Disorderly conduct 36
Weapons offense 11
Liquor law violation 33
Nonviolent sex offense 22
Other public order offense 23
For most offenses, female caseloads have grown more or decreased
less than male caseloads between 1985 and 2019
Percent change
1985–2019 2010–2019
Most serious offense Male Female Male Female
Total delinquency –44% –11% –45% –46%
Person offense 11 101 –30 –29
Violent Crime Index –17 21 –21 –25
Criminal homicide –6 5 31 55
Forcible rape 56 161 –3 –3
Robbery –30 25 –27 –18
Aggravated assault –20 17 –24 –29
Simple assault 23 110 –32 –27
Other violent sex offense 12 14 –24 –43
Other person offense 81 321 –36 –42
Property offense –72 –59 –53 –63
Property Crime Index –74 –62 –53 –67
Burglary –74 –57 –55 –47
Larceny-theft –76 –65 –56 –70
Motor vehicle theft –61 –35 –3 2
Arson –70 –55 –55 –44
Vandalism –62 –21 –55 –43
Trespassing –67 –47 –57 –45
Stolen property offense –78 –71 –51 –52
Other property offense –65 –63 –35 –37
Drug law violation 12 84 –45 –13
Public order offense –17 13 –48 –48
Obstruction of justice 17 28 –50 –48
Disorderly conduct –11 68 –52 –50
Weapons offense –23 15 –45 –50
Liquor law violation –80 –63 –69 –68
Nonviolent sex offense –17 10 4 9
Other public order offense –57 –58 –45 –41
Q Between 1985 and 2019, the overall delinquency caseload for females de-
creased 11%, compared with a 44% decrease for males.
Q Among females, the number of aggravated assault cases increased 17% be-
tween 1985 and 2019. In comparison, among males, aggravated assault cases
were down 20%.
Q Between 2010 and 2019, the number of aggravated assault cases dropped for
both males and females, but the decline for females (29%) was slightly greater
than the decline for males (24%).
Note: Detail may not add to totals because of rounding. Calculations are based on unrounded
numbers.
Source: Authors’ adaptation of Hockenberry and Puzzanchera’s
Juvenile Court Statistics 2019
.

Chapter 6: Youth in juvenile court
143
The female share of delinquency
cases increased steadily through
2002 and then leveled off
The proportion of delinquency cases
that involved females was 19% in 1985;
by 2005, it had increased 9 percentage
points to 28% and remained close to
this level through 2019. The female
share of person offense cases rose 11
percentage points between 1985 and
2019 to 31%. The female proportion
of property cases went from 19% in
1985 to 30% in 2009, then decreased
to 25% in 2019. The female propor-
tion of drug offense cases increased 8
percentage points from 1985 to 2019,
up to 26%. The female proportion of
public order cases increased 6 percent-
age points from 1985 to 2019, up to
28%.
Juvenile court caseload trends were different for males and females,
and the differences varied by offense category
Q Male delinquency caseloads have been on the decline since the mid-1990s. The fe-
male caseload peaked in 2005 and decreased through 2019.
Q The decline in male caseloads has been driven by a sharp reduction in the volume
of property cases—down 77% from the 1995 peak to 2019.
Q For females, the largest 1985–2019 increase was in person offense cases (101%).
Drug law violation cases also rose substantially (84%).
Source: Authors’ adaptation of Hockenberry and Puzzanchera’s
Juvenile Court Statistics 2019
.
87 91 95 99 03 07 11 15 19
0
200,000
400,000
600,000
800,000
1,000,000
1,200,000
1,400,000
1,600,000
Year
Number of cases
Male
Female
Delinquency
87 91 95 99 03 07 11 15 19
0
100,000
200,000
300,000
400,000
500,000
600,000
700,000
800,000
Year
Number of cases
Property
Drugs
Male
Person
Public order
87 91 95 99 03 07 11 15 19
0
50,000
100,000
150,000
200,000
250,000
Year
Number of cases
Property
Drugs
Female
Person
Public order
87 91 95 99 03 07 11 15 19
0%
5%
10%
15%
20%
25%
30%
35%
Year
Female percent of cases
Property
Person
Drugs
Public
order
87 91 95 99 03 07 11 15 19
0%
5%
10%
15%
20%
25%
30%
Year
Female percent of cases
Delinquency

Youth and the Juvenile Justice System: 2022 National Report
144
In 2019, male and female offense profiles were similar
The delinquency caseload
changed for both males and
females between 2010 and 2019
Compared with offense profiles in
2010, both male and female delin-
quency caseloads had greater propor-
tions of person offense cases in 2019.
Offense profile by gender:
Offense Male Female
2019
Delinquency 100% 100%
Person 31 36
Property 31 27
Drugs 14 12
Public order 24 24
2010
Delinquency 100% 100%
Person 24 28
Property 36 39
Drugs 14 8
Public order 26 25
Note: Detail may not total 100% because of
rounding.
Person and property cases accounted
for equal proportions of the male case-
load in 2019 (31% each). In 2019,
person offenses accounted for the larg-
est share of the female caseload; in
2010 property offenses accounted for
largest share.
In 2019, the male caseload contained
greater proportions of property and
drug offenses than the female caseload.
In contrast, person offenses accounted
for a larger share of the female caseload
than the male caseload. The propor-
tion of delinquency cases involving
public order offenses was the same for
both males and females in 2019.
Although males accounted for more than twice as many delinquency
cases as females in 2019, their offense profiles were similar
Male Female
Most serious offense
Number
of cases
Percent
of cases
Number
of cases
Percent
of cases
Total delinquency 522,293 100% 200,332 100%
Person offense 163,973 31 73,043 36
Violent Crime Index 44,915 9 8,712 4
Criminal homicide 978 0 157 0
Forcible rape 7,932 2 336 0
Robbery 16,432 3 2,132 1
Aggravated assault 19,573 4 6,086 3
Simple assault 95,999 18 57,129 29
Other violent sex offense 7,127 1 415 0
Other person offense 15,933 3 6,788 3
Property offense 160,494 31 53,992 27
Property Crime Index 105,479 20 40,075 20
Burglary 33,995 7 4,649 2
Larceny-theft 57,867 11 31,734 16
Motor vehicle theft 11,880 2 3,374 2
Arson 1,737 0 317 0
Vandalism 29,114 6 6,754 3
Trespassing 15,044 3 4,463 2
Stolen property offense 5,996 1 990 0
Other property offense 4,861 1 1,710 1
Drug law violation 71,657 14 24,755 12
Public order offense 126,169 24 48,542 24
Obstruction of justice 59,006 11 22,012 11
Disorderly conduct 30,670 6 17,585 9
Weapons offense 14,164 3 1,841 1
Liquor law violation 2,736 1 1,346 1
Nonviolent sex offense 8,953 2 2,523 1
Other public order offense 10,640 2 3,235 2
Q Compared with males, the female juvenile court caseload had a greater propor-
tion of simple assault, larceny-theft, and disorderly conduct cases and a small-
er proportion of robbery, burglary, vandalism, and drug cases.
Note: Detail may not add to totals because of rounding. Calculations are based on unrounded
numbers.
Source: Authors’ adaptation of Hockenberry and Puzzanchera’s
Juvenile Court Statistics 2019
.
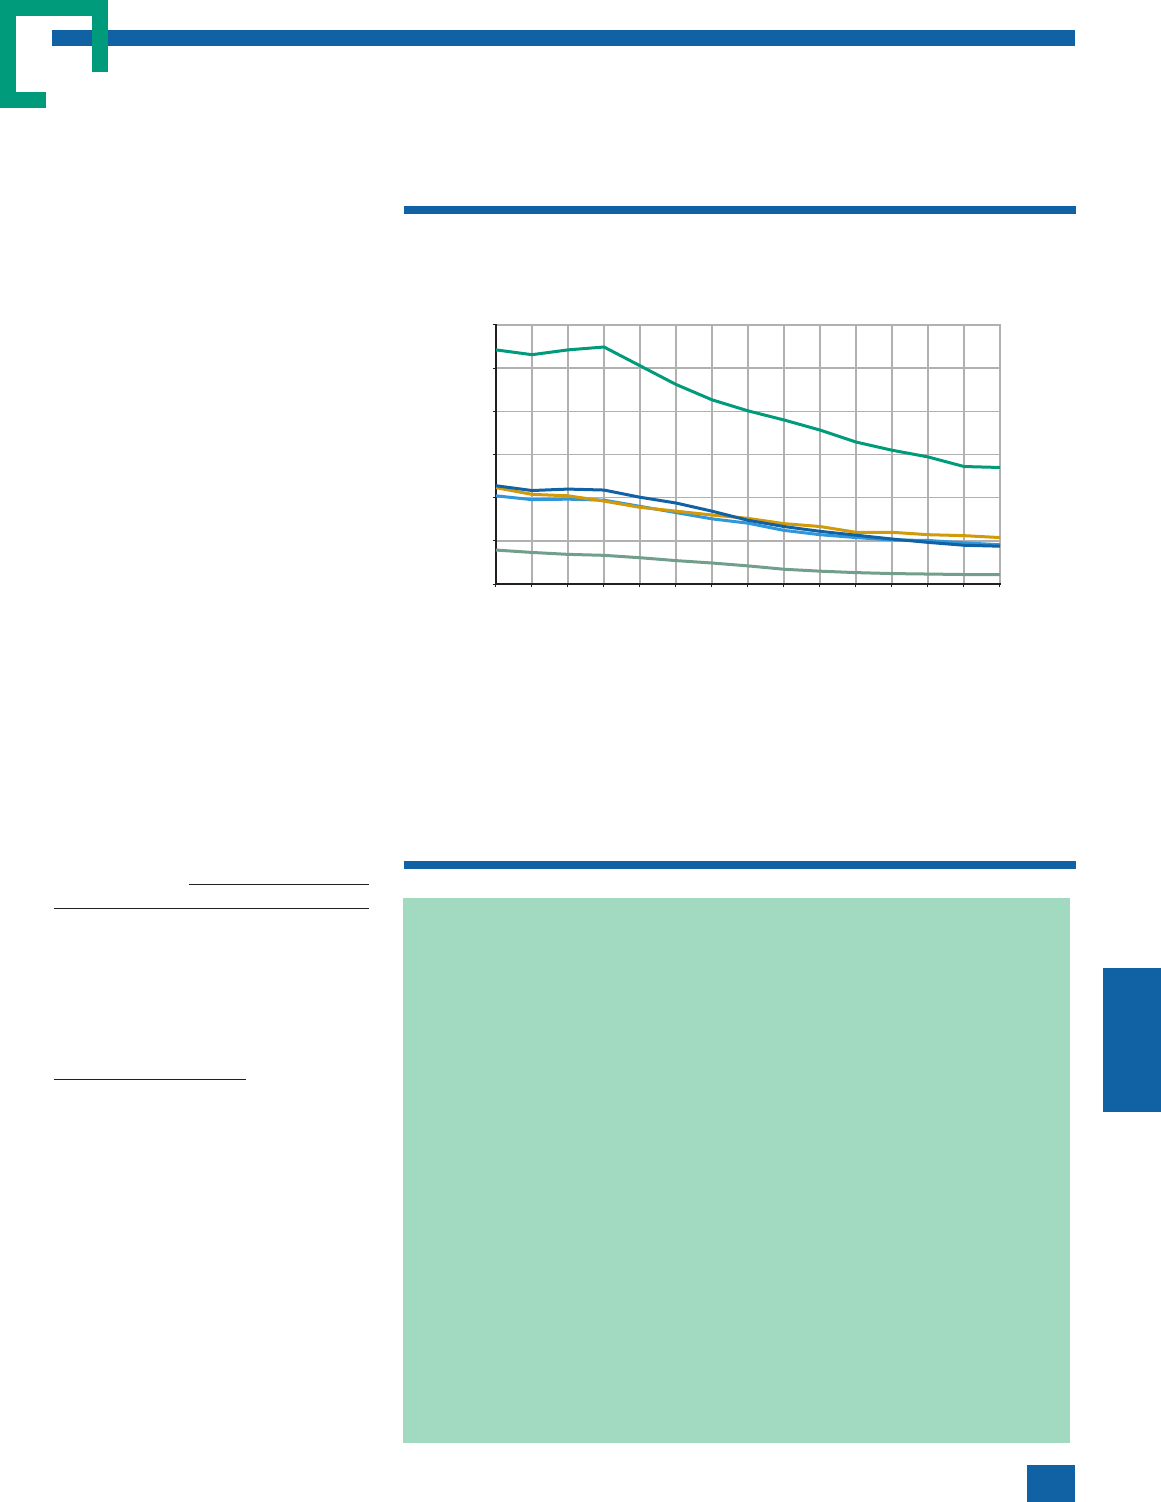
Chapter 6: Youth in juvenile court
145
A disproportionate number of delinquency cases involved
Black youth
In 2019, Black youth constituted
15% of the juvenile population but
35% of the delinquency caseload
Although the largest proportion of de-
linquency cases handled in 2019 in-
volved White youth (310,100 or 43%),
a disproportionate number of cases in-
volved Black youth (254,800 or 35%),
given their proportion of the juvenile
population. In 2019, White youth
made up 53% of the juvenile popula-
tion (youth ages 10 through the upper
age of juvenile court jurisdiction in
each state), Black youth 15%, Hispan-
ic
1
youth 24%, American Indian
2
youth
2%, and Asian
3
youth 6%.*
The racial profile of delinquency cases
overall had a slightly greater propor-
tion of cases involving Black youth in
2019 (35%) than in 2010 (33%) and,
conversely, a slightly smaller propor-
tion of cases involving White youth.
The proportion of cases involving His-
panic youth was the same in both years
(19%).
Racial profile:
Race/ethnicity
Delinquency
2019 2010
White 43% 45%
Black 35 33
Hispanic 19 19
American Indian 2 1
Asian 1 1
Note: Detail may not total 100% because of
rounding.
1
Persons of Hispanic ethnicity are treated as a
distinct race group and are excluded from the
other four race groups, with one important
exception. Data provided to the Archive from
many jurisdictions do not include any means
to determine the ethnicity of American Indian
youth. Rather than assume ethnicity for these
youth, they are classified solely on their racial
classification. As such, the American Indian
group includes an unknown proportion of
Hispanic youth.
2
The racial classification American Indian
(usually abbreviated as Amer. Indian) includes
American Indian and Alaskan Native.
3
The racial classification Asian includes Asian,
Native Hawaiian, and Other Pacific Islander.
The National Juvenile Court Data Archive began including data on
Hispanic youth with the 2005 data year
Beginning with the 2005 data year,
detailed race estimates developed by
the National Juvenile Court Data Ar-
chive (Archive) project were expand-
ed to include estimates for cases in-
volving Hispanic youth. As a result of
this change, race data are not com-
parable across all data years present-
ed in this chapter (1985–2019). For
the 1985–2004 data period, the Ar-
chive project developed race esti-
mates for four race groups (White,
Black, American Indian/Alaskan Na-
tive, and Asian/Pacific Islander) with-
out consideration of ethnicity, and
persons of Hispanic ethnicity could
be of any race and were included
within each of the four racial groups.
Beginning with the 2005 data year,
persons of Hispanic ethnicity are
treated as a distinct race group and
are excluded from the other race
groups. For this reason, race esti-
mates for the 1985–2004 data period
are not comparable to the race esti-
mates for the 2005–2019 data period.
Therefore, in this chapter, racial data
are presented only for the 2005–2019
period. An important exception to ra-
cial classification must be noted. Data
provided to the project did not always
allow for identification of Hispanic eth-
nicity for cases involving American In-
dian youth. Specifically, data from
many jurisdictions did not include any
means to determine the ethnicity of
American Indian youth. Rather than
assume ethnicity for these youth, they
are classified solely on their racial
classification; as such, the American
Indian group includes an unknown
proportion of Hispanic youth.
Between 2005 and 2019, delinquency case rates declined for youth of
all racial groups
Q The delinquency case rate was at its highest level in 2005 for all racial groups ex-
cept for Black youth. The delinquency case rate for Black youth peaked in 2008
(109.7) and then fell 51% by 2019. Between 2005 and 2019, the delinquency case
rate decreased the most for Asian youth (71%), followed by Hispanic youth (61%),
White youth (55%), American Indian youth (52%), and Black youth (50%).
Q In 2019, the total delinquency case rate for Black youth (53.9) was more than dou-
ble the rate for American Indian youth (21.5), 3 times the rate for White youth (18.3)
and Hispanic youth (17.6), and nearly 12 times the rate for Asian youth (4.6).
Source: Authors’ adaptation of Hockenberry and Puzzanchera’s
Juvenile Court Statistics 2019
.
05 07 09 11 13 15 17 19
0
20
40
60
80
100
120
Year
Cases per 1,000 youth ages 10−17
Black
White
Asian
Hispanic
Amer. Indian
Delinquency

Youth and the Juvenile Justice System: 2022 National Report
146
Racial profile, 2019:
Race/
ethnicity Person Property Drugs
Public
order
Total 100% 100% 100% 100%
White 41 42 53 41
Black 40 32 20 36
Hispanic 16 18 21 22
American
Indian
1221
Asian 1 2 1 1
Note: Detail may not total 100% because of
rounding.
Offense profiles for White youth
and Black youth differed
Delinquency caseloads for Black youth
contained a greater proportion of per-
son offenses than did caseloads for all
other races. For White, Black, and His-
panic youth, person offenses accounted
for the largest proportion of cases, and
drug offenses accounted for the small-
est proportion of cases for all racial
groups. Person offenses made up a
larger share of delinquency cases in
2019 than in 2010 for all racial groups.
Offense profile:
Race/
ethnicity Person Property Drugs
Public
order
2019
White 32% 29% 17% 23%
Black 35 32 7 25
Hispanic 31 26 17 25
American
Indian
31 33 17 19
Asian 30 32 15 23
2010
White 24% 39% 15% 23%
Black 30 35 7 27
Hispanic 21 36 14 30
American
Indian
23 39 13 25
Asian 20 46 11 24
Note: Rows total 100%; however, detail may
not total 100% because of rounding.
In 2019, the disparity between
rates for Black youth and White
youth was lowest for drug cases
In 2019, case rates for Black youth
were substantially higher than rates for
other youth in all offense categories,
but the degree of disparity varied. The
person offense case rate for Black
youth (19.1 per 1,000) was more than
3 times the rate for White youth (5.8),
as was the property offense case rate
(17.4 for Black youth and 5.3 for
White youth), and the public order
case rate (13.6 for Black youth and 4.2
for White youth).
In comparison, in 2019, the drug of-
fense case rate for Black youth (3.9)
was 1.3 times the rate for White youth
(3.0). The disparity in the drug offense
case rate between Black and White
youth decreased since 2006, when the
case rate for Black youth was nearly
double the case rate for White youth.
The racial profile for delinquency
cases was similar for males and
females in 2019
Among females referred to juvenile
court in 2019 for person offenses,
Black youth accounted for 41% of
cases—the greatest overrepresentation
among Black youth. The Black propor-
tion among males referred for person
offenses was slightly smaller at 37%.
Racial profile of delinquency cases by
gender and offense, 2019:
Race/ethnicity
Delinquency
Male Female
Total 100% 100%
White 43 44
Black 35 35
Hispanic 19 17
American Indian 2 2
Asian 1 1
Race/
ethnicity Person Property Drugs
Public
order
Male 100% 100% 100% 100%
White 42 41 51 41
Black 37 39 21 36
Hispanic 18 17 25 21
American
Indian
2221
Asian 1 1 1 1
Female 100% 100% 100% 100%
White 39 44 61 41
Black 41 35 13 39
Hispanic 17 16 22 17
American
Indian
2232
Asian 1 2 2 1
Note: Detail may not total 100% because of
rounding.
Among females referred for drug of-
fenses, Black youth were underrepre-
sented. Although they account for 15%
of the population of juvenile females,
Black youth made up 13% of drug
cases involving females in 2019.
In 2019, American Indian and Asian
youth combined made up 8% of the ju-
venile population; however, they ac-
counted for less than 6% of cases across
all gender and offense groups.
Offense profiles for both males
and females varied somewhat
across racial groups
Among males in 2019, Black youth
had a greater proportion of person of-
fense cases than all other race groups.
Conversely, Black males had a smaller
proportion of drug cases than all other
race groups.
Offense profile of delinquency cases by
gender and race, 2019:
Race/
ethnicity Person Property Drugs
Public
order
Male
White 31% 29% 16% 23%
Black 33 34 8 25
Hispanic 29 27 18 26
American
Indian
30 34 16 20
Asian 31 31 15 23
Female
White 32% 27% 17% 23%
Black 42 27 5 27
Hispanic 36 25 15 23
American
Indian
33 31 18 18
Asian 28 34 15 22
Note: Rows total 100%; however, detail may
not total 100% because of rounding.
Among females, person offenses ac-
counted for 42% of the cases involving
Black youth, compared with 36% of
the cases involving Hispanics, 33% in-
volving American Indian youth, 32%
involving White youth, and 28% in-
volving Asian youth. As with males,
Black females had a smaller proportion
of drug cases than all other race
groups.

Chapter 6: Youth in juvenile court
147
Case rates varied across race and offense but, in all offense categories and nearly all years from 2005
through 2019, the rates for Black youth were substantially higher than the rates for other youth
Q Compared with 2005, 2019 person offense case rates were lower for all racial groups. In fact, person offense case rates were at
their highest level for all race groups in 2005 and decreased substantially through 2019—down 59% for Asian youth, 45% for
Hispanic youth, 44% for Black youth, 41% for White youth, and 35% for American Indian youth.
Q Property case rates were at their highest levels in 2005 for White, American Indian, and Asian youth, and in 2008 for Black and
Hispanic youth. From their respective peaks, property offense case rates decreased the most for Asian youth (down 80%), fol-
lowed by Hispanic youth (71%), White youth (68%), American Indian youth (61%), and Black youth (54%).
Q The drug offense case rate for Black youth increased slightly (3%) between 2005 and the peak in 2007, then decreased 57%
through 2019. Drug offense case rates for all other racial groups were at their highest in 2005 and decreased to their lowest levels
in 2019 for White, American Indian, and Hispanic youth. The drug offense case rate for Asian youth was slightly higher in 2019
than in 2018.
Q In 2019, the decrease in the public order offense case rate was similar for all racial groups: 69% for Hispanic youth, 62% for
American Indian youth, 55% each for White and Black youth, and 51% for Asian youth.
Source: Authors’ adaptation of Hockenberry and Puzzanchera’s
Juvenile Court Statistics 2019
.
05 07 09 11 13 15 17 19
0
5
10
15
20
25
30
35
Year
Cases per 1,000 youth ages 10−upper age
Black
Asian
Person
White
Hispanic
Amer. Indian
05 07 09 11 13 15 17 19
0
5
10
15
20
25
30
35
40
Year
Cases per 1,000 youth ages 10−upper age
Black
Asian
Property
White
Hispanic
Amer. Indian
05 07 09 11 13 15 17 19
0
2
4
6
8
10
Year
Cases per 1,000 youth ages 10−upper age
Black
Asian
Drugs
White
Hispanic
Amer. Indian
05 07 09 11 13 15 17 19
0
5
10
15
20
25
30
35
Year
Cases per 1,000 youth ages 10−upper age
Black
Asian
Public order
White
Hispanic
Amer. Indian

Youth and the Juvenile Justice System: 2022 National Report
148
Although older teens dominated delinquency caseloads,
trends were similar for all age groups
For all ages, 2019 delinquency
case rates were lower than rates
in the mid- to late 1990s
In 2019, juvenile courts handled 22.7
delinquency cases for every 1,000 juve-
niles (youth subject to original juvenile
court jurisdiction) in the U.S. popula-
tion. The overall delinquency case rate
peaked in 1996, 43% above the 1985
rate, and then declined 64% to the
2019 level. For all ages, delinquency
case rates showed similar trend pat-
terns, although the peak years varied
slightly between age groups. Case rates
for youth between ages 11 and 14
peaked in 1995, while case rates for
older youth peaked in 1996 or 1997.
The case rate for youth age 10 peaked
in 1991. Between 1985 and 2019, case
rate declines were greater for youth
younger than 15 than for older teens;
however, in the 10-year period be-
tween 2010 and 2019, case rate de-
clines were greater for youth ages 16
and 17 than for all other ages.
Most delinquency cases involved
older teens
High-school-age youth (ages 14 and
older) made up 82% of the delinquen-
cy caseload in 2019; older teens (ages
16 and older) accounted for 45%. In
comparison, middle-school-age youth
(ages 12 and 13) were involved in 15%
of delinquency cases, while youth
younger than 12 accounted for 4%.
The 2019 age profile of delinquency
cases was similar to the 2010 profile.
Age profile of delinquency cases:
Age 2019 2010
Total 100% 100%
Under 12 4 3
12 5 4
13 10 9
14 15 15
15 21 21
16
24 26
17
19 19
Over 17 3 3
Note: Detail may not total 100% because of
rounding.
Age profiles varied somewhat across
offenses but have not changed substan-
tially since 2010
Age profile of delinquency cases, 2019:
Age Person Property Drugs
Public
order
Total 100% 100% 100% 100%
Under 12 5 3 1 3
12 7 5 2 5
13 12 9 6 9
14 17 16 12 15
15
20 22 20 21
16
22 25 29 24
17 16 19 28 18
Over 17 2 2 3 5
Note: Detail may not total 100% because of
rounding.
Why do juvenile courts handle
more 16- than 17-year-olds?
Although comparable numbers of
17-year-olds and 16-year-olds were ar-
rested in 2019, the number of juvenile
court cases involving 17-year-olds
(135,800), was lower than the number
involving 16-year-olds (173,000). The
explanation lies primarily in the fact
that 8 states exclude 17-year-olds from
the original jurisdiction of the juvenile
court (see Chapter 4). In these states,
all 17-year-olds are legally adults and
are referred to criminal court rather
than to juvenile court. Thus, far fewer
17-year-olds than 16-year-olds are sub-
ject to original juvenile court jurisdic-
tion. Of the more than 31 million
youth under juvenile court jurisdiction
in 2019, youth ages 10 through 15 ac-
counted for 78%, 13% were age 16,
and 9% were age 17.
In 2019, offense profiles of
younger and older youth differed
Compared with the delinquency case-
load involving older youth, the casel-
oad of youth age 15 or younger in
2019 included a larger proportion of
person offense cases and a smaller pro-
portion of drug offense cases.
Compared with 2010, the caseloads for
The delinquency case rate increased with the referral age of the youth
in 2019
Q In 2019, the delinquency case rate for 16-year-olds was 1.6 times the rate for
14-year-olds, and the rate for 14-year-olds was 3 times the rate for 12-year olds.
Q Age-specific case rates increased steadily through age 17 for all offense types. The
case rate for 17-year-olds was nearly double the case rate for 13-year-olds for per-
son offenses and nearly triple the rate for property and public order offenses.
Q The increase in rates between age 13 and age 17 was sharpest for drug offenses;
the rate for drug offenses for 17-year-olds was 6.7 times the rate for 13-year-olds.
Source: Authors’ adaptation of Hockenberry and Puzzanchera’s
Juvenile Court Statistics
2019.
10 11 12 13 14 15 16 17
0
10
20
30
40
50
Age at referral
1.5
3.5
8.8
16.7
26.7
35.8
43.0
47.1
Cases per 1,000 youth in age group, 2019
Delinquency
10 11 12 13 14 15 16 17
0
2
4
6
8
10
12
14
Age at referral
Cases per 1,000 youth in age group, 2019
Public
order
Drugs
Person
Property

Chapter 6: Youth in juvenile court
149
both age groups in 2019 involved
greater proportions of person offense
cases and smaller proportions of prop-
erty offense cases.
Offense profile of delinquency cases by
age:
Offense
Age 15
or younger
Age 16
or older
2019
Delinquency 100% 100%
Person 37 28
Property 30 30
Drugs 10 17
Public order 24 25
2010
Delinquency 100% 100%
Person 29 22
Property 38 36
Drugs 9 15
Public order 24 27
Note: Detail may not total 100% because of
rounding.
The age profile of delinquency
cases did not differ substantially
by gender or race in 2019
At each age, the proportion of cases
was not more than 2 percentage points
different for males compared to fe-
males. For both males and females, the
largest proportion of delinquency cases
involved 16-year-olds. Age profiles
across racial groups were also similar.
Age profile of delinquency cases by
gender, 2019:
Age Male Female
Total 100% 100%
Under 12 4 3
12 5 6
13 9 11
14 15 16
15 21 21
16
24 23
17
19 18
Over 17 3 2
Note: Detail may not total 100% because of
rounding.
Between 1985 and 2019, trends in case rates were generally similar
across age groups
Q With the exception of 10- to 12-year-olds, person offense case rates increased from
1985 through the mid-1990s and then declined through 2019.
Q Property offense case rates peaked in 1991 for all age groups, then declined 75%
or more through 2019 for each age group.
Q For all age groups, drug offense case rates were at their lowest levels in 1991. Be-
tween 1991 and their respective peaks in the mid to late 1990s, case rates more
than doubled for ages 13–15, 16, and 17 and nearly tripled for youth ages 10–12.
Rates then decreased for all ages through 2019.
Q Public order offense case rates nearly doubled for each age group between 1985
and the early 2000s. In the 10-year period between 2010 and 2019, the case rate
decreased 54% for youth age 16 and 55% for youth age 17.
Note: Because of the relatively low volume of cases involving youth ages 10–12 for drug offenses, their
case rates are inflated by a factor of 5 to display the trend over time.
Source: Authors’ adaptation of Hockenberry and Puzzanchera’s
Juvenile Court Statistics
2019.
87 91 95 99 03 07 11 15 19
0
5
10
15
20
25
Year
Cases per 1,000 youth in age group
Age 16
Ages 10−12 (x5)
Drugs
Age 17
Ages 13−15
87 91 95 99 03 07 11 15 19
0
5
10
15
20
25
30
Year
Cases per 1,000 youth in age group
Age 16
Ages 10−12
Public order
Ages 13−15
Age 17
87 91 95 99 03 07 11 15 19
0
5
10
15
20
25
30
Year
Cases per 1,000 youth in age group
Age 16
Ages 10−12
Person
Age 17
Ages 13–15
87 91 95 99 03 07 11 15 19
0
10
20
30
40
50
60
Year
Cases per 1,000 youth in age group
Age 16
Ages 10−12
Property
Ages 13−15
Age 17
Age profile of delinquency cases by race, 2019:
Age White Black Hispanic American Indian Asian
Total 100% 100% 100% 100% 100%
Under 12 4 4 2 4 2
12 5 5 4 6 5
13 10 10 9 12 10
14 15 16 15 16 15
15
20 21 21 20 20
16
24 24 25 21 23
17 19 18 19 19 21
Over 17 3 3 4 2 5
Note: Detail may not total 100% because of rounding.

Youth and the Juvenile Justice System: 2022 National Report
150
In 1 in 4 delinquency cases, the youth is detained between
referral to court and case disposition
When is secure detention used?
A youth may be placed in a secure ju-
venile detention facility at various
points during the processing of a case.
Although detention practices vary from
jurisdiction to jurisdiction, a general
model of detention practices is useful.
When a case is referred to juvenile
court, intake staff may decide to hold
the youth in a detention facility while
the case is being processed. In general,
detention is used if there is reason to
believe the youth is a threat to the
community, will be at risk if returned
to the community, or may fail to ap-
pear at an upcoming hearing. The
youth may also be detained for diag-
nostic evaluation purposes. In most de-
linquency cases, the youth is not de-
tained.
In all states, law requires that a deten-
tion hearing be held within a few days
(generally within 24 hours). At that
time, a judge reviews the decision to
detain the youth and either orders the
youth released or continues the deten-
tion. National juvenile court statistics
count the number of cases that involve
detention during a calendar year. As a
case is processed, the youth may be de-
tained and released more than once
between referral and disposition. Juve-
nile court data do not count individual
The number of cases involving detention was lower in 2019 than in 2005
for all offense types
Q The number of delinquency cases involving detention decreased 54% between
2005 and 2019, from 404,900 to 186,600. The largest relative decrease was for drug
offense cases (63%), followed by property and public order offense cases (57%
each) and person offense cases (46%).
Q Despite the decrease in the volume of delinquency cases involving detention, the
proportion of cases detained was about the same in 2019 (26%) as in 2005 (25%).
The percent of cases detained was lowest in 2009 (23%).
Q Between 2005 and 2019, the proportion of cases detained decreased for all but
property offense cases. The proportion of property cases involving detention in-
creased from 19% in 2005 to 23% in 2019.
Q Drug offense cases were the least likely to involve detention—youth were detained
in 16% of drug offense cases in 2019. In comparison, youth were detained in 23%
of property cases, 27% of public order cases, and 31% of person cases.
Q In 2013, youth were detained in 33% of person offense cases—the highest propor-
tion of cases detained for any offense during the 2005–2019 period. In fact, no
other offense category ever had more than 28% of cases detained.
Source: Authors’ adaptation of Hockenberry and Puzzanchera’s
Juvenile Court Statistics
2019.
05 07 09 11 13 15 17 19
0
40,000
80,000
120,000
160,000
Year
Cases detained
Public order
Person
Drugs
Property
05 07 09 11 13 15 17 19
0%
10%
20%
30%
40%
Year
Percent of cases detained
Public order
Person
Drugs
Property
Detention data prior to 2005
is not compatible with data
for 2005 and later
In 2018, the Archive project im-
proved the coverage of detention
data used to generate national esti-
mates. As a result of this change,
detention data prior to 2005 is no
longer compatible with data for
2005 and later. Therefore, data pre-
sentations within this chapter only
display detention data information
for the 2005–2019 data period.
Person offense cases represented 39%
of all detained delinquency cases in
2019, while property offense cases ac-
counted for 27% and public order of-
fense cases accounted for 26%. Drug
offense cases made up the smallest
share of detained cases (8%).
Offense profile of delinquency cases:
All
cases
Detained
cases
Offense 2010 2019 2010 2019
Delinquency 100% 100% 100% 100%
Person 19 24 34 39
Property 59 42 29 27
Drugs 5 11 9 8
Public order 17 23 27 26
Note: Detail may not total 100% because of
rounding.
detentions, nor do they count the
number of youth detained. In addition,
although in a few states youth may be
committed to a detention facility as
part of a disposition order, the court
data do not include such placements in
the count of cases involving detention.
The proportion of detained cases
involving person offenses has
increased
Compared with 2010, the offense
characteristics of the 2019 detention
caseload changed, involving a greater
proportion of person cases and slightly
smaller proportions of all other offense
groups.

Chapter 6: Youth in juvenile court
151
Use of detention varied not only by offense but also by
gender, race, and age
Males accounted for most delinquency cases involving detention and
were consistently more likely than females to be detained
Q The number of cases detained decreased at a similar pace for both males and fe-
males between 2005 and 2019; down 53% for males and 55% for females.
Q The likelihood of detention was higher for males than for females, but the 2005-
2019 trend lines for the percent of cases detained ran in tandem.
05 07 09 11 13 15 17 19
0
100,000
200,000
300,000
400,000
Year
Delinquency cases detained
Female
Male
05 07 09 11 13 15 17 19
0%
5%
10%
15%
20%
25%
30%
Year
Percent of delinquency cases detained
Female
Male
Q The number of delinquency cases involving detention was its highest level in 2005
for both White and Black youth and decreased through 2019; down 62% for White
youth and 50% for Black youth. For Hispanic youth, the number of detained delin-
quency cases peaked in 2007, then decreased 47% through 2019.
Q Although the likelihood of detention for Black and Hispanic youth increased slightly
between 2005 and 2019, the likelihood of detention was fairly stable for all racial
groups during the reporting period. The proportion of cases involving detention re-
mained lower for White youth than all other races for all years during the period.
Source: Authors’ adaptation of Hockenberry and Puzzanchera’s
Juvenile Court Statistics
2019.
05 07 09 11 13 15 17 19
0
40,000
80,000
120,000
160,000
200,000
Year
Delinquency cases detained
Hispanic
Black
White
05 07 09 11 13 15 17 19
0%
10%
20%
30%
40%
Year
Percent of delinquency cases detained
Hispanic
White
Black
Black youth accounted for the largest number of delinquency cases
involving detention, but Hispanic youth were most likely to be detained
In 2019, the gender disparity in
the likelihood of detention was
greatest for property cases
In 2019, the likelihood of detention in
delinquency cases for males was 1.4
times the likelihood for females (28%
vs. 20%). Males were more likely than
females to be detained in each of the
four general offense categories: 1.6
times more likely for property offenses,
1.5 for drug offenses, and 1.3 each for
person offenses and public order of-
fenses.
Percent of cases detained, 2019:
Offense Male Female
Delinquency 28% 20%
Person 33 26
Property 26 16
Drugs 17 12
Public order 29 22
Delinquency cases involving youth age
16 or older were more likely to be de-
tained than were cases involving youth
age 15 or younger. Person offense
cases for both age groups were more
likely to involve detention than were
other offenses.
Percent of cases detained, 2019:
Offense
Age 15
or younger
Age 16
or older
Delinquency 25% 27%
Person 29 34
Property 23 24
Drugs 15 17
Public order 24 31
The degree of racial disparity in
the likelihood of detention varied
across offenses
In 2019, the likelihood of detention
was greatest for Hispanic youth for
person and public order offenses. In
2019, Black and Hispanic youth were
equally as likely to be detained for a
property offense (27%), while Black
youth were more likely than any other
race group to be detained for a drug
offense (23%). For all years between
2005 and 2019, White youth were less
likely to be detained than Black or His-
panic youth. The overall percent of
cases detained for Black youth was 1.4
times that for White youth, and His-
panic youth were 1.7 times more likely
to be detained than White youth. The
greatest disparity between Black and
White youth was in the likelihood of
detention in drug cases—the propor-
tion for Black youth was 2 times that
for White youth.

Youth and the Juvenile Justice System: 2022 National Report
152
Percent of cases detained:
Race/ethnicity
Delinquency
2010 2019
White 20% 20%
Black 26 29
Hispanic 28 32
American Indian 26 25
Asian 21 26
Percent of cases detained, 2019:
Race/
ethnicity Person Property Drugs
Public
order
White 26% 18% 12% 22%
Black 33 27 23 29
Hispanic 37 27 20 36
American
Indian
29 23 16 30
Asian 31 20 14 34
The racial profile for detained
delinquency cases was similar for
males and females in 2019
In 2019, the Black proportion of de-
tained delinquency cases (40%) was
substantially greater than the Black
proportion of the juvenile population
(15%) and also greater than the Black
proportion of delinquency cases han-
dled during the year (35%). The over-
representation of Black youth in the
detention caseload was greatest among
property offenses (45%) and males
(41%). Across offenses, for males and
females, the Black proportion of de-
tained cases was in the 30%–40% range.
The one exception was among de-
tained females referred for drug offens-
es. Black youth accounted for just 16%
of cases involving females—close to
their representation in the population
(14%).
Racial profile of detained cases by
gender, 2019:
Race/ethnicity
Delinquency
Male Female
Total 100% 100%
White 33 36
Black 41 38
Hispanic 23 23
American Indian 2 2
Asian 1 1
Race/
ethnicity Person Property Drugs
Public
order
Male 100% 100% 100% 100%
White 35 32 37 31
Black 41 46 30 39
Hispanic 22 20 31 27
American
Indian
2222
Asian 1 1 1 1
Female 100% 100% 100% 100%
White 34 35 48 36
Black 41 40 16 37
Hispanic 22 21 30 23
American
Indian
2342
Asian 1 1 2 2
Note: Detail may not total 100% because of
rounding.
The offense profile of detained
cases varied by race and by
gender in 2019
For males, the person offense share of
delinquency cases involving detention
was similar for White and Black youth
(39% and 38%, respectively) and slight-
ly greater than Asian youth (36%) and
Hispanic and American Indian youth
(35% each). For Black male youth,
drug offense cases accounted for 6% of
detained cases, compared with 11% for
Hispanic males, 10% for White males,
9% for American Indian males, and 8%
for Asian males.
Among females, Black youth had a
higher proportion of person offenses in
the detention caseload (49%) than did
White and Hispanic youth (44% each),
American Indian youth (41%), or Asian
youth (37%). For American Indian fe-
males, drug offense cases accounted for
14% of detained cases, compared with
10% each for White and Hispanic fe-
males, 8% for Asian females, and 3% for
Black females.
Offense profile of detained cases by gen-
der, 2019:
Race/
ethnicity Person Property Drugs
Public
order
Total
White 40% 26% 10% 25%
Black 40 30 6 25
Hispanic 37 23 11 29
American
Indian
36 30 11 23
Asian 36 25 8 31
Male
White 39% 27% 10% 24%
Black 38 32 6 24
Hispanic 35 24 11 30
American
Indian
35 32 9 25
Asian 36 26 8 30
Female
White 44% 20% 10% 26%
Black 49 22 3 26
Hispanic 44 19 10 27
American
Indian
41 26 14 20
Asian 37 21 8 34
Note: Rows total 100%; however, detail may
not total 100% because of rounding.

Chapter 6: Youth in juvenile court
153
The petitioned caseload decreased 26% from 1985 to 2019
as formal case handling became less likely
In a formally processed case,
petitioners ask the court to order
sanctions
Formal case handling involves the fil-
ing of a petition requesting that the
court hold an adjudicatory or waiver
hearing. Decisionmakers (police, pro-
bation, intake, prosecutor, or other
screening officer) may consider infor-
mal case handling if they believe that
accountability and rehabilitation can be
achieved without formal court inter-
vention. Compared with informally
handled (nonpetitioned) cases, formal-
ly processed (petitioned) delinquency
cases tend to involve more serious of-
fenses, older youth, and youth with
longer court histories.
If the court decides to handle the mat-
ter informally, the youth agrees to
comply with one or more sanctions,
such as community service, victim res-
titution, or voluntary probation super-
vision. Informal cases are generally
held open pending successful comple-
tion of the disposition. If the court’s
conditions are met, the charges are dis-
missed. If, however, the youth does
not fulfill the conditions, the case is
likely to be petitioned for formal pro-
cessing.
The use of formal handling has
been stable for several years
The use of formal handling changed
little between 2010 and 2019, increas-
ing one percentage point from 2010
(53%) to 2019 (54%). Property, and
public order offense cases were more
likely to be handled formally in 2019
than in 2010. Drug offense cases were
less likely to be handled formally, and
person offense cases were equally as
likely in both years.
In 2010, property and drug offense
cases were less likely than person and
public order offense cases to be peti-
tioned for formal handling. In 2019,
drug offense cases were least likely.
The number of petitioned delinquency cases increased 91% between
1985 and the peak in 1997 and then declined 61% by 2019
Q Between 2005 and 2019, petitioned person offense cases decreased 44%, property
offense cases decreased 61%, drug offense cases decreased 60%, and public
order cases decreased 58%.
Source: Authors’ adaptation of Hockenberry and Puzzanchera’s
Juvenile Court Statistics 2019
.
85 87 89 91 93 95 97 99 01 03 05 07 09 11 13 15 17 19
0
200,000
400,000
600,000
800,000
1,000,000
1,200,000
Year
Delinquency cases
Petitioned
Nonpetitioned
Q
The number of delinquency cases petitioned in 2019 (386,600) was 26% less than
the number petitioned in 1985 (522,900). In comparison, the overall number of delin-
quency cases referred decreased 38% in that time.
Q The trend for nonpetitioned cases was similar to that of petitioned cases. The num-
ber of nonpetitioned delinquency cases increased 35% between 1985 and the peak
in 1995 and then declined 61% by 2019 for an overall decrease of 47%.
The petitioned caseload decreased for all offense categories in the 15
years between 2005 and 2019
85 87 89 91 93 95 97 99 01 03 05 07 09 11 13 15 17 19
0
100,000
200,000
300,000
400,000
500,000
Year
Petitioned cases
Property
Person
Public order
Drugs

Youth and the Juvenile Justice System: 2022 National Report
154
Percent of delinquency cases petitioned:
Offense 2010 2019
Delinquency 53% 54%
Person 55 55
Property 50 55
Drugs 50 42
Public order 55 56
The proportion of petitioned cases
changed little for all demographic
groups between 2010 and 2019
The likelihood of formal case process-
ing increased slightly from 2010 to
2019 for both males and females as
well as for Black and Hispanic youth
and for all ages.
Percent of adjudicated delinquency cases,
2019:
Demographic 2010 2019
Gender
Male 56% 57%
Female 43 45
Race/ethnicity
White 49 48
Black 59 60
Hispanic 50 52
American Indian 58 56
Asian 52 52
Age
15 or younger 49 51
16 or older 56 57
In 2019, as in 2010, courts petitioned
a larger share of delinquency cases in-
volving males than females. This was
true for each of the general offense
categories. In both 2010 and 2019,
courts petitioned a larger share of de-
linquency cases involving Black youth
than youth of any other race.
In 2019, juvenile courts petitioned more than 5 in 10 delinquency
cases for formal handling, and adjudicated youth delinquent in more
than half of those petitioned cases
Most serious offense
Number of
petitioned
cases
Percent of
delinquency
cases
petitioned
Number of
adjudicated
cases
Percent of
petitioned
cases
adjudicated
Total delinquency 386,600 54% 203,600 53%
Person offense 129,800 55 65,600 51
Violent Crime Index 41,300 77 23,800 58
Criminal homicide 900 82 500 50
Forcible rape 6,000 73 3,200 54
Robbery 15,900 85 9,900 62
Aggravated assault 18,400 72 10,200 55
Simple assault 72,200 47 33,000 46
Other violent sex offense 5,500 72 2,900 53
Other person offense 10,800 48 5,900 54
Property offense 118,200 55 62,600 53
Property Crime Index 82,600 57 44,700 54
Burglary 27,300 71 16,000 59
Larceny-theft 42,700 48 21,500 50
Motor vehicle theft 11,200 73 6,400 58
Arson 1,300 65 700 50
Vandalism 17,900 50 8,800 49
Trespassing 8,500 44 3,700 44
Stolen property offense 5,800 83 3,600 62
Other property offense 3,400 52 1,800 52
Drug law violation 40,400 42 20,400 51
Public order offense 98,300 56 55,000 56
Obstruction of justice 56,200 69 34,100 61
Disorderly conduct 19,700 41 9,200 47
Weapons offense 10,100 63 5,600 55
Liquor law violation 1,100 27 500 45
Nonviolent sex offense 5,300 46 2,700 52
Other public order offense 5,900 43 2,900 49
Q Generally, more serious offenses were more likely to be petitioned for formal
processing than were less serious offenses.
Q For criminal homicide and robbery, at least 82% of cases were petitioned. The
proportion of cases petitioned was lower than 50% for simple assault, larceny-
theft, trespassing, disorderly conduct, liquor law violations, and nonviolent sex
offenses.
Q For most offenses, the youth was adjudicated delinquent in about half of peti-
tioned cases.
Note: Detail may not add to totals because of rounding. Calculations are based on unrounded
numbers.
Source: Authors’ adaptation of Hockenberry and Puzzanchera’s
Juvenile Court Statistics 2019
.

Chapter 6: Youth in juvenile court
155
From 1985 to 2019, the number of cases in which the youth
was adjudicated delinquent fell 40%
Adjudication was more likely for
some types of cases than others
Youth were adjudicated delinquent in a
smaller proportion of person offense
cases than in cases involving other cat-
egories of offenses. This lower rate of
adjudication in person offenses cases
may reflect, in part, reluctance to di-
vert these cases from the formal juve-
nile justice system without a judge’s
review.
Adjudication rates also varied by gen-
der, race, and age of the youth. The
likelihood of adjudication in 2019 was
less for females than for males. This
was true across all offense categories.
Black youth were less likely to be adju-
dicated than were youth of other races.
Cases involving youth ages 15 or
younger were equally as likely as cases
involving older youth to result in adju-
dication, although older youth had a
greater share of cases waived to crimi-
nal court.
Percent of petitioned delinquency cases
adjudicated:
Demographic 2010 2019
Gender
Male 63% 54%
Female 57 47
Race
White 62 53
Black 59 50
Hispanic 66 58
American Indian 69 57
Asian 58 52
Age
15 or younger 62 53
16 or older 61 53
Offense profiles for petitioned and
adjudicated cases shows a shift
away from property cases
Compared with 2010, both petitioned
and adjudicated cases had increased
proportions of person offenses in 2019
and smaller proportions of property,
drug, and public order offenses.
Offense profile of delinquency cases:
Offense 2010 2019
Petitioned cases 100% 100%
Person 27 34
Property 35 31
Drugs 11 10
Public order 27 25
Adjudicated cases 100% 100%
Person 26 32
Property 35 31
Drugs 11 10
Public order 28 27
Note: Detail may not total 100% because of
rounding.
Since 1997, the number of cases adjudicated delinquent decreased for all general offense categories
87 91 95 99 03 07 11 15 19
0
100,000
200,000
300,000
400,000
500,000
600,000
700,000
Year
Cases adjudicated delinquent
Delinquency
87 91 95 99 03 07 11 15 19
0
50,000
100,000
150,000
200,000
250,000
300,000
Year
Cases adjudicated delinquent
Person
Drugs
Property
Public order
Q Although the number of cases in which the youth was adjudicated delinquent decreased 53% since the 2005 peak for person of-
fense cases, the number in 2019 was 19% above the level reported in 1985. For all other offense categories, the number of cases
that resulted in a delinquency adjudication was at the lowest level in 2019.
Source: Authors’ adaptation of Hockenberry and Puzzanchera’s
Juvenile Court Statistics 2019
.

Youth and the Juvenile Justice System: 2022 National Report
156
Most adjudicated delinquency cases result in residential
placement or formal probation
Residential placement and formal
probation caseloads saw a shift
away from property cases
Compared with 2010, both residential
placement and formal probation cases
had increased proportions of person
offenses in 2019. In 2019, cases or-
dered to residential placement had a
greater share of public order cases and
a smaller share of property and drug
cases than cases ordered to formal pro-
bation.
Offense profile of delinquency cases:
Offense 2010 2019
Residential placement 100% 100%
Person 27 33
Property 32 30
Drugs 8 6
Public order 33 31
Formal probation 100% 100%
Person 26 33
Property 36 31
Drugs 13 11
Public order 26 25
Note: Detail may not total 100% because of
rounding.
Residential placement and
probation caseloads decreased
between 2010 and 2019
The number of delinquency cases in
which adjudicated youth were ordered
out of the home to some form of resi-
dential placement declined 51% be-
tween 2010 and 2019, from 113,000
to 55,100. Similarly, the number of
delinquency cases receiving formal
probation as the most severe initial
disposition following adjudication de-
creased 53% from 2010 to 2019, from
278,700 to 132,200. The decrease in
cases ordered to out-of-home place-
ment or formal probation was consis-
tent with the decrease in delinquency
cases at referral (45%) and adjudication
(52%).
In 2019, residential placement or formal probation was ordered in
92% of cases in which the youth was adjudicated delinquent
Adjudicated cases
Most serious offense
Number
ordered to
placement
Percent
ordered to
placement
Number
ordered to
probation
Percent
ordered to
probation
Total delinquency 55,100 27% 132,200 65%
Person offense 18,400 28 43,600 66
Violent Crime Index 8,800 37 14,100 59
Criminal homicide 300 61 200 37
Forcible rape 1,000 30 2,200 67
Robbery 4,300 43 5,300 54
Aggravated assault 3,300 32 6,500 64
Simple assault 7,800 24 22,900 69
Other violent sex offense 600 20 2,200 76
Other person offense 1,100 19 4,400 74
Property offense 16,700 27 40,600 65
Property Crime Index 13,000 29 28,400 64
Burglary 5,500 35 9,900 62
Larceny-theft 4,700 22 14,400 67
Motor vehicle theft 2,600 40 3,700 57
Arson 100 23 500 72
Vandalism 1,800 21 6,000 69
Trespassing 600 17 2,500 68
Stolen property offense 900 24 2,400 67
Other property offense 400 23 1,200 69
Drug law violation 3,200 16 14,900 73
Public order offense 16,800 31 33,100 60
Obstruction of justice 12,900 38 19,200 56
Disorderly conduct 1,100 12 5,800 63
Weapons offense 1,600 29 3,800 67
Liquor law violation 100 19 400 74
Nonviolent sex offense 600 22 2,000 74
Other public order offense 500 17 1,900 64
Q Cases involving youth adjudicated for serious person offenses, such as homi-
cide or robbery, were the most likely cases to result in residential placement.
Q Probation was the most restrictive disposition used in 132,200 cases adjudicat-
ed delinquent in 2019—65% of all such cases handled by juvenile courts.
Q Obstruction of justice had a relatively high residential placement rate, stemming
from the inclusion in the category of certain offenses (e.g., escapes from con-
finement, violations of probation or parole) that have a high likelihood of place-
ment.
Note: Detail may not add to totals because of rounding. Calculations are based on unrounded
numbers.
Source: Authors’ analyses of the National Center for Juvenile Justice’s
National Juvenile Court
Data Archive: Juvenile court case records 1985–2019
[machine-readable data file].

Chapter 6: Youth in juvenile court
157
The number of adjudicated cases re-
ceiving other sanctions (e.g., commu-
nity service, restitution) as their most
severe disposition decreased 55% from
2010 to 2019, from 36,500 to 16,300.
However, the majority of cases result-
ing in other sanctions were handled in-
formally.
Probation was more likely than
residential placement
In 27% of adjudicated delinquency
cases, the court ordered the youth to
residential placement, such as a train-
ing school, treatment center, drug
treatment or private placement facility,
or group home. In 65% of adjudicated
delinquency cases, probation was the
most severe sanction ordered.
Percent of adjudicated delinquency cases,
2019:
Demographic
Residential
placement
Formal
probation
Total 27% 65%
Gender
Male 29 64
Female 21 68
Race/ethnicity
White 22 68
Black 31 61
Hispanic 31 65
American Indian 25 65
Asian 21 75
Age
15 or younger 25 67
16 or older 29 63
Once adjudicated, females were less
likely than males, and White youth
were less likely than Black, Hispanic, or
American Indian youth to be ordered
to residential placement. These demo-
graphic patterns in the use of residen-
tial placement or probation, however,
do not control for criminal histories
and other risk factors related to dispo-
sitional decisions and increased severity
of sanctions.
In 2019, across offenses, the number of adjudicated cases resulting in
residential placement or probation reached their lowest level since 1985
Q The number of property offense cases ordered to residential placement peaked in
1997, while person and drug offense cases peaked 2 years later, and public order
offense cases peaked in 2000. Since their respective peaks and 2019, the number
of cases ordered to residential placement declined considerably: property (77%),
drugs (83%), person (57%), and public order (69%).
Q The pattern for cases ordered to formal probation was similar to that of residential
placement. The number of property offense cases ordered to probation peaked in
1997, drug offense cases peaked in 2001, and person and public order offense
cases peaked in 2004. For each offense, the decline in the number of cases ordered
to probation between their peak and 2019 was similar to the decline for cases or-
dered to placement: property (76%), drugs (70%), person (52%), and public order
(65%).
Q As a result, property offenses accounted for a smaller share of cases ordered to
placement or probation in 2019 than in 1985, while person and public order offens-
es accounted for a larger share.
Source: Authors’ adaptation of Hockenberry and Puzzanchera’s
Juvenile Court Statistics 2019
.
85 87 89 91 93 95 97 99 01 03 05 07 09 11 13 15 17 19
0
10,000
20,000
30,000
40,000
50,000
60,000
70,000
80,000
Year
Cases adjudicated delinquent, resulting in out-of-home placement
Public order
Drugs
Person
Property
Placement
85 87 89 91 93 95 97 99 01 03 05 07 09 11 13 15 17 19
0
20,000
40,000
60,000
80,000
100,000
120,000
140,000
160,000
180,000
Year
Cases adjudicated delinquent, resulting in probation
Public order
Drugs
Person
Property
Probation

Youth and the Juvenile Justice System: 2022 National Report
158
How were delinquency cases processed in juvenile courts
in 2019?
Juvenile courts can impose a
range of sanctions
Although juvenile courts handled 46%
of delinquency cases without the filing
of a petition, more than half of these
nonpetitioned cases received some sort
of sanction. Youth may have agreed to
informal probation, restitution, or
community service, or the court may
have referred them to another agency
for services. Although probation staff
monitor the youth’s compliance with
the informal agreement, such disposi-
tions generally involve little or no con-
tinuing supervision by probation staff.
In 46% of all petitioned delinquency
cases, the youth was not adjudicated
delinquent. The court dismissed 57%
of these cases. The cases dismissed by
the court, together with the cases that
were dismissed at intake, accounted for
239,200 cases (or 331 of 1,000 cases
handled).
In 54% of all petitioned cases, the
courts imposed a formal sanction or
waived the case to criminal court.
Thus, of every 1,000 delinquency cases
handled in 2019, 286 resulted in a
court-ordered sanction or waiver.
In 2019, 53% (203,600) of the cases
that were handled formally (with the
filing of a petition) resulted in a delin-
quency adjudication. In 65% (132,200)
of cases adjudicated delinquent in
2019, formal probation was the most
severe sanction ordered by the court.
In contrast, 27% (55,100) of cases ad-
judicated delinquent resulted in place-
ment outside the home in a residential
facility.
722,600 estimated Waived
delinquency cases 3,300 1%
Placed
55,100 27%
Adjudicated
delinquent Probation
203,600 53% 132,200 65%
Other sanction
16,400 8%
Petitioned
386,600 54%
Probation
61,800 34%
Not adjudicated
delinquent Other sanction
179,700 46% 15,600 9%
Dismissed
102,400 57%
Probation
52,000 15%
Not petitioned Other sanction
336,000 46% 147,200 44%
Dismissed
136,800 41%
Notes: Cases are categorized by their most severe or restrictive sanction. Detail may not add to totals
because of rounding. Annual case processing flow diagrams for 1985 through 2010 are available online
at ojjdp.gov/ojstatbb/court/faqs.asp.
Source: Authors’ adaptation of Hockenberry and Puzzanchera’s
Juvenile Court Statistics 2019
.
The most severe sanction ordered in 16,400 adjudicated delinquency
cases (8%) in 2019 was something other than residential placement or
probation, such as restitution or community service
A typical 1,000 5 Waived
delinquency cases
76 Placed
Adjudicated
282 delinquent 183 Pro ba tion
535 Petitioned 23 Other sanction
85 Probation
Not adjudicated
249 delinquent 22 Other sanction
142 Dismissed
72 Probation
465 Nonpetitioned 204 Other sanction
189 Dismissed
Adjudicated cases receiving sanctions other than residential placement
or probation accounted for 23 out of 1,000 delinquency cases
processed during the year

Chapter 6: Youth in juvenile court
159
Variations in delinquency case processing were more evident between males and females than between
younger and older youth in 2019
Intake
decision
profile
(percent of
all cases)
Judicial
decision
profile
(percent of
petitioned cases)
Judicial
disposition
profile
(percent of
adjudicated
cases)
Judicial
disposition
profile
(percent of non-
adjudicated
cases)
Informal
disposition
profile
(percent of non-
petitioned cases)
Offense/
demographic
Number
of cases
Petitioned
Not
petitioned
Waived
Adjudicated
delinquent
Not
adjudicated
delinquent
Placed
Probation
Other
Probation
Other
Dismissed
Probation
Other
Dismissed
Delinquency 722,600 54% 46% 0.9% 53% 46% 27% 65% 8% 34% 9% 57% 15% 44% 41%
Male 522,300 57 43 1.0 54 45 29 64 7 35 8 57 16 42 42
Female 200,300 45 55 0.3 47 52 21 68 11 33 9 58 15 47 38
15 and younger 393,400 51 49 0.2 53 47 25 67 8 35 9 56 17 45 38
16 and older 566,400 52 48 0.5 53 46 26 66 8 35 9 56 17 44 39
Person 237,000 55 45 1.6 51 48 28 66 6 34 9 56 15 39 46
Male 164,000 58 42 2.0 53 45 30 65 5 35 9 56 15 37 48
Female 73,000 47 53 0.3 45 55 22 71 7 34 10 56 15 43 42
15 and younger 144,400 52 48 0.4 50 49 25 69 6 36 9 55 16 42 42
16 and older 92,600 60 40 3.1 51 46 31 63 6 33 9 58 13 35 52
Property 214,500 55 45 0.7 53 46 27 65 8 34 9 57 16 45 39
Male 160,500 59 41 0.8 55 45 28 64 7 35 9 56 16 43 41
Female 54,000 44 56 0.3 46 54 18 68 13 32 10 58 15 50 36
15 and younger 117,100 54 46 0.1 54 46 25 67 8 35 9 55 17 46 37
16 and older 97,400 57 43 1.3 52 47 29 63 9 33 9 58 14 43 43
Drugs 96,400 42 58 0.6 51 49 16 73 11 38 10 51 20 52 29
Male 71,700 44 56 0.6 51 48 17 73 10 38 10 52 19 51 30
Female 24,800 36 64 0.5 48 51 12 73 15 40 11 49 21 52 27
15 and younger 39,400 37 63 0.1 52 48 16 74 10 38 10 51 22 52 26
16 and older 57,000 46 54 0.8 50 49 16 72 12 39 10 51 17 51 31
Public order 174,700 56 44 0.3 56 44 31 60 9 32 7 61 14 43 44
Male 126,200 59 41 0.3 57 42 32 59 8 34 7 60 13 41 45
Female 48,500 50 50 0.1 52 48 25 63 12 29 7 64 14 46 40
15 and younger 92,500 51 49 0.0 55 45 28 62 10 32 7 60 14 45 40
16 and older 82,200 62 38 0.5 57 43 33 58 9 32 6 62 12 39 48
Q Without exception, cases involving males were more likely to receive formal sanctions than cases involving females. For ex-
ample, in 2019, 55% of all petitioned delinquency cases involving males were adjudicated delinquent or waived to criminal
court, compared with 48% of cases involving females.
Q Regardless of offense, cases involving youth age 16 and older were more likely to be petitioned and, once petitioned, more
likely to be judicially waived to criminal court than cases involving youth age 15 and younger. Although cases involving older
youth were equally as likely to result in a delinquency adjudication as those involving their younger peers, older youth were
more likely to receive a disposition of out-of-home placement following adjudication.
Note: Detail may not add to totals because of rounding. Calculations are based on unrounded numbers.
Source: Authors’ analysis of Puzzanchera et al.’s
Easy Access to Juvenile Court Statistics 2019
.

Youth and the Juvenile Justice System: 2022 National Report
160
Delinquency case processing outcomes varied considerably by race in 2019
Intake
decision
profile
(percent of
all cases)
Judicial
decision
profile
(percent of
petitioned cases)
Judicial
disposition
profile
(percent of
adjudicated
cases)
Judicial
disposition
profile
(percent of non-
adjudicated
cases)
Informal
disposition
profile
(percent of non-
petitioned cases)
Offense/
demographic
Number
of cases
Petitioned
Not
petitioned
Waived
Adjudicated
delinquent
Not
adjudicated
delinquent
Placed
Probation
Other
Probation
Other
Dismissed
Probation
Other
Dismissed
Delinquency 722,600 54% 46% 0.9% 53% 46% 27% 65% 8% 34% 9% 57% 15% 44% 41%
White 310,200 48 52 0.7 53 46 22 68 10 36 9 54 18 47 35
Black 254,800 60 40 1.1 50 49 31 61 8 32 8 60 12 39 49
Hispanic 136,100 52 48 0.6 58 41 31 65 4 38 8 54 15 44 42
American Indian 12,900 56 44 0.6 57 42 25 65 11 22 6 71 14 43 43
Asian 8,700 52 48 0.6 52 47 21 75 5 26 10 64 16 49 36
Person 237,000 55 45 1.6 51 48 28 66 6 34 9 56 15 39 46
White 97,800 50 50 1.2 50 49 22 71 6 37 10 54 18 40 42
Black 90,200 60 40 2.0 48 50 31 62 6 31 9 60 11 37 52
Hispanic 42,300 54 46 1.3 57 42 32 65 3 40 8 52 14 41 45
American Indian 4,000 57 43 1.2 55 44 32 63 5 26 7 67 14 41 45
Asian 2,600 56 44 1.4 53 46 21 76 3 25 14 61 20 39 42
Property 214,500 55 45 0.7 53 46 27 65 8 34 9 57 16 45 39
White 89,400 49 51 0.6 54 46 22 68 10 36 10 54 19 49 32
Black 82,100 62 38 0.9 50 49 31 61 9 32 9 59 12 39 49
Hispanic 36,100 54 46 0.4 57 42 29 66 4 40 9 52 14 44 42
American Indian 4,200 57 43 0.2 59 41 21 67 12 19 7 74 17 44 40
Asian 2,800 45 55 0.4 53 47 20 73 7 25 10 65 15 48 37
Drugs 96,400 42 58 0.6 51 49 16 73 11 38 10 51 20 52 29
White 51,500 40 60 0.6 51 49 13 74 13 40 12 48 21 54 25
Black 18,200 52 48 0.7 47 52 19 70 11 33 9 58 16 44 40
Hispanic 23,200 38 62 0.4 53 47 18 75 7 43 9 48 19 50 30
American Indian 2,200 46 54 0.3 58 42 18 65 17 21 7 72 12 50 37
Asian 1,300 43 57 0.2 43 56 14 74 11 31 9 61 19 57 25
Public order 174,700 56 44 0.3 56 44 31 60 9 32 7 61 14 43 44
White 71,500 51 49 0.3 57 43 25 61 14 33 7 59 16 45 38
Black 64,200 61 39 0.2 51 48 34 58 8 32 6 62 11 40 49
Hispanic 34,600 57 43 0.2 64 36 35 61 3 32 6 62 11 41 47
American Indian
2,500 60
40
0.2 59 40 23 64 13 21 5 74 11 36 53
Asian 2,000 61 39 0.2 55 45 22 75 3 25 6 69 9 59 33
Q Overall, cases involving Black youth (60%) or American Indian youth (56%) were more likely to be formally processed (i.e., pe-
titioned) than cases involving Asian or Hispanic youth (52% each) or White youth (48%). Once petitioned, cases involving His-
panic or American Indian youth were more likely to receive formal sanctions than cases involving youth of other races. In
2019, 59% of all petitioned cases involving Hispanic youth and 58% of cases involving American Indian youth were adjudicat-
ed delinquent or waived to criminal court, compared with 54% of cases involving White youth, 53% involving Asian youth,
and 51% involving Black youth.
Note: Detail may not add to totals because of rounding. Calculations are based on unrounded numbers.
Source: Authors’ analysis of Puzzanchera et al.’s
Easy Access to Juvenile Court Statistics 2019
.

Chapter 6: Youth in juvenile court
161
By 2019, the number of cases waived from juvenile court to
criminal court had decreased to a level below that of 1985
The profile of waived cases has
changed
In the late 1980s, property cases ac-
counted for at least half of all delin-
quency cases judicially waived from ju-
venile court to criminal court. In the
early 1990s, the property offense share
of waived cases diminished as the per-
son offense share grew. By 1993, the
waiver caseload had a greater propor-
tion of person offense cases than prop-
erty cases and in 2019, person offenses
accounted for 61% of all waived cases.
Drug and public order cases made up
smaller proportions of waived cases
across all years. For example, in 2019,
7% of waived cases were drug offenses
and 8% were public order cases.
86 89 92 95 98 01 04 07 10 13 16 19
0%
20%
40%
60%
80%
100%
Year
Proportion of judicially waived delinquency cases
Person
Property
Drugs
Public order
The demographic characteristics of ju-
dicially waived cases have changed
since the 1990s
Demographic profiles of judicially waived
delinquency cases:
Demographic 1994 2010 2019
Gender
Male 95% 93% 94%
Female 5 7 6
Race
White NA 40 33
Black NA 45 52
Hispanic NA 12 12
American Indian NA 2 2
Asian NA 1 2
Age
15 or younger 13 12 12
16 or older 87 88 88
Note: Data for 1994 are displayed because
that was the year with the greatest number of
total waived cases. Race data for 1994 are
not compatible with 2010 and 2019.
Juvenile courts waived 75% fewer delinquency cases to criminal court
in 2019 than in 1994 (the peak year)
85 87 89 91 93 95 97 99 01 03 05 07 09 11 13 15 17 19
0
2,000
4,000
6,000
8,000
10,000
12,000
14,000
Year
Cases judicially waived to criminal court
Total delinquency
87 91 95 99 03 07 11 15 19
0
1,000
2,000
3,000
4,000
5,000
6,000
Year
Cases judicially waived to criminal court
Person
Property
Drugs
Public order
87 91 95 99 03 07 11 15 19
0%
1%
2%
3%
4%
Year
Percent of petitioned cases judicially waived
to criminal court
Drugs
Person
Property
Public order
Q The number of delinquency cases waived to criminal court climbed 120% from
1985 to 1994, from 5,900 cases to 13,000. By 2019, the number of waived cases
was 75% below the 1994 peak, an overall decrease of 44% since 1985.
Q Between 1993 and 2019, person offenses outnumbered property offenses among
waived cases. Prior to 1993, property cases outnumbered person offense cases
among waivers—sometimes by a ratio of 2 to 1.
Q The number of waived person offense cases nearly tripled (182%) from 1985 to
1994 and then declined 63% to 2019, an overall increase of 6% between 1985 and
2019. Over the 1985–2019 period, waived property offense cases were down 75%,
and waived public order offense cases were down 55%.
Q The overall proportion of petitioned delinquency cases that were waived was 1.1%
in 1985, reached 1.5% in 1994, and then dropped to 0.9% by 2019.
Q For most years between 1985 and 2019, person offense cases were the most likely
type of case to be waived to criminal court. The exception was 1989–1992, when
drug offense cases were the most likely to be waived.
Source: Authors’ adaptation of Hockenberry and Puzzanchera’s
Juvenile Court Statistics 2019
.

Youth and the Juvenile Justice System: 2022 National Report
162
The proportions of judicially waived
cases changed little for males and fe-
males and youth of all ages between
2010 and 2019. In both 2010 and
2019, Black youth accounted for the
largest proportion of waived cases.
The likelihood of waiver varied
across case characteristics
In 2019, the proportion of cases
waived was greater for males than for
females. This was true in each of the
four general offense categories. For ex-
ample, males charged with person of-
fenses were 6 times as likely as females
charged with person offenses to have
their cases waived to criminal court.
However, this comparison does not
control for differences in the serious-
ness of offenses or a youth’s offense
history.
Percent of petitioned cases judicially
waived to criminal court, 2019:
Offense Male Female
Delinquency 1.0% 0.3%
Person 2.0 0.3
Property 0.8 0.3
Drugs 0.6 0.5
Public order 0.3 0.1
In 2019, with the exception of public
order offenses, Black youth were more
likely than other youth to be waived
for all offense types. Regardless of race,
person offenses were more likely to be
waived than cases involving other of-
fenses.
Percent of petitioned cases judicially
waived to criminal court:
Race/ethnicity
Delinquency
2010 2019
White 0.8% 0.7%
Black 1.0 1.1
Hispanic 0.6 0.6
American Indian 0.9 0.6
Asian 0.4 0.6
Percent of petitioned cases judicially
waived to criminal court, 2019:
Race/
ethnicity Person Property Drugs
Public
order
White 1.2% 0.6% 0.6% 0.3%
Black 2.0 0.9 0.7 0.2
Hispanic 1.3 0.4 0.4 0.2
American
Indian 1.2 0.2 0.3 0.2
Asian 1.4 0.4 0.2 0.2
Cases involving younger youth were
less likely to be waived than were cases
involving older youth. This was true
for each of the four general offense
categories. For example, among person
offense cases, youth age 16 or older
were 8 times more likely to be waived
than youth age 15 or younger.
Percent of petitioned cases judicially
waived to criminal court, 2019:
Offense
Age 15
or younger
Age 16
or older
Delinquency 0.2% 1.6%
Person 0.4 3.1
Property 0.1 1.3
Drugs 0.1 0.8
Public order 0.0 0.5
Racial differences in case waivers stemmed primarily from differences
in person and drug offense cases
05 07 09 11 13 15 17 19
0.0%
0.5%
1.0%
1.5%
2.0%
2.5%
Year
Percent of petitioned cases judicially waived
to criminal court
White
Black
Hispanic
Person
05 07 09 11 13 15 17 19
0.0%
0.2%
0.4%
0.6%
0.8%
1.0%
1.2%
Year
Percent of petitioned cases judicially waived
to criminal court
White
Black
Hispanic
Property
Q For most of the period from 2005 to 2019, the likelihood of waiver was greater for
Black youth than for White or Hispanic youth, regardless of offense category. These
data, however, do not control for racial differences in offense seriousness within the
general offense categories or differences in the seriousness of youth’s offense histo-
ries.
Source: Authors’ adaptation of Hockenberry and Puzzanchera’s
Juvenile Court Statistics
2019.
05 07 09 11 13 15 17 19
0.0%
0.4%
0.8%
1.2%
1.6%
Year
Percent of petitioned cases judicially waived
to criminal court
White
Black
Hispanic
Drugs
05 07 09 11 13 15 17 19
0.0%
0.1%
0.2%
0.3%
0.4%
0.5%
Year
Percent of petitioned cases judicially waived
to criminal court
White
Black
Hispanic
Public order

Chapter 6: Youth in juvenile court
163
Identifying disparity in justice system processing helps target
efforts to address racial and ethnic fairness
Racial and ethnic disparities have
been a long-standing challenge in
the juvenile justice system
Youth from racial and ethnic minority
groups experience the juvenile justice
system differently than their White
peers. For example, youth from racial
and ethnic minority groups are (and
have been) more likely to be arrested,
detained, and ordered to residential
placement than White youth, and are
more likely to be tried as adults in
criminal court. Such racial and ethnic
disparities often leads to the overrepre-
sentation of racial and ethnic minority
youth—particularly Black youth—at
various stages of the juvenile justice
system. Despite decades of research to
understand and address these dispari-
ties, national data suggests that consid-
erably more work is needed to ensure
that youth served by the juvenile jus-
tice system are treated fairly, and that
case processing decisions ensure public
safety and equal justice, regardless of
youths’ race/ethnicity.
Overrepresentation, disparity, and
discrimination have different
meanings
Overrepresentation refers to a situation
in which a larger proportion of a par-
ticular group is present at various stag-
es of the juvenile justice system (such
as intake, detention, and residential
placement) than would be expected
based on their proportion in the gen-
eral population.
Disparity means that the probability of
receiving a particular outcome (for ex-
ample, being detained in a short-term
facility vs. not being detained) differs
for different groups. Disparity may in
turn lead to overrepresentation
Discrimination occurs if and when ju-
venile justice system decisionmakers
treat one group of youth differently
from another group of youth based
wholly, or in part, on their gender, ra-
cial, and/or ethnic status.
Neither overrepresentation nor
disparity necessarily implies
discrimination
Discrimination is one possible explana-
tion for disparity and overrepresenta-
tion. This line of reasoning suggests
that because of discrimination on the
part of justice system decisionmakers,
youth in racial and ethnic minority
groups face higher probabilities of
being arrested by the police, referred
to court intake, held in short-term de-
tention, petitioned for formal process-
ing, adjudicated delinquent, and con-
fined in a secure juvenile facility. Thus,
differential actions throughout the jus-
tice system may account for overrepre-
sentation.
Disparity and overrepresentation, how-
ever, can result from factors other than
discrimination. Factors relating to the
nature and volume of crime committed
by youth in racial and ethnic minority
groups may explain disproportionality.
This line of reasoning suggests that if
youth from certain demographic sub-
groups (e.g., gender or race/ethnicity)
commit proportionately more crime
than other youth, are involved in more
serious incidents, and have more exten-
sive criminal histories, they will be
overrepresented, even if no discrimina-
tion by system decisionmakers oc-
curred. Thus, some demographic sub-
groups may be overrepresented within
the juvenile justice system because of
behavioral, legal, or structural factors.
In any given jurisdiction, either or
both of these causes may be operating.
Overrepresentation and disparity
exist at many stages of the
juvenile justice system
Common methods of assessing racial
and ethnic fairness include comparing
Compared with their proportion in the population, Black youth are
overrepresented at various juvenile justice decision points
Waived
delinquency cases
Placed
delinquency cases
Adjudicated
delinquency cases
Petitioned
delinquency cases
Detained
delinquency cases
Referred
delinquency cases
Population (ages
10−upper age)
0% 10% 20% 30% 40% 50% 60% 70% 80% 90% 100%
33% 51% 14% 2%
31% 43% 23% 3%
39% 37% 20% 3%
39% 40% 18% 3%
34% 40% 23% 3%
43% 35% 19% 3%
53% 15% 24% 8%
Percent of youth, 2019
White Black Other*Hispanic
Q Disproportionality or overrepresentation refers to a situation in which a larger pro-
portion of a particular group is present at various stages within the juvenile justice
system than would be expected based on its proportion in the general population.
Q The proportion of Black youth at various stages of juvenile court processing was at
least twice their proportion of the youth population in 2019.
*Because American Indian and Asian proportions are too small to display individually, they are com-
bined in the category “other races.”
Source: Authors’ analysis of Puzzanchera, Sladky, and Kang’s
Easy Access to Juvenile Populations
1990-2020
and Sickmund, Sladky, and Kang’s
Easy Access to Juvenile Court Statistics 1985-
2019.

Youth and the Juvenile Justice System: 2022 National Report
164
In 2019, disparities existed in delinquency case processing between
White youth and youth from racial and ethnic minority groups
Case processing stage Total White Black Hispanic
American
Indian Asian
Case rates
Cases referred per 1,000
population (10–upper age) 22.7 18.3 53.9 17.6 21.5 4.5
Cases diverted per 100
cases referred 27.6 33.5 20.1 27.9 25.3 31.0
Cases detained per 100
cases referred 25.8 20.3 29.5 31.5 25.2 25.6
Cases petitioned per 100
cases referred 53.5 48.4 60.3 52.3 55.7 51.9
Cases adjudicated per 100
cases petitioned 52.7 52.9 49.6 58.3 57.4 52.3
Probation cases per 100
adjudicated cases 64.9 68.0 61.1 65.4 64.5 74.5
Placement cases per 100
adjudicated cases 27.1 21.7 31.0 30.6 24.6 20.6
Waived cases per 100
petitioned cases 0.9 0.7 1.1 0.6 0.6* 0.6*
Ratio of rates
†
Referral rate 2.9 1.0 1.2 0.2
Diversion rate 0.6 0.8 0.8 0.9
Detention rate 1.4 1.6 1.2 1.3
Petitioned rate 1.2 1.1 1.2 1.1
Adjudication rate 0.9 1.1 1.1 1.0
Probation rate 0.9 1.0 0.9 1.1
Placement rate 1.4 1.4 1.1 1.0
Waiver rate 1.5 0.9 0.8 0.9
Q In 2019, cases involving Black youth were nearly 3 times more likely to be re-
ferred to juvenile court for a delinquency offense than cases involving White
youth.
Q The diversion rate for cases involving Black, Hispanic, and American Indian
youth was less than the diversion rate for cases involving White youth.
Q Delinquency cases involving racial and ethnic minority youth were more likely to
involve detention than cases involving White youth.
Q Cases involving Black youth were more likely to be petitioned than cases in-
volving White youth, but were less likely to result in a delinquency adjudication.
Q Cases involving Hispanic youth were 60% more likely to involve detention than
cases involving White youth, and 40% more likely to receive a placement dis-
position.
*Rate based on fewer than 50 cases
†
The ratio of rates is created by dividing the rates for each racial or ethnic minority group by the
White rate. A ratio of 1.0 indicates parity, i.e., the rates for the comparison group are equal. For
example, if White youth and Black youth were referred at the same rate, the ratio would be 1.0, in-
dicating the rates for these groups are equal. A ratio greater than 1.0 means that the rate for the
racial or ethnic minority group is greater than the rate for White youth. A ratio less than 1.0 means
that the rate for the racial and ethnic minority group is less than the rate for White youth.
Note: Calculations are based on unrounded numbers.
Source: Authors’ analysis of Puzzanchera et al’s
Easy Access to Juvenile Populations 1990-2020
and Sickmund et al’s
Easy Access to Juvenile Court Statistics 1985-
2019.
proportions or using a combination of
case processing rates and ratios. When
using proportions, the racial/ethnic
profile of youth in the general popula-
tion is compared to the profile at stag-
es of the juvenile justice system. For
example, the 2019 youth population
was 53% White, 15% Black, 24% His-
panic, 2% American Indian, and 6%
Asian, whereas the profile of juvenile
court referrals was 43% White, 35%
Black, 19% Hispanic, 2% American In-
dian and 1% Asian. At the point of
court referral, Black youth were over-
represented, while White, Hispanic, and
Asian youth were underrepresented.
Disparity and overrepresen-
tation are present at arrest
Unlike the national estimates of ju-
venile court data, national arrest es-
timates do not account for ethnicity.
Nonetheless, there is considerable
evidence of racial inequities at the
point of arrest. Black youth ac-
counted for 17% of the youth pop-
ulation in 2019 (ages 10–17), but
accounted for 34% of juvenile ar-
rests. For specific offenses, the
level of overrepresentation for Black
youth was more substantial: in
2019, Black youth accounted for
48% of juvenile arrests for violent
crimes, nearly 3 times their propor-
tion of the youth population.
Profile, 2019:
Race
Population
(ages 10–17)
Juvenile
arrests
Total 100% 100%
White 75 63
Black 17 34
American Indian 2 2
Asian 6 1
Comparing arrest rates (per 100,000
youth ages 10–17) reveals similar
disparities. In 2019, the overall juve-
nile arrest rate for Black youth was
60% above the rate for American
Indian youth, more than double the
rate for White youth, and nine times
the rate for Asian youth.

Chapter 6: Youth in juvenile court
165
Alternatively, calculating case process-
ing rates by race/ethnicity at multiple
stages of the juvenile justice system can
help identify disparities between racial
and ethnic subgroups at different deci-
sion points. Comparing the ratio of
these rates between racial and ethnic
minority youth and White youth indi-
cate how much more (or less) likely ra-
cial and ethnic minority youth experi-
ence certain case processing outcomes
compared with their White peers. For
example, the 2019 juvenile court refer-
ral rate for Black youth was 53.9 (per
1,000 youth ages 10 to the upper age
of juvenile court jurisdiction) com-
pared with a rate of 18.3 for White
youth. In other words, Black youth
were nearly 3 times (53.9 / 18.3 =
2.9) more likely to be referred to juve-
nile court than their White peers.
Regardless of offense, detention and placement rates in 2019 were higher for cases involving Black or
Hispanic youth than for cases involving White youth
Person Property Drugs Public order
0
4
8
12
16
20
Case referred per 1,000 youth (ages 10–upper age), 2019
Referral
Person Property Drugs Public order
0
10
20
30
40
50
Cases diverted per 100 cases referred, 2019
Diversion
Q Across offenses, the referral rate for cases involving Black youth exceeded the referral rates for cases involving youth of other ra-
cial/ethnic groups in 2019. For example, the referral rate for cases involving Black youth was more than 3 times the referral rate
for cases involving White or Hispanic youth for all but drug offense cases.
Q Once referred, cases involving youth in racial and ethnic minority groups were less likely than cases involving White youth to be
diverted from formal court processing, regardless of offense. With the exception of public order cases, cases involving Black
youth were least likely to be diverted.
Q Detention rates were higher for cases involving youth in racial and ethnic minority groups than for cases involving White youth for
all offenses in 2019.
Q Residential placement rates for adjudicated delinquency cases were higher for cases involving Black and Hispanic youth than for
cases involving White youth. On average, placement rates for Black and Hispanic youth were at least 30% higher than the rate
for White youth for each offense in 2019.
Source: Authors’ analysis of Puzzanchera et al’s
Easy Access to Juvenile Populations 1990-2020
and Sickmund et al’s
Easy Access to Juvenile Court Statis-
tics 1985-
2019.
Person Property Drugs Public order
0
10
20
30
40
Cases detained per 100 cases referred, 2019
Detention
Person Property Drugs Public order
0
10
20
30
40
Cases placed per 100 cases adjudicated, 2019
Placement
White Black Amer. IndianHispanic
Asian

Youth and the Juvenile Justice System: 2022 National Report
166
Since 2005, the disparity in referral, detention, and placement rates for delinquency offenses between Black
youth and White youth has remained high
2005 2007 2009 2011 2013 2015 2017 2019
0
20
40
60
80
100
120
Cases referred per 1,000 youth (ages 10−upper age)
Black
Asian
Delinquency referral rates
White
Hispanic
Amer. Indian
2005 2007 2009 2011 2013 2015 2017 2019
0.0
0.5
1.0
1.5
2.0
2.5
3.0
3.5
Ratio of racial/ethnic group rate to White rate
Black
Asian
Delinquency referral rate ratios
Parity
Hispanic
Amer. Indian
Q Each year since 2005, Black youth were considerably more likely to be referred to juvenile court for a delinquency offense than
youth of other racial/ethnic groups. On average, the annual referral rate for cases involving Black youth was 3 times the rate for
cases involving White youth, more than twice the rate for cases involving American Indian and Hispanic youth, and 10 times the
rate for cases involving Asian youth.
Q Since 2005, the ratio of Black-to-White detention rates ranged from 1.3 to 1.5, meaning that delinquency cases involving Black
youth were 30%–50% more likely to involve detention than cases involving White youth. During the same period, cases involving
Hispanic youth were 40%–60% more likely to be detained than cases involving White youth. Similarly, placement rates for delin-
quency cases involving Black and Hispanic youth were 30%–50% higher than the placement rate for cases involving White youth.
Note: The “parity” line displays a ratio of 1.0, which indicates the ratio of rates if the racial/ethnic minority group and White youth rates were equal.
Source: Authors’ analysis of Puzzanchera et al’s
Easy Access to Juvenile Populations 1990-2020
and Sickmund et al’s
Easy Access to Juvenile Court Statis-
tics 1985-
2019.
2005 2007 2009 2011 2013 2015 2017 2019
0
5
10
15
20
25
30
35
Cases detained per 100 cases referred
Black
Asian
Delinquency detention rates
White
Hispanic
Amer. Indian
2005 2007 2009 2011 2013 2015 2017 2019
0.0
0.2
0.4
0.6
0.8
1.0
1.2
1.4
1.6
Ratio of racial/ethnic group rate to White rate
Black
Asian
Delinquency detention rate ratios
Parity
Hispanic
Amer. Indian
2005 2007 2009 2011 2013 2015 2017 2019
0
5
10
15
20
25
30
35
Cases placed per 100 cases adjudicated
Black
Asian
Delinquency placement rates
White
Hispanic
Amer. Indian
0.0
0.2
0.4
0.6
0.8
1.0
1.2
1.4
1.6
1.8
Ratio of racial/ethnic group rate to White rate
Black
Asian
Delinquency placement rate ratios
Parity
Hispanic
Amer. Indian
2005 2007 2009 2011 2013 2015 2017 2019

Chapter 6: Youth in juvenile court
167
Regardless of gender, delinquency cases involving Black youth were most likely to be referred to juvenile
court, while cases involving White youth were least likely to involve detention in 2019
Asian
Hispanic
White
American
Indian
Black
0 1020304050607080
Cases referred per 1,000 youth (ages 10−upper age), 2019
76.6
28.6
25.7
25.6
6.4
Referral
Asian
Hispanic
White
American
Indian
Black
0 5 10 15 20 25 30 35 40
Cases referred per 1,000 youth (ages 10−upper age), 2019
30.5
14.2
10.6
9.2
2.6
Referral
Q Referral rates in 2019 were highest for cases involving Black youth, regardless of gender. For both males and females, the referral
rate for cases involving Black youth was more than twice the rate for cases involving American Indian youth, about 3 times the
rate for cases involving White and Hispanic youth, and more than 11 times the rate for cases involving Asian youth.
Q For both males and females, detention rates in 2019 were highest for cases involving Hispanic youth. For females, cases involv-
ing Hispanic youth were 60% more likely to result in detention than cases involving White youth. Similarly, for males, cases in-
volving Hispanic youth were 50% more likely to result in detention than cases involving White youth.
Q Among males, placement rates were highest for cases involving Black and Hispanic youth, each of which were 40–50% higher
than the rates for American Indian, White, and Asian youth. Among females, placement rates were highest for American Indian
and Hispanic youth, which were 20–30% higher than the rate for Black youth, 30–40% higher than the rate for White youth, and
70–80% higher than the rate for Asian youth.
Source: Authors’ analysis of Puzzanchera et al’s
Easy Access to Juvenile Populations 1990-2020
and Sickmund et al’s
Easy Access to Juvenile Court Statis-
tics 1985-
2019.
White
American
Indian
Asian
Black
Hispanic
0 5 10 15 20 25 30 35 40 45 50
Cases detained per 100 cases referred, 2019
33.3
32.4
27.3
26.7
21.7
Detention
White
Asian
Black
American
Indian
Hispanic
0 5 10 15 20 25 30 35 40
Cases detained per 100 cases referred, 2019
26.4
22
22
21.4
16.8
Detention
Asian
White
American
Indian
Hispanic
Black
0 5 10 15 20 25 30 35 40 45 50
Cases placed per 100 cases adjudicated, 2019
33.5
31.9
23.8
22.5
22.4
Placement
Asian
White
Black
Hispanic
American
Indian
0 5 10 15 20 25 30 35 40
Cases placed per 100 cases adjudicated, 2019
26.4
25.2
21
19.1
15.0
Placement
Male Female

Youth and the Juvenile Justice System: 2022 National Report
168
Between 1995 and 2019, the juvenile court’s formal status
offense caseload decreased 19%
What are status offenses?
Traditionally, status offenses were
those behaviors that were law viola-
tions only if committed by a person of
juvenile status. Such behaviors includ-
ed running away from home, ungov-
ernability (being beyond the control of
parents or guardians), truancy, curfew
violations, and underage drinking
(which also applies to young adults up
to age 20).
Some states have decriminalized some
of these behaviors. In these states, the
behaviors are no longer law violations.
Youth who engage in the behaviors
may be classified as dependent chil-
dren, which gives child protective ser-
vices agencies rather than juvenile
courts the primary responsibility for re-
sponding to this population.
States vary in how they respond
to status-offending behavior
The official processing of status offend-
ers varies from state to state. In some
states, for example, a runaway’s entry
into the official system may be through
juvenile court intake, while in other
states, the matter may enter through
the child welfare agency. This mixture
of approaches to case processing has
made it difficult to monitor the volume
and characteristics of status offense
cases nationally. In all states, however,
when informal efforts to resolve the
status-offending behavior fail or when
formal intervention is needed, the mat-
ter is referred to a juvenile court.
Compared with delinquency
caseloads, status offense
caseloads are small
Juvenile courts formally processed an
estimated 90,500 status offense cases
in 2019. These cases accounted for
about 11% of the court’s formal delin-
quency and status offense caseload in
2019. In 2019, juvenile courts formal-
ly processed approximately:
Q 8,200 runaway cases,
Q 55,300 truancy cases,
Q 3,800 curfew cases,
Q 7,400 ungovernability cases,
Q 7,900 status liquor law violation
cases,
Q 8,000 other status offense cases
(e.g., smoking tobacco and viola-
tions of a valid court order).
Compared with delinquency
cases, status offense cases are
less often referred by police
Law enforcement agencies referred
18% of the petitioned status offense
cases processed in juvenile courts in
2019, compared with 83% of delin-
quency cases. Law enforcement agen-
cies were more likely to be the referral
source for curfew violation cases than
for other status offense cases.
Percent of cases referred by law
enforcement:
Offense 2010 2019
Status offense 34% 18%
Running away 47 33
Truancy 4 1
Curfew 93 93
Ungovernability 36 31
Liquor 92 86
Between 1995 and 2002, the formally handled status offense caseload
increased considerably (43%) and then declined 57% through 2019
95 98 01 04 07 10 13 16 19
0
10,000
20,000
30,000
40,000
50,000
60,000
70,000
80,000
Number of petitioned cases
Truancy
Curfew
Runaway
Ungovernability
Liquor
Year
Q The degree of change in formally processed status offense cases from 1995
through 2019 varied across the major offense categories. Truancy cases increased
during the period (27%), while all other offense categories decreased; down 75%
for liquor law violations, 74% for curfew violations, and 69% each for runaway and
ungovernability cases.
Q In 2019, juvenile courts formally processed 5.3 status offense cases for every 1,000
youth age 10 through the upper age of juvenile court jurisdiction.
Source: Authors’ adaptation of Hockenberry and Puzzanchera’s
Juvenile Court Statistics 2019
.

Chapter 6: Youth in juvenile court
169
Females were involved in 4 in 10
status offense cases formally
processed in 2019
Another major difference between de-
linquency and status offense cases is
the proportion of cases that involve fe-
males. Although females were involved
in only 28% of the delinquency cases
formally processed in 2019, they were
involved in 44% of status offense cases.
Profile of formally processed cases by
gender, 2019:
Offense Male Female
Status offense 56% 44%
Runaway 45 55
Truancy 55 45
Curfew 66 34
Ungovernability 57 43
Liquor 58 42
The proportion of cases involving fe-
males varied substantially by offense. In
fact, the majority of cases processed in
court for running away from home in
2019 involved females (55%).
In 2019, youth were placed out of
the home in 6% of all status
offense cases adjudicated
Youth were adjudicated as status of-
fenders in 36% of formally processed
status offense cases in 2019. Of these
cases, 6% resulted in out-of-home
placement and 58% in formal proba-
tion. The remaining 36%, largely cur-
few violation cases, resulted in other
sanctions, such as fines, community
service, restitution, or referrals to other
agencies for services.
Among status offense cases not adjudi-
cated, 80% were dismissed, 7% resulted
in informal sanctions other than proba-
tion or out-of-home placement, 13%
resulted in informal probation, and
none resulted in out-of-home place-
ment.
For most years between 2005 and 2019, the total petitioned status
offense case rate for American Indian youth was higher than that for
youth of all other racial categories
Q In 2019, 16 was the peak age for truancy, runaway, and ungovernability case rates.
For liquor law and curfew violation cases, case rates peaked at age 17. The age-
specific case rate patterns were not substantially different for males and females.
Source: Authors’ adaptation of Hockenberry and Puzzanchera’s
Juvenile Court Statistics 2019
.
05 07 09 11 13 15 17 19
0
2
4
6
8
10
12
Year
Cases per 1,000 youth ages 10−upper age
Total status
American Indian
White
Black
Hispanic
Asian
Q Between 2005 and 2019, petitioned status offense case rates decreased for all ra-
cial groups: 51% each for Black and Asian youth, 50% for White youth, 46% for
American Indian youth, and 43% for Asian youth.
Q In 2019, the overall case rate for petitioned status offense cases was 5.1 for Ameri-
can Indian youth, 4.1 for Black youth, 3.3 for White youth, 1.3 for Hispanic youth
and 1.2 for Asian youth
Source: Authors’ adaptation of Hockenberry and Puzzanchera’s
Juvenile Court Statistics 2019
.
10 11 12 13 14 15 16 17
0.0
0.5
1.0
1.5
2.0
2.5
3.0
3.5
Age at referral
Cases per 1,000 youth in age group
Truancy
Curfew
Liquor
Ungovernability
Runaway
Case rates for most status offenses declined in the older age groups;
liquor law violation case rates, however, increased substantially through
the juvenile years

Youth and the Juvenile Justice System: 2022 National Report
170
Between 2005 to 2019, petitioned case rates decreased for all racial/ethnic groups across all status offense
categories
05 07 09 11 13 15 17 19
0.0
0.4
0.8
1.2
1.6
2.0
Year
Cases per 1,000 youth ages 10−upper age
Black
Asian
Runaway
White
Hispanic
Amer. Indian
05 07 09 11 13 15 17 19
0.0
1.0
2.0
3.0
4.0
Year
Cases per 1,000 youth ages 10−upper age
Black
Asian
Truancy
White
Hispanic
Amer. Indian
Source: Authors’ adaptation of Hockenberry and Puzzanchera’s
Juvenile Court Statistics 2019
.
05 07 09 11 13 15 17 19
0.0
0.4
0.8
1.2
1.6
Year
Cases per 1,000 youth ages 10−upper age
Black
Asian
Curfew
White
Hispanic
Amer. Indian
05 07 09 11 13 15 17 19
0.0
0.4
0.8
1.2
1.6
2.0
Year
Cases per 1,000 youth ages 10−upper age
Black
Asian
Ungovernability
White
Hispanic
Amer. Indian
05 07 09 11 13 15 17 19
0.0
1.0
2.0
3.0
4.0
Year
Cases per 1,000 youth ages 10−upper age
Black
Asian
Liquor
White
Hispanic
Amer. Indian
Q
Runaway case rates decreased for all youth between 2005
and 2019. In 2019, the runaway case rate for Black youth
was nearly 4 times the rate for White youth.
Q Truancy case rates decreased the most for Black youth be-
tween 2005 and 2019, down 23% compared with 19% for
White youth, 12% each for American Indian and Asian
youth, and 2% for Hispanic youth.
Q Curfew violation case rates in 2019 were at least 67%
lower than case rates in 2005 for all racial groups.
Q American Indian youth had the highest case rate for liquor
law violations in each year between 2005 and 2019.

Chapter 6: Youth in juvenile court
171
How were petitioned status offense cases processed in
juvenile court in 2019?
Of every 1,000 petitioned status offense cases handled in 2019, 209 resulted in formal probation and 23
resulted in residential placement following adjudication
Note: Cases are categorized by their most severe or restrictive sanction. Detail may not add to totals because of rounding.
Source: Authors’ adaptation of Hockenberry and Puzzanchera’s
Juvenile Court Statistics 2019
.
59 Placed
Adjudicated a
315 status offender 221 Pro ba tion
34 Other sanction
Not adjudicated 64 Informal sanction
685 a status offender
622 Dismissed
10 Placed
Adjudicated a
278 status offender 191 Pro ba tion
77 Other sanction
Not adjudicated 141 Informal sanction
722 a status offender
581 Dismissed
8 Placed
Adjudicated a
457 status offender 116 Pro ba tion
333 Other sanction
Not adjudicated 74 Informal sanction
543 a status offender
469 Dismissed
74 Placed
Adjudicated a
462 status offender 325 Pro ba tion
63 Other sanction
Not adjudicated 105 Informal sanction
538 a status offender
433 Dismissed
18 Placed
Adjudicated a
522 status offender 246 Pro ba tion
258 Other sanction
Not adjudicated 199 Informal sanction
478 a status offender
279 Dismissed
Of every 1,000 status offense cases referred
to juvenile court:
Of every 1,000 runaway cases referred
to juvenile court:
23 Placed
Adjudicated a
364 status offender 209 Pro ba tion
131 Other sanction
Not adjudicated 126 Informal sanction
636 a status offender
510 Dismissed
Of every 1,000 truancy cases referred
to juvenile court:
Of every 1,000 curfew violation cases referred
to juvenile court:
Of every 1,000 ungovernability cases referred
to juvenile court:
Of every 1,000 liquor law violation cases referred
to juvenile court:

Youth and the Juvenile Justice System: 2022 National Report
172
Most youth referred to juvenile court are not subsequently
referred
Official juvenile court records
can be used to understand
subsequent offending by youth
Subsequent offending can be examined
in a variety of ways, for example select-
ing youth who were disposed in a spe-
cific year or years and determining
whether they return to the system for
subsequent charges or have subsequent
guilty findings. A birth cohort sample,
i.e., examining all juvenile court refer-
rals of youth born in a given year, en-
ables an understanding of onset and
desistance that is not possible with an-
nual measures of reoffending and can
be used to clarify the onset in serious,
violent, and chronic offending by
youth.
Drawing on data from more than 900
counties from 17 states provided to
the National Juvenile Court Data Ar-
chive, Puzzanchera and Hockenberry
documented the official juvenile court
referral history of 161,057 youth born
in calendar year 2000 who had at least
one referral to juvenile court before
they aged out of juvenile court juris-
diction in their state. The prevalence
rate of juvenile court referral among
this sample was 12%, that is, of all
youth born in 2000 from the sample
counties, about 1 of every 8 youth
were referred to juvenile court at least
once before reaching the age of major-
ity in their state.
Few youth were initially referred to
juvenile court for a violent crime
About 1 in 14 (7%) youth in the co-
hort were charged with a violent of-
fense (i.e., murder, violent sexual as-
sault, robbery, and aggravated assault)
at their first referral to juvenile court;
violent sexual assault and aggravated
assault were the most common violent
crimes. Although not considered a vio-
lent crime, simple assault was by far the
most common charge among youth re-
ferred for a person offense. Youth re-
ferred for simple assault outnumbered
those referred for a violent crime by
more than 2-to-1.
Compared with youth referred for a vi-
olent crime, a larger proportion (29%)
of youth were referred for a property
offense, and larceny-theft was by far
the most common property offense.
About in 1 in 6 (17%) youth were first
referred to juvenile court for a status
offense, and truancy was most com-
mon.
Fewer than 4 in 10 youth were
referred to juvenile court more
than once
The majority of youth born in 2000
who had been referred to juvenile
court for an offense at least once be-
fore reaching the upper age of jurisdic-
tion in their state did not return on a
subsequent referral. In fact, more than
6 in 10 (63%) of the youth in this co-
hort were “one and done”—these
youth had no evidence of subsequent
contact with the juvenile court. Con-
versely, 37% were subsequently referred
to juvenile court.
Overall, males were more likely to re-
turn to court than their female peers
(40% vs. 31%, respectively), and youth
under the age of 15 at their first refer-
ral were more likely to return on a sub-
sequent referral than their older peers.
Compared with youth of all other
races, Black and American Indian
youth (43% each) were most likely to
be referred more than once, followed
by Hispanic youth (37%), Asian (35%),
and White youth (33%).
The majority of youth with two or
more referrals were male (71%). White
youth accounted for the largest pro-
portion (39%) of youth referred more
than once, followed by Black youth
(35%) and Hispanic youth (22%).
Nearly 1 in 4 (23%) youth referred
more than once were younger than age
13 at the time of their first referral,
Source: Authors’ adaptation of Hockenberry and Puzzanchera’s
Patterns of Juvenile Court Referrals of
Youth Born in 2000
.
17
16
15
Younger than 15
Asian
American Indian
Hispanic
Black
White
Female
Male
Total
0% 10% 20% 30% 40% 50%
Percent of youth rereferred
37%
40%
31%
33%
43%
37%
43%
35%
49%
36%
26%
14%
Compared with their counterparts, males, Black and American Indian
youth, and youth younger than 15 at first referral were most likely to be
rereferred to juvenile court

Chapter 6: Youth in juvenile court
173
and nearly 4 in 10 (39%) were age 13
or 14.
Characteristic
Profile of youth
rereferred
Gender 100%
Male 71
Female 29
Race/ethnicity 100%
White 39
Black 35
Hispanic 22
American Indian 2
Asian 2
Age at first referral 100%
Younger than 10 3
11 to 12 20
13 to 14 39
15 19
16 14
17 5
Older than 17 0
Note: Detail may not total 100% because of
rounding.
Rereferral rates were higher for
youth referred for specific
offenses in their first case
Overall, youth with a first referral for
motor vehicle theft or burglary had the
highest likelihood of returning to juve-
nile court (50% and 49%, respectively).
Among youth first referred for a delin-
quent offense, these two offenses had
the highest rereferral rate among males
and for all race/ethnicity groups, while
robbery and motor vehicle theft had
the highest rereferral rates among fe-
males. Among youth first referred for a
status offense, running away had the
highest rereferral rate across gender
and age groups, and for White and
American Indian youth.
Youth who were initially referred for
murder were least likely to return to
court (18%). However, this may be in
part due to sanctioning of those re-
ferred for murder; these youth may
have had less opportunity to reoffend
if they were serving time in a residen-
tial facility or were waived to criminal
court and perhaps incarcerated in an
adult prison.
Most serious offense
at first referral
Percent of
youth rereferred
Motor vehicle theft 50%
Burglary 49
Robbery 47
Running away 46
Ungovernability 46
Vandalism 42
Disorderly conduct 41
Simple assault 40
Aggravated assault 40
Arson 40
Rereferral rates varied by initial
case outcome
Returning to juvenile court on a new
referral was related to the case disposi-
tion of a youth’s first referral. Approxi-
mately half (49%) of youth who re-
ceived a formal sanction (i.e., judicially
waived to criminal court, or a sanction
resulting from being adjudicated for a
delinquency or status offense) for their
first referral were referred for a subse-
quent offense.
Of the formal sanctions available in ju-
venile court, a disposition of residential
placement following adjudication is the
most restrictive. Nearly 6 in 10 (59%)
youth who received a placement dispo-
sition returned to court again, com-
pared with 36% of youth whose first
referral was dismissed, and 34% of
youth who received an informal sanc-
tion on their first referral.
The referral histories of youth
who were rereferred were long
A juvenile court referral history is de-
fined as the number of times a youth is
referred to juvenile court before reach-
ing the upper age of juvenile jurisdic-
tion in their state. Overall, the average
history length for youth in the cohort
was 2.1 referrals, but this value is
strongly influenced by the large num-
ber of youth whose official juvenile
court referral histories ended after the
first referral. Removing those who
were “one and done” allows a better
understanding of chronicity among
youth with multiple juvenile court re-
ferrals.
Of the 59,318 youth with more than
one juvenile court referral, nearly two-
thirds (63%) recorded two or three re-
ferrals over the course of their court ,
more than one-third (37%) had histo-
ries that included four or more juvenile
court referrals, and more than one-
fourth (26%) had histories involving
five or more referrals. The impact that
chronically referred youth had on the
juvenile justice workload cannot be ig-
nored: chronically referred youth—
those with 4 or more court referrals—
accounted for 14% of the sample, but
accounted for 45% of all the cases gen-
erated by the cohort.
Most court referral histories
involved nonviolent offenses
and fewer than 4 referrals
In broad terms, the continuum of of-
fense seriousness ranges from violent
crimes (the most serious) to status of-
fenses (the least serious). For the pur-
pose of discussing the composition of
juvenile court referral histories, serious
offenses include violent crimes, as well
as the following nonviolent crimes:
burglary, larceny-theft (excluding shop-
lifting), motor vehicle theft, arson,
drug trafficking, and weapon offenses.
Nonserious offenses include a broad
range of delinquent acts, such as simple
assault, shoplifting, other drug offenses
(not trafficking), disorderly conduct,
stolen property offenses, and vandal-
ism, as well as status offenses (running
away, curfew violations, ungovernabili-
ty, liquor law violations, and truancy).
An individual’s referral history may
have many attributes: a youth may have
one or more violent referrals in the

Youth and the Juvenile Justice System: 2022 National Report
174
course of their history while also hav-
ing one or more referrals for a serious
nonviolent offense as well as four or
more total referrals in their history
(chronic). A youth may have a chronic
referral history, however, without ever
being referred for a violent or serious
nonviolent offense. Or they may be re-
ferred for one or more serious nonvio-
lent offenses but never for a violent of-
fense.
More than 6 in 10 (61%) youth in the
cohort had no serious offenses in their
referral history. In fact, the most com-
mon referral history for the cohort was
not chronic and involved no serious
offenses (58%). These histories did not
involve any referrals for violence, nor
did they include any referrals for seri-
ous nonviolent offenses, and the refer-
ral history contained fewer than four
referrals.
About 1 in 5 youth (21%) had non-
chronic histories that included at least
one referral for a serious nonviolent of-
fense and no referrals for violence. Ad-
ditionally, 6% of youth in the cohort
had four or more referrals and at least
one referral that included a serious
nonviolent offense and no referrals for
violence. This was the most common
referral history pattern for youth with
four or more referrals. Taken together,
youth with serious but no violent of-
fenses accounted for 27% of youth in
the cohort.
About 1 in 8 (12%) youth in the co-
hort had referral histories that included
at least one referral for a violent of-
fense, but only 4% of youth in the co-
hort had chronic histories—four or
more referrals—with at least one refer-
ral for a violent offense. The propor-
tion of youth who were chronically vi-
olent—youth with four or more
referrals for violent offenses—was very
small, accounting for 0.1% of youth in
the cohort.
A small proportion of youth had court referral histories that were both
chronic and violent
Violent includes those referred for the offenses of murder, robbery, violent sexual as-
sault, and aggravated assault.
Serious includes those referred for violent offenses as well as the following nonviolent
offenses: burglary, larceny-theft (excluding shoplifting), motor vehicle theft, arson, drug
trafficking, and weapons offenses.
Chronic includes those with four or more referrals to juvenile court.
The outer circle represents all officially recognized juvenile court referral histories. The
portion of the large circle not covered by the chronic, serious, and violent circles repre-
sents referral histories with fewer than four referrals and no referrals for a serious of-
fense. Overlaps represent histories with multiple attributes. The circles and their over-
laps are drawn proportional to the number of referral histories with those attributes.
Of a typical 1,000 youth in the cohort:
Q 579 had nonchronic and nonserious referral histories; these youth had fewer than
four referrals in their history, and none of their referrals involved a serious offense;
Q 137 had chronic referral histories;
Q 386 were referred at least once for a serious offense;
Q 269 were referred at least once for a serious, nonviolent offense;
Q 117 had at least one referral that included a violent offense;
Q 40 were chronic and violent;
Q 1 was chronically violent (four or more referrals for violent offenses).
Data source: Authors’ adaptation of Hockenberry and Puzzanchera’s
Patterns of Juvenile Court Refer-
rals of Youth Born in 2000
.
Cohort youth
(at least 1 referral
to juvenile court)
Serious
Violent
Chronic

Chapter 6: Youth in juvenile court
175
Sources
Hockenberry, S., and Puzzanchera, C.
2021.
Juvenile Court Statistics 2019
.
Pittsburgh, PA: National Center for
Juvenile Justice.
Hockenberry, S., and Puzzanchera, C.
Forthcoming. Patterns of Juvenile
Court Referrals of Youth Born in
2000.
National Report Series Bulletin
.
Washington, DC: Office of Juvenile
Justice and Delinquency Prevention.
Juvenile Justice and Delinquency Pre-
vention Act of 1974, Public Law 93–
415, 42 U.S.C. § 5633, as amended.
National Center for Health Statistics.
2004.
Bridged-Race Intercensal Esti-
mates of the July 1, 1990–July 1,
1999, United States Resident Popula-
tion by County, Single-Year of Age,
Sex, Race, and Hispanic Origin
[data
files]. Prepared by the U.S. Census Bu-
reau with support from the National
Cancer Institute. Available from www.
cdc.gov/nchs/nvss/bridged_race.htm
[released July 26, 2004].
National Center for Health Statistics.
2012
Intercensal Estimates of the Resi-
dent Population of the United States
for July 1, 2000–July 1, 2009, by Year,
County, Single-Year of Age, (0, 1, 2,
. . . , 85 Years and Over), Bridged
Race, Hispanic Origin, and Sex
[data
files]. Prepared under a collaborative
arrangement with the U.S. Census Bu-
reau. Available from www.cdc.gov/
nchs/nvss/bridged_race.htm as of Oc-
tober 26, 2012, following release by
the U.S. Census Bureau of the revised
unbridged intercensal estimates by
5-year age group on October 9, 2012.
National Center for Health Statistics.
2020.
Postcensal Estimates of the Resi-
dent Population of the United States
(April 1, 2010, July 1, 2010–July 1,
2019) by Year, County, Single-year of
Age (0, 1, 2, . . . , 85 Years and Over),
Bridged Race, Hispanic Origin, and
Sex (Vintage 2019)
[data files]. Pre-
pared under a collaborative arrange-
ment with the U.S. Census Bureau.
Available from cdc.gov/nchs/nvss/
bridged_race.htm as of July 9, 2020,
following release by the U.S. Census
Bureau of the unbridged vintage 2019
postcensal estimates by 5-year age
groups.
National Center for Juvenile Justice.
2020. 2019 arrest estimates, based on
data published in the Federal Bureau
of Investigation’s
Crime in the United
States 2019
. Pittsburgh, PA: NCJJ.
National Center for Juvenile Justice.
2021.
Juvenile Court Statistics 2000
Birth Cohort
[data file]. Pittsburgh,
PA: NCJJ.
National Center for Juvenile Justice.
2021.
National Juvenile Court Data
Archive: Juvenile Court Case Records
1985–2019
[data file]. Pittsburgh, PA:
NCJJ.
Office of Juvenile Justice and Delin-
quency Prevention. Juveniles in Court.
OJJDP Statistical Briefing Book
. Avail-
able from ojjdp.gov/ojstatbb/court.
Puzzanchera, C., Sladky, A., and Kang,
W. 2021.
Easy Access to Juvenile Pop-
ulations: 1990–2020
[online analysis].
Available from www.ojjdp.gov/
ojstatbb/ezapop.
Sickmund, M., Sladky, A., and Kang,
W. 2021.
Easy Access to Juvenile
Court Statistics: 1985–2019
[online
analysis]. Available from www.ojjdp.
gov/
ojstatbb/ezajcs.
U.S. Census Bureau. 1994.
1980–
1989 Preliminary Estimates of the
Pop u la tion of Counties by Age, Sex,
and Race
[data files]. Washington, DC:
U.S. Census Bureau.

Youth and the Juvenile Justice System: 2022 National Report
177
Chapter 7
Youth in corrections
7
Juvenile correctional systems have
many different components. Some ju-
venile correctional facilities look very
much like adult prisons. Others are
designed to be more home-like. Pri-
vate facilities played an important role
in the long-term residential treatment
of youth; in fact, through 2008, there
were more privately operated juvenile
facilities than publicly operated facili-
ties, although private facilities held
less than half as many youth as were
held in public facilities. That trend has
reversed, as public facilities have out-
numbered private facilities since 2010,
and nearly three-fourths of youth in
placement on a given day are held in
public facilities.
This chapter describes the population
of youth detained in and committed
to public and private facilities in terms
of demographics, offenses, average
time in the facility, and facility type.
The chapter also includes descriptions
of youth held in adult jails and prisons.
The information is based on data col-
lected by the Office of Juvenile Justice
and Delinquency Prevention: the Cen-
sus of Juveniles in Residential Place-
ment and the Juvenile Residential Fa-
cility Census. Information on youth
held in adult correctional facilities is
drawn from the Bureau of Justice Sta-
tistics’ Census of Jails, Annual Survey
of Jails, and National Prisoner Statis-
tics. Information about sexual victim-
ization experiences of youth in facili-
ties draws on the National Survey of
Youth in Custody, also conducted by
the Bureau of Justice Statistics.

Youth and the Juvenile Justice System: 2022 National Report
178
OJJDP’s data collections are the primary source of
information on youth in residential placement
Detailed data are available on
youth in residential placement
Since its inception, the Office of Juve-
nile Justice and Delinquency Preven-
tion (OJJDP) has collected informa-
tion on the youth held in juvenile
detention and correctional facilities.
Until 1995, these data were gathered
through the biennial Census of Public
and Private Juvenile Detention, Cor-
rectional, and Shelter Facilities, better
known as the Children in Custody
(CIC) Census. In the late 1990s,
OJJDP initiated two new data collec-
tion programs to gather comprehensive
and detailed information about youth
in residential placement who were
charged with or adjudicated for an of-
fense and the facilities that house them:
Q Census of Juveniles in Residential
Placement (CJRP);
Q Juvenile Residential Facility Census
(JRFC).
CJRP and JRFC are generally adminis-
tered in alternating years and collect
information from all secure and nonse-
cure residential placement facilities that
house ”juvenile offenders,” defined as
persons younger than 21 who are held
in a residential setting as a result of
some contact with the justice system
(they are charged with or adjudicated
for a delinquency or status offense).
These censuses do not include federal
facilities or those exclusively for drug
or mental health treatment or for
abused/neglected youth. They also do
not capture data from adult prisons or
jails. Therefore, CJRP and JRFC do
not include all youth sentenced to in-
carceration by criminal courts.
As used in this chapter, “youth” refers
to persons under 21 in residential
placement who were charged with or
adjudicated for a law violation.
The term resident refers to all persons
(i.e., those held for an offense, those
held for nonoffense reasons, and some
adults) in a facility on the reference
date. The resident count is used when
discussing facility size and crowding, as
these are characteristics related to all
persons in the facility.
CJRP typically takes place on the
fourth Wednesday in October of the
census year. However, the census col-
lections that would have occurred Oc-
tober 26, 2005 and October 28, 2009,
were both postponed until the fourth
Wednesday in February of the follow-
ing year. CJRP asks all juvenile residen-
tial facilities in the U.S. to describe
each youth under age 21 assigned a
bed in the facility on the census date.
Facilities report individual-level infor-
mation on gender, date of birth, race,
placement authority, most serious of-
fense charged, court adjudication sta-
tus, admission date, and security status.
JRFC also uses the fourth Wednesday
in October as its census date and, in
addition to information gathered on
the census date, it includes some infor-
mation about the past month and past
year. JRFC collects information on
how facilities operate and the services
they provide. It includes detailed ques-
tions on facility security, capacity and
crowding, injuries and deaths in place-
ment, and facility ownership and oper-
ation. Supplementary information is
also collected in various years on spe-
cific services, such as mental and physi-
cal health, substance abuse, and educa-
tion.
One-day count and admission
data give different views of
residential populations
CJRP provides a one-day population
count of juveniles in residential place-
ment facilities. Such counts give a pic-
ture of the standing population in facil-
ities. One-day counts are substantially
different from annual admission or re-
lease data, which provide a measure of
facility population flow.
Youth may be committed to a facility
as part of a court-ordered disposition,
or they may be detained prior to adju-
dication or after adjudication while
awaiting disposition or placement else-
where. In addition, a small proportion
of youth are admitted voluntarily in
lieu of adjudication as part of a diver-
sion agreement. Because detention
stays tend to be short compared with
commitment placements, detained
youth represent a much larger share of
population flow data than of one-day
count data.
State variations in upper age of
juvenile court jurisdiction influence
placement rates
Although state placement rate statistics
control for upper age of original juve-
nile court jurisdiction, comparisons
among states with different upper ages
are problematic. Youth ages 16 and 17
constitute 25% of the youth population
ages 10–17, but they account for more
than 49% of arrests of youth under age
18, more than 40% of delinquency
court cases, and more than 50% of
youth in residential placement. If all
other factors were equal, one would
expect higher residential placement
rates in states where older youth are
under juvenile court jurisdiction.
Differing age limits of extended juris-
diction also influence placement rates.
Some states may keep a youth in place-
ment for several years beyond the
upper age of original jurisdiction; oth-
ers cannot. Laws that control the trans-
fer of juveniles to criminal court also
have an impact on juvenile placement
rates. If all other factors were equal,
states with broad transfer provisions
would be expected to have lower juve-
nile placement rates than other states.
Demographic variations among juris-
dictions should also be considered.
The urbanicity and economy of an area
are thought to be related to crime and
placement rates. Available bedspace

Chapter 7: Youth in corrections
179
also influences placement rates, partic-
ularly in rural areas. Both CJRP and
JRFC asks respondents to indicate the
operation status of the facility as well as
to classify what type of facility they are.
Operation status options include:
Q Public: operated by State or local
(county or municipality) govern-
ment agencies in which the employ-
ees working daily in the facilities and
directly with the residents are state
or local government employees.
Q Private: operated by private non-
profit or for-profit corporations or
organizations in which the employ-
ees working daily in the facilities and
directly with the residents are
employees of that private corpora-
tion or organization.
Facility classification is a self-identified
question in both collections and re-
spondents are able to select more than
one classification type. The classifica-
tion types include:
Q Detention center: a short-term
facility that provides temporary care
in a physically restricting environ-
ment for juveniles in custody pend-
ing court disposition and, often, for
youth who are adjudicated delin-
quent and awaiting disposition or
placement elsewhere, or are awaiting
transfer to another jurisdiction. In
some jurisdictions, detention centers
may also hold youth committed for
short periods of time as part of their
disposition (e.g., weekend deten-
tion).
Q Training school/long-term secure
facility: a specialized type of facility
that provides strict confinement and
long-term treatment generally for
post-adjudication committed juve-
nile offenders. Includes training
schools, juvenile correctional facili-
ties, and youth development centers.
Q Reception or diagnostic center: a
short-term facility that screens juve-
nile offenders committed by the
courts and assigns them to appropri-
ate correctional facilities.
Q Group home/halfway house: a
long-term facility that is generally
non-secure and intended for post-
adjudication commitments in which
young persons are allowed extensive
contact with the community, such as
attending school or holding a job.
Q Residential treatment center: a
facility that focuses on providing
some type of individually planned
treatment program for youth (sub-
stance abuse, sex offenders, mental
health, etc.) in conjunction with res-
idential care. Such facilities generally
require specific licensing by the state
that may require that treatment pro-
vided is Medicaid-reimbursable.
Q Ranch, forestry camp, wilderness
or marine program or farm: long-
term generally nonsecure residential
facilities often located in a relatively
remote area. The juveniles partici-
pate in a structured program that
emphasizes outdoor work, including
conservation and related activities.
Q Runaway and homeless shelter: a
short-term facility that provides
temporary care in a physically unre-
stricted environment. It can also
provide longer-term care under a
juvenile court disposition order.

Youth and the Juvenile Justice System: 2022 National Report
180
The number of youth in residential placement declined
considerably between 1997 and 2019
The number of youth in placement
peaked in 2000 and has since
declined
The number of youth in placement in-
creased 4% from 1997 (105,055) to
the 2000 peak (108,802) and then de-
creased 66% to the lowest level
(36,479) in 2019. The relative decline
in the number of youth in state and
privately operated facilities was about
the same (73% and 71%, respectively)
between 2000 and 2019, while the
number of youth in locally operated fa-
cilities fell 52%. As a result, a larger
proportion of youth in 2019 were in
locally operated facilities (39%) than
were in state operated facilities (35%)
or privately operated facilities (26%).
The number of facilities also
reached a new low in 2019
After a period of increase through
2000, the number of facilities fell con-
siderably. By 2019, the number of fa-
cilities was half the number of the
Several factors may affect the
placement population
Residential placement data cannot
explain the continuing decline in the
number of youth held in placement
for an offense, however they may
reflect a combination of contributing
factors. For example, the number of
arrests involving youth decreased
58% between 2010 and 2019,
which in turn means that fewer
youth were processed through the
juvenile justice system. Additionally
residential placement reform efforts
have resulted in the movement of
many youth from large, secure pub-
lic facilities to less secure, small pri-
vate facilities. Finally, budgetary
factors have resulted in a shift from
committing youth to high-cost resi-
dential facilities to providing lower
cost options, such as probation,
day treatment, or community-based
sanctions.
0
20,000
40,000
60,000
80,000
100,000
120,000
Youth in residential placement
97 99 00 01 02 03 04 06 07 08 10 11 12 13 14 15 16 17 18 19
Census year
Compared with 1997, youth in 2019 were more likely to be held in
locally operated facilities than in state or privately operated facilities
Q The proportion of youth held in locally operated facilities increased from 28% in
1997 to 39% in 2019. During the same period, the proportion of youth in state
operated facilities declined from 44% to 35%.
Q Nearly three-quarters of youth were held in public facilities (i.e., state or locally
operated) in 2019, and more than half (53%) of these youth were in local facilities.
Source: Authors’ analysis of OJJDP’s
Census of Juveniles in Residential Placement
and
Juvenile Resi-
dential Facility Census
for 1997 through 2019.
0%
20%
40%
60%
80%
100%
Percent of youth in placement
State Local PrivateFacility operation:
97 99 00 01 02 03 04 06 07 08 10 11 12 13 14 15 16 17 18 19
Census year
The number of youth in placement in 2019 was one-third that of the
2000 peak
Q The number of youth in placement was cut in half between 2000 and 2013, then
fell 33% through 2019.
Source: Authors’ analysis of OJJDP’s
Census of Juveniles in Residential Placement
and
Juvenile Resi-
dential Facility Census
for 1997 through 2019.

Chapter 7: Youth in corrections
181
Local facilities held more youth
than state or private facilities
Private facilities have outnumbered
local facilities since 1997, and through
the mid-2000s, private facilities held
more youth than local facilities. How-
ever, given the disproportionate de-
cline in the number of private facilities
and the youth they hold, by 2019,
more youth were held in local facilities,
and the number of local facilities was
about the same as private facilities.
Operation profile:
Facility
operation
Facilities Youth
1997 2019 1997 2019
Total 100% 100% 100% 100%
Public 39 60 72 74
State 18 22 44 35
Local 21 38 28 39
Private 61 40 28 26
Note: Detail may not total 100% because of
rounding.
The decrease in facilities varied by
facility type
Since 2003, all facility types experi-
enced declines in the number of facili-
ties and the number of youth held, but
the declines varied by type of facility.
Detention centers outnumbered and
held more youth than other facility
types, but the relative decline in the
number of such facilities (17%) and
youth held (51%) was less than other
facility types. For example, the number
of residential treatment centers (RTC),
introduced to the collections in 2003,
fell 37% by 2019, and the number of
youth in RTCs fell 56%, while the
number of training schools and youth
held in such facilities declined 37% and
71%, respectively.
Percent change, 2003–2019:
Facility type Facilities Youth
Detention center –17% –51%
Residential treatment center
–37 –56
Group home –72 –62
Training school –37 –71
Shelter –52 –56
Ranch/forestry camp –78 –84
Reception/diagnostic center
–79 –84
0
500
1,000
1,500
2,000
2,500
3,000
3,500
Number of facilities
97 99 00 01 02 03 04 06 07 08 10 11 12 13 14 15 16 17 18 19
Census year
The proportion of locally operated facilities increased steadily since
2000, while the proportion of privately operated facilities decreased
Q Since 2000, the proportion of facilities that were locally operated increased from 22%
to 38%, while the proportion that were privately operated fell from 61% to 40%.
Source: Authors’ analysis of OJJDP’s
Census of Juveniles in Residential Placement
and
Juvenile Resi-
dential Facility Census
for 1997 through 2019.
0%
20%
40%
60%
80%
100%
Percent of facilities
State Local PrivateFacility operation:
97 99 00 01 02 03 04 06 07 08 10 11 12 13 14 15 16 17 18 19
Census year
The number of residential placement facilities declined 50% between
2000 and 2019
Source: Authors’ analysis of OJJDP’s
Census of Juveniles in Residential Placement
and
Juvenile Resi-
dential Facility Census
for 1997 through 2019.
2000 peak. Most of the decline was as-
sociated with private facilities, which
declined 67% since 2000, compared
with a 24% decline for public facilities.
Among public facilities, the decline was
greater for state-operated (38%) than
for locally operated (14%) facilities. As
a result, public facilities have outnum-
bered private facilities each year since
2011.

Youth and the Juvenile Justice System: 2022 National Report
182
The number of youth held in large facilities—those with more
than 100 residents—has declined
Fewer youth were held in large
facilities in 2019 than in 1997
Facility size is based on the number of
residents assigned a bed on the census
reference date. Small facilities hold be-
tween 1 and 20 residents, medium fa-
cilities hold between 21 and 100 resi-
dents, and large facilities hold more
than 100 residents.
The number of large facilities fell 74%
since 1997, and the number of youth
in large facilities fell 85%. During the
same period, the number of small facil-
ities declined 46%, the number of me-
dium facilities fell 39%, and the num-
ber of youth in small and medium
facilities experienced the same relative
decline (42% each).
Percent change, 1997–2019:
Facility size Facilities Youth
Small –46% –42%
Medium –39 –42
Large –74 –85
The net result of these changes was
that, by 2019, large facilities accounted
for a smaller share of facilities than in
1997 (4% vs. 9%), while medium facili-
ties accounted for a larger share (37%
vs. 33%). Similarly, a larger proportion
of youth were held in medium size fa-
cilities (55%) than in large facilities
(24%) in 2019, reversing the pattern
that prevailed through 2007. Small fa-
cilities accounted for about the same
proportion of facilities in 2019 as in
1997 (59%), but the proportion of
youth in small facilities increased from
12% in 1997 to 21% in 2019.
0%
20%
40%
60%
80%
100%
Percent of youth in residential placement
Small Medium LargeFacility size:
97 99 00 01 02 03 04 06 07 08 10 11 12 13 14 15 16 17 18 19
Census year
Small facilities outnumber medium and large facilities
Q The proportion of large facilities decreased steadily since 2007, falling to 4% in
2019. Medium facilities accounted for 33% of facilities in 1997, increased to 40% in
2016, then fell to 37% in 2019. While the proportion of small facilities changed little
during this period, small facilities accounted for more than half of all facilities each
year since 1997.
Source: Authors’ analysis of OJJDP’s
Census of Juveniles in Residential Placement
and
Juvenile Resi-
dential Facility Census
for 1997 through 2019.
0%
20%
40%
60%
80%
100%
Percent of facilities
Small Medium LargeFacility size:
97 99 00 01 02 03 04 06 07 08 10 11 12 13 14 15 16 17 18 19
Census year
More youth were held in large facilities than medium facilities through
2007, but that pattern has since reversed
Q The proportion of youth in large facilities has declined steadily. In 1997, more than
half (54%) of all youth were in large facilities; by 2019, about one-fourth (24%) of all
youth were in large facilities. Conversely, the proportion of youth in medium facili-
ties has increased steadily. By 2008, more youth were held in medium facilities than
in large facilities, a pattern that persisted through 2019.
Q The proportion of youth held in small facilities was relatively stable through the mid-
2000s but has since increased. By 2019, one-fifth (21%) of youth were held in small
facilities.

Chapter 7: Youth in corrections
183
The characteristics of the placement population varied by
placement setting, offense, and youth demographics
Offense profiles varied based on
where a youth was held
State or local government agencies op-
erate public facilities. Private facilities
include nonprofit and for-profit corpo-
rations and organizations. In general,
private facilities are smaller than public
facilities and tend to hold youth with
less serious offenses. Therefore, private
facilities house slightly different popu-
lations than public facilities. In 2019,
youth held for a person offense ac-
counted for the largest share of youth
held in state, locally and privately oper-
ated facilities; youth held for a status
offense accounted for a relatively larger
proportion of youth in private facilities
than state or local facilities. Local facili-
ties had a larger share of youth held for
technical violations than either state or
private facilities.
Females accounted for 15% of the residential placement population in 2019, youth ages 15–17 accounted
for 71%, and Black youth accounted for 41%
Number of
youth in
placement,
2019
Percent of youth in residential placement, 2019
Most serious
offense Female
Younger
than 15
Ages
15–17 White Black Hispanic
American
Indian Asian
Two or
more
Total 36,479 15% 15% 71% 33% 41% 20% 2% 1% 2%
Person 15,823 13 15 68 30 44 21 2 1 2
Criminal homicide 941 9 6 69 20 46 29 2 1 2
Sexual assault 2,362 1 18 59 55 25 16 2 1 2
Robbery 4,131 6 8 71 11 62 23 1 2 2
Aggravated assault 3,427 14 14 69 24 46 25 2 1 2
Simple assault 3,067 27 24 68 40 34 19 3 1 3
Other person 1,895 16 18 70 40 38 17 2 1 3
Property 7,503 13 16 73 32 45 17 2 1 2
Burglary 2,540 7 17 70 29 50 15 2 1 2
Theft 1,576 17 16 74 34 49 11 2 1 2
Auto theft 1,782 16 15 76 29 43 22 2 1 3
Arson 204 10 25 63 50 31 12 3 1 3
Other property 1,401 17 17 74 39 37 19 2 1 3
Drug 1,589 19 10 75 46 25 23 2 1 3
Drug trafficking 269 9 8 72 32 37 27 2 0 2
Other drug 1,320 21 10 76 49 23 22 2 1 3
Public order 5,077 10 15 71 34 40 21 2 1 2
Weapons offense 2,087 4 9 77 17 54 25 1 1 2
Other public order 2,990 14 19 66 46 31 18 2 1 2
Technical violation 5,063 22 15 74 33 36 25 2 1 3
Status offense 1,424 34 24 71 59 23 9 2 1 4
Q Females accounted for a relatively larger share of youth held for a status offense (34%) or for simple assault (27%) than for
other offenses.
Q Across offenses, youth ages 15-17 accounted for the majority of youth in placement. However, youth younger than age 15
accounted for a relatively large share of youth held for simple assault (24%), arson (25%), or a status offense (24%).
Q White youth accounted for half or more of youth held for sexual assault, arson, or a status offense, while Black youth ac-
counted for at least half of all youth held for robbery, burglary, or a weapons offense.
Notes: Racial categories (i.e., White, Black, American Indian, and Asian) do not include youth of Hispanic ethnicity. The American Indian racial category
includes Alaska Natives; the Asian racial category includes Native Hawaiians and Other Pacific Islanders. Totals include persons of unspecified race. De-
tail may not add to totals because of rounding.
Source: Authors’ analysis of OJJDP’s
Census of Juveniles in Residential Placement, 2019
[data file].
Offense profile, 2019:
Facility operation
Offense State Local Private
Total 100% 100% 100%
Person 51 41 36
Property 22 18 21
Drugs 3 4 6
Public order 13 14 15
Technical violation 9 21 11
Status offense 1 2 11
Note: Detail may not total 100% because of
rounding.

Youth and the Juvenile Justice: 2022 National Report
184
The majority of youth were in
medium-sized facilities
More than half (55%) of all youth in
placement in 2019 were in a medium-
sized facility (21–100 residents), about
one-fifth (21%) were in a small facility
(20 or fewer residents), and one-fourth
(24%) were in a large facility (more
than 100 residents). However, the
placement setting varied by offense.
For example, youth held for a status
offense were more likely to be in a
small facility (35%) than those held for
a delinquency offense (20%), and
youth held for a delinquency offense
were more likely to be in a medium-
sized facility (56%) than those held for
a status offense (44%).
Facility size profile, 2019:
Facility
size
Offense
Total Delinquency Status
Total 100% 100% 100%
Small 21 20 35
Medium 55 56 44
Large 24 24 21
Note: Detail may not total 100% because of
rounding.
Most youth held for a status
offense were in private facilities
Youth held for a status offense account
for a small proportion of the overall
placement population—4% in 2019.
The overwhelming majority (72%) of
these youth were in privately-operated
facilities. Comparatively, 76% of youth
held for a delinquency offense were in
a publicly operated facility.
Facility operation profile, 2019:
Facility operation
Offense Total Public Private
Total 100% 74% 26%
Delinquency 100 76 24
Person 100 78 22
Property 100 73 27
Drugs 100 64 36
Public order 100 72 28
Tech. violation 100 80 20
Status offense 100 28 72
More than half (55%) of youth held for
a status offense in 2019 were in resi-
dential treatment centers, and more
than one-third (36%) were in group
homes.
Detention centers held 40% of youth in placement on October 23, 2019
Percent of youth in residential placement, 2019
Most serious offense Total
Detention
center Shelter
Group
home
Residential
treatment
center
Training
school Other*
Total 100% 40% 2% 7% 23% 26% 3%
Person 100 40 1 7 19 31 2
Property 100 38 1 7 24 26 4
Drugs 100 34 2 7 34 18 5
Public order 100 39 1 7 27 23 3
Technical violation 100 53 2 4 17 21 3
Status offense 100 12 8 30 45 2 3
Q More than half of youth in placement for a technical violation were in a detention center.
Q Residential treatment centers and group homes were the most common placement setting for youth held for a status offense.
*Includes reception/diagnostic centers and ranch/wilderness camps.
Source: Authors’ analysis of OJJDP’s
Census of Juveniles in Residential Placement, 2019
[data file].

Chapter 7: Youth in corrections
185
In 2019, there were 36,749 youth in residential placement—
114 for every 100,000 youth in the U.S. population
The national residential placement rate fell 49% between 2010 and 2019; across states, placement rates in
2019 were lower than in 2010 for all but one state
Youth in
placement,
2019
Placement rate
per 100,000
Percent
change
Youth in
placement,
2019
Placement rate
per 100,000
Percent
changeState 2010 2019 State 2010 2019
U.S. total 36,479 225 114
–49%
Missouri 588 214 108
–50%
Alabama 798 212 161
–24
Montana 138 192 133
–31
Alaska 255 342 330
–4
Nebraska 309 378 145
–62
Arizona 606 152 80
–47
Nevada 546 244 174
–29
Arkansas 465 230 146
–37
New Hampshire 24 97 20
–79
California 4,131 272 102
–63
New Jersey 513 123 58
–53
Colorado 753 286 130
–55
New Mexico 270 250 122
–51
Connecticut 96 93 27
–71
New York 837 180 54
–70
Delaware 129 270 139
–49
North Carolina 744 112 93
–17
Dist. of Columbia 117 430 262
–39
North Dakota 78 258 104
–60
Florida 2,001 261 104
–60
Ohio 1,746 227 148
–35
Georgia 1,119 220 110
–50
Oklahoma 345 157 80
–49
Hawaii 63 90 49
–46
Oregon 651 320 164
–49
Idaho 342 257 164
–36
Pennsylvania 1,566 317 129
–59
Illinois 834 178 64
–64
Rhode Island 108 236 114
–52
Indiana 1,155 276 161
–42
South Carolina 633 235 141
–40
Iowa 441 227 133
–41
South Dakota 171 575 180
–69
Kansas 360 264 113
–57
Tennessee 345 117 50
–57
Kentucky 588 186 130
–30
Texas 3,699 203 126
–38
Louisiana 693 239 143
–40
Utah 246 190 58
–69
Maine 60 143 51
–64
Vermont 18 53 33
–38
Maryland 495 143 82
–43
Virginia 918 224 109
–51
Massachusetts 288 115 46
–60
Washington 693 183 94
–49
Michigan 1,353 208 157
–25
West Virginia 483 317 291
–8
Minnesota 948 159 161
1
Wisconsin 477 209 93
–56
Mississippi 198 106 61
–42
Wyoming 147 440 239
–46
Notes: Placement rate is the number of youth in placement per 100,000 youth ages 10 through the upper age of juvenile court jurisdiction in each state.
U.S. totals include 2,567 youth in placement in 2010 and 1,895 youth in placement in 2019 for whom state of offense was not reported.
Source: Authors’ analysis of OJJDP’s
Census of Juveniles in Residential Placement
for 2010 and 2019 [data files].
DC
20 to 64
65 to 114
115 to 150
151 to 330
Placement rate, 2019

Youth and the Juvenile Justice System: 2022 National Report
186
Between 1997 and 2019, the decline in the committed
population outpaced that of the detained population
CJRP documents the placement
status of youth
Some youth are held in residential
placement for detention purposes (e.g.,
youth awaiting an adjudicatory or dis-
position hearing in juvenile or criminal
court) and those held after disposition
while awaiting placement elsewhere.
Other youth are committed to a facility
as part of a court-ordered sanction. In
2019, detained youth accounted for
39% of the placement population and
committed youth accounted for 58%.
Offense profiles were similar for
detained and committed youth
Youth held for a delinquency offense
accounted for 98% of the detained
population and 95% of the committed
population. Youth held for a status of-
fense accounted for 5% of the commit-
ted population and 2% of the detained
population.
Offense profile of youth in placement,
2019:
Most serious
offense
Detained
(14,344)
Committed
(21,141)
Total 100% 100%
Delinquency 98 95
Person 45 43
Criminal homicide 4 2
Sexual assault 4 8
Robbery 12 11
Aggravated assault 11 8
Simple assault 8 8
Other person 5 5
Property 20 21
Burglary 6 7
Theft 4 4
Auto theft 5 5
Arson 1 1
Other property 4 4
Drug 3 5
Drug trafficking 1 1
Other drug 3 4
Public order 13 14
Weapons 7 5
Other public order 6 9
Technical violation 16 12
Status offense 2 5
Note: Detail may not add to totals because of
rounding.
99 11 15 19
0
10,000
20,000
30,000
Census year
Number of youth
Detained
03 07
99 11 15 19
0
20,000
40,000
60,000
80,000
Census year
Number of youth
Committed
03 07
Between 1997 and 2019, the detained population decreased 47% and
the committed population fell 72%
Q Most of the decline in the number of youth detained took place between 2007 and
2019, during which time the population of youth in residential placement declined
42%, while the committed population declined consistently since 2001.
Q Committed youth account for a larger share of the overall placement population
than detained youth, but their share declined from 72% in 1997 to 58% in 2019,
while detained youth accounted for a larger share in 2019 (39%) than in 1997 (27%).
Source: Authors’ analysis of OJJDP’s
Census of Juveniles in Residential Placement
for 1997 through
2019 [data files].
Detained and committed youth
were held in different types of
facilities
In 2019, 81% of detained youth were
held in detention centers, 9% were in
long-term secure facilities, and 6% were
in residential treatment centers.
Among committed youth, 38% were
held in long-term secure facilities, and
33% were in residential treatment cen-
ters. Group homes and detention cen-
ters each held 11% of committed
youth.
99 11 15 19
0%
20%
40%
60%
80%
100%
Census year
State Local Private
Percent of detained youth
03 07
99
0%
20%
40%
60%
80%
100%
Percent of committed youth
11 15 19
Census year
State Local Private
03 07
Most detained youth were held in locally operated facilities while most
committed youth were in state operated facilities
Q The overwhelming majority of detained youth were held in locally operated facilities.
In a typical year between 1997 and 2019, 70% of youth in detention were held in a
locally operated facility.
Q The number of committed youth held in state facilities fell 78% between 1997 and
2019, compared with 69% for those in private facilities and 56% for those in local
facilities. As a result, a smaller proportion of committed youth were in state operat-
ed facilities in 2019 (43%) than in 1997 (54%).
Source: Authors’ analysis of OJJDP’s
Census of Juveniles in Residential Placement
for 1997 through
2019 [data files].

Chapter 7: Youth in corrections
187
Commitment rates declined between 2010 and 2019 for all but four states, while detention rates declined
for all but eight states
Rate per 100,000 Rate per 100,000
Detained
Committed
Detained
Committed
State
2010
2019 2010
2019
State
2010
2019 2010
2019
U.S. total 65 45 154 66 Missouri 41 27 170 81
Alabama 52 62
†
159 90 Montana 51 43 138 58
Alaska 124 85 211 241 Nebraska 106 58 269 85
†
Arizona 51 42 96 36 Nevada 80 56 163 108
Arkansas 47 45 182 101
†
New Hampshire
7* 5* 70 10
California 116 50
†
155 51
†
New Jersey 57 24 65 33
†
Colorado 74 44 200 85 New Mexico 72 68 176 53
Connecticut 38 17 54 9 New York 35
†
20 143 33
Delaware 106 71 164 68 North Carolina 22 17 68 74
Dist. of Columbia
222 195 208 67 North Dakota 28 16 230 84
Florida 48 28 211 66 Ohio 75 63 152 83
Georgia 48 60 102 50 Oklahoma 64 59 91 20
Hawaii 20 23 63 23 Oregon 38 14
†
281 147
Idaho 77 37 179 109 Pennsylvania 43 29 254 99
Illinois 52 39 123
†
24
†
Rhode Island 3* 22 201 76
Indiana 76 46
†
199 109 South Carolina 78 67 157 71
Iowa 41 48 182 75 South Dakota 123
†
101 432 76
Kansas 93 58 169 55 Tennessee 28 38
†
88 12
Kentucky 63 52 120 73 Texas 72 59 129 67
Louisiana 77 54 159 88 Utah 55 17 135 39
Maine 12 0* 127 28 Vermont 19
†
6* 10*
†
11*
Maryland 71 48 66 33 Virginia 76 56 144 52
Massachusetts 34 20 79 22 Washington 56 28 126 63
Michigan 57 43 151 110 West Virginia 164 115 152 170
Minnesota 37 82
†
119 67 Wisconsin 39 25 168 61
Mississippi 51 26 54 30 Wyoming 31 34 409 205
†
Interpret data with caution. In these states, 30% or more of the information for placement status (i.e., detained or committed) was imputed.
*Rate is based on fewer than 10 youth.
Notes: Rate is the number of detained or committed youth in placement per 100,000 youth ages 10 through the upper age of juvenile court jurisdiction in
each state. U.S. totals include 493 detained youth and 1,359 committed youth for whom state of offense was not reported.
Source: Authors’ analysis of OJJDP’s
Census of Juveniles in Residential Placement
for 2010 and 2019 [data files].
DC
0 to 24
25 to 45
46 to 59
60 to 195
9 to 33
34 to 66
67 to 85
86 to 241
DC
Detained rate, 2019 Committed rate, 2019

Youth and the Juvenile Justice System: 2022 National Report
188
In four states, the proportion of youth detained for a technical
violation exceeded the proportion detained for a person offense
The percent of youth detained for a person offense ranged from a low of 19% in Arizona to a high of 64% in
Georgia
Offense profile of detained youth, 2019 Offense profile of detained youth, 2019
State
Person Property
Drugs
Public
order
Technical
violation
Status
State
Person Property
Drugs
Public
order
Technical
violation
Status
U.S. total 45% 20% 3% 13% 16% 2% Missouri 47% 29% 2% 10% 10% 2%
Alabama 36
†
27
†
4
†
15
†
17
†
1 Montana* 40 20 7 0 33 0
Alaska* 36 23 5
†
923 5
†
Nebraska 37 17 7 17 22 0
Arizona 19 19 10 10 39 0 Nevada 27 17 12 17 25 2
Arkansas 40
†
21
†
4
†
6
†
27
†
0
New Hampshire
––––––
California 53
†
15
†
11120
†
0 New Jersey 51 8 3 14 24 0
Colorado 52 23
†
2
†
19
†
2
†
1 New Mexico 30 8 4 12 44 2
Connecticut* 40 40 0 5 10 0 New York 60 19 5 8 7 1
Delaware* 45 18 0 27 5 0 North Carolina 41 37 2 11 4 7
Dist. of Columbia*
62 21 0 17 0 0 North Dakota – – – – – –
Florida 40 30 3 16 10 1
†
Ohio 50 16 2 15 15 2
Georgia 64 27 1 7 0 0 Oklahoma 49 22 4 11 13 0
Hawaii* 40 20 0 0 40 0 Oregon* 21 16
†
011
†
53
†
0
Idaho* 38 23 15 12 4 4 Pennsylvania 36 18 7 11 27 1
Illinois 36 19 3 31 12 0 Rhode Island* 29 29 0 43 0 0
Indiana 38
†
21
†
3
†
16
†
15
†
7 South Carolina 33 22 1
†
16 23 5
Iowa 49 28 9 9 4
†
0 South Dakota* 44 25 3 9
†
19 3
†
Kansas 56 18 3 †8 10 6 Tennessee 57
†
14
†
211 11
†
2
Kentucky 54 13
†
1 19 5 8 Texas 42 16 6
†
14 22
†
0
Louisiana 38 30 2
†
8 17 6 Utah* 29 25 0 13 33 0
Maine – – – – – – Vermont – – – – – –
Maryland 44 22 7 9 15 1 Virginia 42 20
†
2
†
14 19 3
†
Massachusetts 57 17 5 19 2 0 Washington 59 16 1 12 10 1
Michigan 42 20 2 12 21 4 West Virginia 47 27 2 9 2
†
14
Minnesota 41
†
23
†
3
†
14
†
18
†
3
†
Wisconsin 40 28 2 23 2 2
†
Mississippi* 39 25 4 18 11 4 Wyoming* 29 14 14 14 14 14
Q
The proportion of youth detained for a technical viola-
tion of probation or parole or a violation of a valid
court order was less than 40% in each state except
Hawaii (40%), New Mexico (44%), and Oregon (53%).
Q Youth held for a status offense accounted for less
than 10% of the detained population in all states but
West Virginia and Wyoming.
– Too few youth (fewer than 20) to calculate a reliable percentage.
*Percents in this state are based on a small denominator (fewer
than 100, but at least 20 youth).
†
Interpret data with caution. In these states, 30% or more of the in-
formation for offense and/or placement status (i.e., detained or
committed) was imputed.
Notes: U.S. totals include 493 detained youth for whom state of of-
fense was not reported.
Source: Authors’ analysis of OJJDP’s
Census of Juveniles in Residential Placement, 2019
[data file].
DC
21% to 36%
37% to 45%
46% to 49%
50% to 64%
Not calculated
Percent of detained youth held for person offenses, 2019

Chapter 7: Youth in corrections
189
Youth held for a person offense accounted for 50% or more
of the committed population in 13 states and DC
The percent of youth committed for a person offense ranged from a low of 18% in Mississippi to a high of
79% in Kansas
Offense profile of committed youth, 2019 Offense profile of committed youth, 2019
State
Person Property
Drugs
Public
order
Technical
violation
Status
State
Person Property
Drugs
Public
order
Technical
violation
Status
U.S. total 43% 21% 5% 14% 12% 5% Missouri 32% 31% 4% 16% 8% 7%
Alabama 33 26 6 11 16 7 Montana* 45 25 10 15
†
50
Alaska 42 27 3
†
13 15 3
†
Nebraska 38
†
18
†
8
†
13
†
12
†
10
†
Arizona 27 29 10 23 12 0 Nevada 29 16 12 23 19 1
†
Arkansas 31
†
22
†
715
†
22
†
2
New Hampshire
––––––
California 37
†
16
†
4
†
16
†
26
†
1
†
New Jersey 60
†
10
†
10
†
15
†
40
Colorado 54 24 4 16 1
†
0 New Mexico 38 10 0 5 44 3
†
Connecticut* 36 45 0 9 9 0 New York 35 27 1 10 11 18
Delaware* 38 24 0 29 10 0 North Carolina 39 30 3
†
11 15 1
†
Dist. of Columbia*
60 10
†
020
†
0 0 North Dakota* 38 19 19 24 0 0
Florida 34 39 4 11 12
†
0 Ohio 53 18 3 13 10 3
Georgia 65 21 1 7 0 6 Oklahoma* 52 31 7
†
730
Hawaii* 50 20 10 10 10 0 Oregon 58 22 4 14 2 1
Idaho 30 30 11 26 4 0 Pennsylvania 38 14 10 17 12 11
Illinois 47
†
20
†
6
†
11
†
13
†
4
†
Rhode Island* 42 21 0 17 13 13
Indiana 39 18 12 19 8 4 South Carolina 30 21 3 10 34 2
Iowa 46 31 6 14 2
†
1
†
South Dakota* 50 17 8 17
†
8
†
4
Kansas 79 10 3 5 3 0 Tennessee* 18 11 7
†
54 4 7
Kentucky 29 11 5
†
15 3 37
†
Texas 57 17 3 10 11
†
2
†
Louisiana 46 32 2 11 3 6 Utah 44 29 2 22 0 5
†
Maine* 55 45 0 0 0 0 Vermont – – – – – –
Maryland 33 19 4
†
18
†
25
†
1
†
Virginia 59 19 2 7 10 3
Massachusetts 49 13 4 31 0 2 Washington 65 18 2 4 12 0
Michigan 40 18 5
†
14 14 9 West Virginia 34 17 6 10 6 28
Minnesota 44 19 2
†
24 8
†
3 Wisconsin 50 29 2
†
16 0 3
†
Mississippi* 18 61 12 3 9 3 Wyoming 19 24 19 12 17 7
Q
In 13 states, the proportion of youth committed for a
technical violation of probation or parole, or a violation
of a valid court order exceeded the national level
(12%).
Q Youth held for a status offense accounted for less than
5%
of the committed population in 34 states and the Dis-
trict of Columbia.
– Too few youth (fewer than 20) to calculate a reliable percentage.
*Percents in this state are based on a small denominator (fewer than
100, but at least 20 youth).
†
Interpret data with caution. In these states, 30% or more of the in-
formation for offense or placement status (i.e., detained or commit-
ted) was imputed.
Notes: U.S. totals include 1,359 committed youth for whom state of
offense was not reported.
Source: Authors’ analysis of OJJDP’s
Census of Juveniles in Residential Placement, 2019
[data file].
18% to 33%
34% to 43%
44% to 50%
51% to 79%
Not calculated
DC
Percent of committed youth held for person offenses, 2019

Youth and the Juvenile Justice System: 2022 National Report
190
The proportion of youth in placement for a person offense
has increased
More than 40% of youth were in
residential placement for a person
offense
In any given year, youth held for a per-
son offense accounted for the largest
share of the placement population. For
example, in 1999, the year in which
the CJRP population reached its peak,
35% of youth in placement were there
as a result of a person offense and 29%
were held for a property offense. How-
ever, declines in the placement popula-
tion between 1999 and 2019 were not
evenly spread across offenses. In fact,
with the exception of youth held for a
public order offense, the relative de-
cline in the number of youth held for
Q The detained and committed populations have declined considerably between 1999—the year the CJRP population peaked—and
2019, but the declines varied based on offense. For example, among the detained population, the number of youth held for a
drug offense declined more than 80%, and the number held for a status offense, technical violation, or a property offense fell
more than 60%; the decline in youth detained for a public order (36%) or a person (21%) offense was considerably less.
Q Among the committed population, the decline in the number of youth held for a drug offense (85%) or a property offense (81%)
outpaced the declined in the number of youth held for other offenses: person (68%), public order (62%), technical violations
(66%), and status offenses (67%).
Q The net result of these declines was that the offense profile of the detained and committed populations included a larger propor-
tion of youth held for a person offense, and a smaller proportion of youth held for a property or a drug offense. For example, in
2019, 45% of detained youth were in placement for a person offense, compared with 30% in 1997; among committed youth, the
proportion held for a person offense increased from 35% to 43%. Conversely, the proportion of detained youth held for a property
offense declined from 26% in 1997 to 20% in 2019; among committed youth, 22% were held for a property offense in 2019,
down from 32% in 1997.
Source: Authors’ analysis of OJJDP’s
Census of Juveniles in Residential Placement
for 1997–2019 [data files].
The offense profile of the detained and committed populations has changed
Detained youth
97 99 10 11 13 15 17 19
0%
20%
40%
60%
80%
100%
Census year
Percent of detained youth
01 03
06 07
97 99 10 11 13 15 17 19
0%
20%
40%
60%
80%
100%
Census year
01 03 06 07
Percent of committed youth
a person offense was less than the de-
cline for youth held for other offenses.
As a result, the proportion of youth in
placement for a person offense in-
creased to 43% in 2019.
Offense profile of youth in placement:
Percent
change
1999–2019Offense 1999 2019
Total 100% 100% –66%
Delinquency 96 96 –66
Person 35 43 –58
Property 29 21 –76
Drugs 9 4 –84
Public order 10 14 –53
Tech. violation 13 14 –64
Status offense 4 4 –67
The trend in the number and propor-
tion of youth in placement for a violent
crime (criminal homicide, sexual as-
sault, robbery, and aggravated assault)
mirrored the trend of youth held for
person offenses: the number of youth
in placement for a violent crime de-
clined 59% between 1999 and 2019,
but, given the larger declines in other
offenses over the same period, the pro-
portion of youth held for a violent
crime increased from 25% in 1999 to
30% in 2019. Conversely, the number
of youth held for a status offense de-
clined considerably between 1999 and
2019, but the proportion of youth in
placement for a status offense remained
the same.
Committed youth
Person Property Public orderDrugs
Technical viol.
Status

Chapter 7: Youth in corrections
191
Females accounted for a relatively small proportion of the
residential placement population
Females accounted for 15% of
youth in residential placement
The juvenile justice system predomi-
nantly consists of male youth. This is
especially true of the residential place-
ment population. Males represent half
of the youth population and are in-
volved in approximately 70% of youth
arrests and delinquency cases that juve-
nile courts handle each year, but they
represented 85% of youth held in resi-
dential placement in 2019. Females ac-
counted for a larger proportion of
youth in private facilities (16%) than in
public facilities (14%), a larger propor-
tion of the detained population (16%)
than the committed population (14%) .
Although the number of females in
placement has declined since 1997,
their proportion of the placement pop-
ulation has remained stable.
Female percent of youth in placement:
Offense 1997 2019
Total 14% 15%
Facility operation:
Public 12 14
Private 18 16
Placement status:
Detained 17 16
Committed 12 14
Females in placement tended to
be younger than their male
counterparts
In 2019, 43% of females in placement
were younger than age 16, compared
with 32% of males. For females in
placement, the peak age was 16, ac-
counting for 27% of all females in
placement facilities. For males, the
peak age was 17 (27%).
Age profile of youth in placement, 2019:
Age Total Male Female
Total 100% 100% 100%
12 or younger 2 2 2
13 4 4 6
14 10 9 13
15 18 18 22
16 26 26 27
17 27 27 23
18–20 14 15 7
Note: Detail may not total 100% because of
rounding.
Females were committed to
placement for different offenses
than males
In 2019, nearly 3,000 females were
committed to placement, that is, they
were in placement as part of a court-
ordered sanction. About 1 in 3 (34%)
females were committed to placement
for a person offense, compared with
44% of males. Conversely, larger pro-
portions of females than males were
committed to placement for a status
offense (12% vs. 4%) or technical viola-
tions (17% vs. 11%).
Offense profile of committed youth, 2019:
Offense Male Female
Total 100% 100%
Delinquency 96 88
Person 44 34
Property 22 19
Drugs 5 7
Public order 15 10
Tech. violation 11 17
Status offense 4 12
Note: Detail may not total 100% because of
rounding.
Females were more likely than males to be held for technical
violations or status offenses
Offense profile of youth in
residential placement, 2019
All facilities Public facilities Private facilities
Most serious offense Male Female Male Female Male Female
Total 100% 100% 100% 100% 100% 100%
Delinquency 97 91 99 96 91 78
Person 44 37 47 39 37 31
Violent Crime Index* 32 16 35 19 23 8
Other person 12 21 12 21 14 23
Property 21 19 21 18 21 21
Property Crime Index
†
17 14 17 13 18 16
Other property 4 4 4 4 3 4
Drug 4 5 4 4 6 8
Drug trafficking 1 0 1 1 1 0
Other drug 3 5 3 4 5 8
Public order 15 9 14 10 17 7
Technical violation
‡
13 21 13 24 11 11
Status offense 3 9 1 4 9 22
Q Compared with males, a larger proportion of females were in placement for a
status offense (9% vs. 3%) or a technical violation (21% vs. 13%) in 2019.
Q More than 1 in 5 (22%) females in private facilities were there for a status of-
fense, compared with less than 1 in 10 (9%) males.
* Violent Crime Index = criminal homicide, sexual assault, robbery, and aggravated assault.
†
Property Crime Index = burglary, theft, auto theft, and arson.
‡
Technical violations = violations of probation, parole, and valid court order.
Note: Detail may not add to totals because of rounding.
Source: Authors’ analysis of OJJDP’s
Census of Juveniles in Residential Placement, 2019
[data
file].

Youth and the Juvenile Justice System: 2022 National Report
192
Placement rates for Black youth and American Indian youth
exceed the rate for White youth
Black youth accounted for the
largest share of youth in
placement
In 2019, the population of youth in
residential placement was 41% Black,
33% White, and 20% Hispanic. Relative
to their proportion in the general pop-
ulation, Black youth were overrepre-
sented in the placement population. In
2019, Black youth accounted for 14%
of the population ages 10–20 and 41%
of the placement population. American
Indian youth were also overrepresented
in the placement population but not to
the same extent as Black youth.
Race profile of youth ages 10–20, 2019:
Offense Population
Residential
placement
Total 100% 100%
White 52 33
Black 14 41
Hispanic 25 20
American Indian 1 2
Asian 5 1
Two or more 4 2
Note: Racial categories (i.e., White, Black,
American Indian, and Asian) do not include youth
of Hispanic ethnicity. The American Indian racial
category includes Alaska Natives; the Asian racial
category includes Native Hawaiians and Other
Pacific Islanders. Totals include persons of
unspecified race.
Detail may not total 100%
because of rounding.
Black youth also accounted for a larger
share of the detained population (46%)
than White youth (26%) or Hispanic
youth (23%). Among those committed
to placement following a court-ordered
sanction, White youth and Black youth
accounted for the same proportion in
2019 (28%), while Hispanic youth ac-
counted for 19%. American Indian,
Asian\Pacific Islander, and youth of
two or more races combined to ac-
count for 6% or less of the detained
and committed populations.
1997 1999 2001 2003 2006 2007 2010 2011 2013 2015 2017 2019
0
100
200
300
400
500
600
700
800
900
1,000
Census year
Youth in residential placement per 100,000 youth ages 10−upper age
Black
White
American Indian
Hispanic
Asian
Residential placement rates declined for all race groups since 1997, but
the rates for Black, American Indian, and Hispanic youth remain higher
than the rate for White youth
Q Between 1997 and 2019, the residential placement rate declined the most for Asian
youth (90%), followed by Hispanic (80%), Black (67%), White (64%), and American
Indian (52%) youth. Despite these declines, placement rates were higher for Black,
Hispanic, and American Indian youth than White youth each year since 1997.
Notes: Racial categories (i.e., White, Black, American Indian, and Asian) do not include youth of His-
panic ethnicity. The American Indian racial category includes Alaska Natives; the Asian racial category
includes Native Hawaiians and Other Pacific Islanders. Rates are based on the number of youth in
placement per 100,000 youth ages 10 through the upper age of juvenile court jurisdiction.
Source: Authors’ analysis of OJJDP’s
Census of Juveniles in Residential Placement
for 1997 through
2019 [data files].
Detention and commitment rates for Black youth and American
Indian youth were well above the rates for White youth
Rate per 100,000 youth
ages 10–upper age
Ratio of rates (relative to
rate for White youth)
Race/ethnicity Total Detained Committed Total Detained Committed
White 72 22 47
Black 315 139 168 4.4 6.3 3.6
Hispanic 92 41 50 1.3 1.9 1.1
American Indian 236 91 140 3.3 4.1 3.0
Asian 19 8 11 0.3 0.4 0.2
Q The ratio is determined by dividing the rate of each racial/ethnic minority group
by the rate for White youth. A ratio of 1.0 indicates statistical parity, i.e., the
rates for the comparison groups are equal. For example, if White youth and
Black youth were placed at the same rate, the ratio would be 1.0. When the
ratio exceeds 1.0, the rate for a particular racial/ethnic minority group exceeds
the rate for White youth; when it is below 1.0, the rate for a racial/ethnic minori-
ty group is less than the rate for White youth.
Note: Racial categories (i.e., White, Black, American Indian, and Asian) do not include youth of His-
panic ethnicity. The American Indian racial category includes Alaska Natives; the Asian racial cate-
gory includes Native Hawaiians and Other Pacific Islanders. Rates are based on the number of
youth in placement per 100,000 youth ages 10 through the upper age of juvenile court jurisdiction.
Source: Authors’ analysis of OJJDP’s
Census of Juveniles in Residential Placement, 2019
[data
file].

Chapter 7: Youth in corrections
193
Nationally, residential placement rates were highest for
Black youth
For every 100,000 Black youth living in the U.S., 315 were in a residential placement facility on October 23,
2019; for American Indian youth the rate was 236 and for Hispanic youth the rate was 92
Placement rate (per 100,000), 2019 Placement rate (per 100,000), 2019
State
White Black
Hispanic
American
Indian
Asian
State
White Black
Hispanic
American
Indian
Asian
U.S. total 72 315 92 236 19 Missouri 80 288 24* 102* 21*
Alabama 106 294 65 0* 35*
†
Montana 100 602* 101* 332 0*
Alaska 219 720 45*
†
693 200 Nebraska 69 641 197 1,145 47*
Arizona 62 240 67 101 22* Nevada 140 488 117 102* 47
Arkansas 96
†
307 129
†
113*
†
119*
†
New Hampshire
14 183* 38* 0* 0*
California 48 433 113
†
212 14 New Jersey 14 245 58 0* 3*
Colorado 76 557 160 145* 52 New Mexico 277 467 58 62 0*
Connecticut 7
†
74
†
36
†
1,163
†
16* New York 30 168 37 44* 5*
Delaware 44 390 61* 0* 0* North Carolina 37 250 34 296 0*
Dist. of Columbia
35*
†
388 84* 0* 0* North Dakota 70 356 71* 319 247*
Florida 90 295 7 0* 9* Ohio 84 433 86 220* 9*
Georgia 40 233 47 0* 13* Oklahoma 53 281 37 105 26*
Hawaii 25* 0* 61 0* 30 Oregon 146 547 169 362 52
Idaho 137 980 176 580 167* Pennsylvania 73 413 108 0* 24
Illinois 32
†
218 39
†
231*
†
4*
†
Rhode Island 72 434 77 479* 0*
Indiana 138 298 72 0* 15*
†
South Carolina 63 315 49 0* 0*
Iowa 83 721 116 474* 0* South Dakota 109 512 219 486 0*
Kansas 81 405 110 185* 56* Tennessee* 27 124 42 0* 19*
Kentucky 89 393 75 0* 32* Texas 74 345 116 34* 13
Louisiana 49 294 41 81* 0* Utah 38 336 110 143* 41*
Maine 42 288 0* 0* 0* Vermont 30 206* 0* 0* 0*
Maryland 29 182 55 0* 0* Virginia 57 273 103 0* 14*
†
Massachusetts 19 133 108 0* 6* Washington 60 310 112 257 39
Michigan 85 458 88 174 27* West Virginia 249 803 344 0* 0*
Minnesota 73
†
621
†
198
†
852 46
†
Wisconsin 43 485 53 328 30*
Mississippi 27 105 40* 0* 0* Wyoming 202 556* 242 760 0*
Q
In all but seven states, the residential placement rate for Black youth exceeded the rate for other race/ethnicity groups. In six
states, the placement rate for American Indian youth exceeded the rate for other race/ethnicity groups.
*Rate is based on fewer than 10 youth.
†Interpret data with caution. In these states, 30% or more of the information for offense or placement status (i.e., detained or committed) was imputed.
Notes: Racial categories (i.e., White, Black, American Indian, and Asian) do not include youth of Hispanic ethnicity. The American Indian racial category in-
cludes Alaska Natives; the Asian racial category includes Native Hawaiians and Other Pacific Islanders. U.S. totals include 1,895 youth for whom state of
offense was not reported.
Source: Authors’ analysis of OJJDP’s
Census of Juveniles in Residential Placement
for 2019 [data file].

Youth and the Juvenile Justice System: 2022 National Report
194
Youth held for person offenses had been committed or
detained longer than youth held for other offenses
CJRP provides individual-level
data on time spent in placement
Information on length of stay is key to
understanding the justice system’s han-
dling of youth in residential placement.
Ideally, length of stay would be calcu-
lated for individual youth by totaling
the days of their stay in placement,
from their initial admission to their
final release relating to a particular
case. These individual lengths of place-
ment would then be averaged for dif-
ferent release cohorts of youth (co-
horts would be identified by year of
release, offense, adjudication status, or
demographic characteristics).
CJRP captures information on the
number of days since admission for
each youth in residential placement.
These data represent the number of
days the youth had been in the facility
up to the census date. Because CJRP
data reflect only a youth’s placement at
one facility, the complete length of
stay—from initial admission to the jus-
tice system to final release—cannot be
determined. Nevertheless, CJRP pro-
vides an overall profile of the time
youth had been in the facility at the
time of the census—a 1-day snapshot
of time in the facility.
Because CJRP data are reported for in-
dividuals, averages can be calculated
for different subgroups of the popula-
tion. In addition, analysts can use the
data to get a picture of the proportion
of residents remaining after a certain
number of days (e.g., what percentage
of youth have been held longer than a
year). This sort of analysis provides ju-
venile justice policymakers with a use-
ful means of comparing the time spent
in placement for different categories of
youth.
0 30 60 90 120 150 180 210 240 270 300 330 360
0%
20%
40%
60%
80%
100%
Days since admission
Percent of youth remaining in placement
Detained
Committed
In 2019, 33% of committed youth but just 8% of detained youth
remained in placement 6 months after admission
Q Among detained youth (those awaiting adjudication, disposition, or placement else-
where), 80% had been in the facility for at least a week, 64% for at least 15 days,
and 46% for at least 30 days.
Q Among committed youth (those held as part of a court-ordered disposition), 81%
had been in the facility for at least 30 days, 69% for at least 60 days, and 58% for
at least 90 days. After a full year, 12% of committed youth remained in placement
Source: Authors’ analysis of OJJDP’s
Census of Juveniles in Residential Placement
, 2019 [data file].
Youth’s average time in the facility varied by placement status,
offense, and facility type
Median days in placement, 2019
Detained Committed
Most serious offense (all facilities) Public Private
Total 26 112 115
Person 36 147 129
Property 20 97 104
Drugs 18 78 97
Public order 24 104 134
Technical violation 16 63 84
Status offense 16 83 126
Q Half of all youth detained for a person offense were in a facility 36 days, twice
as long as youth in detention for a drug offense (18 days).
Q With the exception of those adjudicated for person offenses, youth committed
to private facilities had been in the facilities longer than those committed to
public facilities.
Q Time in placement is influenced by both punishment and treatment goals and,
therefore, does not always coincide with offense seriousness. For example,
among youth committed to private facilities, the average time in placement for
youth held for a status offense was longer than the average for those held for a
person offense.
Source: Authors’ analysis of OJJDP’s
Census of Juveniles in Residential Placement, 2019
[data
file].
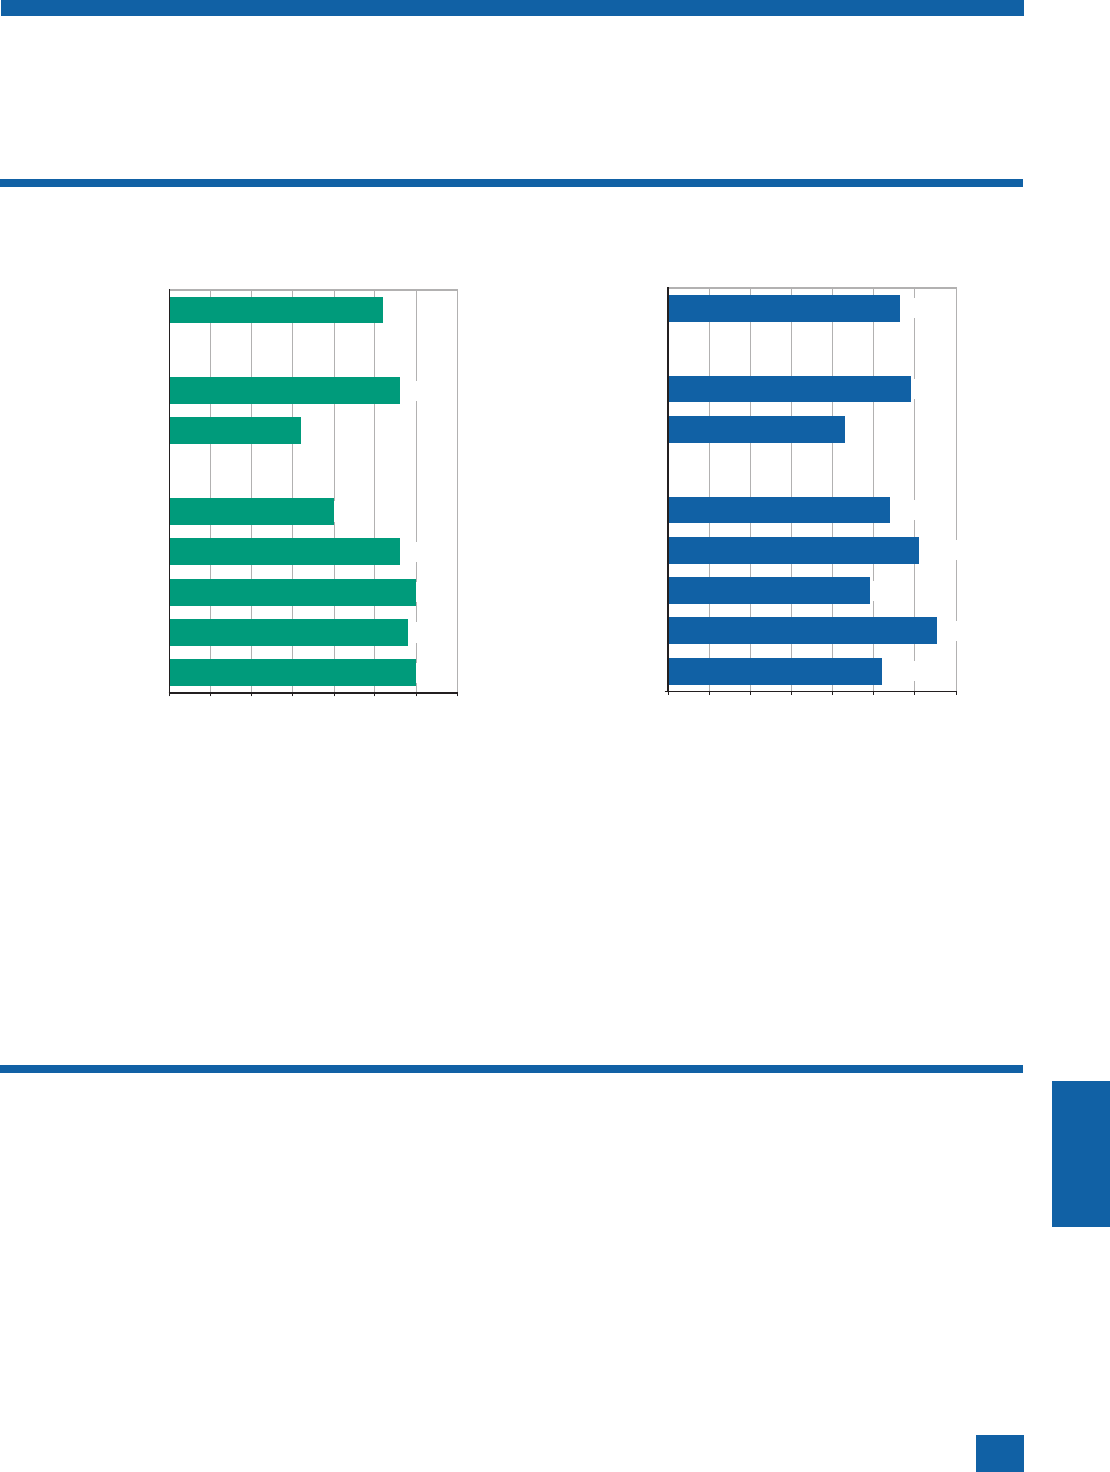
Chapter 7: Youth in corrections
195
Q Half of detained White youth remained in placement about 3 weeks, while half of Black, Hispanic, American Indian, and Asian
youth had been in detention about 1 month.
Q On average, half of all detained males had been in placement about 1 month, compared with about two weeks for detained fe-
males.
Q Among committed youth, half all females had been in placement about 3 months, while committed males had been in placement
about 4 months.
Q Half of all American Indian youth committed to placement had been in the facility more than 4 months, about a month longer than
Hispanic youth.
Note: Racial categories (i.e., White, Black, American Indian, and Asian) do not include youth of Hispanic ethnicity. The American Indian racial category in-
cludes Alaska Natives; the Asian racial category includes Native Hawaiians and Other Pacific Islanders.
Source: Authors’ analysis of OJJDP’s
Census of Juveniles in Residential Placement, 2019
[data file].
Among detained youth, racial and ethnic minority youth had been in placement longer than White youth
Detained youth
Asian
American Indian
Hispanic
Black
White
Female
Male
Total
0 5 10 15 20 25 30 35
Median days since admission, 2019
26
28
16
20
28
30
29
30
Asian
American Indian
Hispanic
Black
White
Female
Male
Total
0 20 40 60 80 100 120 140
Median days since admission, 2019
113
118
86
108
122
98
131
104
Committed youth

Youth and the Juvenile Justice System: 2022 National Report
196
Nearly half of youth in residential placement on the 2018
census date were held in detention centers
JRFC provides data on residential
facility operations
In 2018, the Juvenile Residential Facil-
ity Census (JRFC) collected data from
2,208 juvenile residential facilities.
Analyses were based on data from
1,510 facilities, which held a total of
37,529 youth younger than age 21
who were held for an offense on the
census date (October 24, 2018). Data
were excluded from 1 facility in the
Virgin Islands, 16 tribal facilities, and
681 facilities that held no youth who
were charged with an offense on the
reference date.
Residential treatment centers and
detention centers outnumbered
other types of facilities
JRFC asks respondents to identify the
type of facility (e.g., detention center,
shelter, reception/diagnostic center,
group home/halfway house, ranch/
forestry/wilderness camp/marine pro-
gram, training school/long-term se-
cure facility, or residential treatment
center). Respondents were allowed to
select more than one facility type cate-
gory, although the vast majority (84%)
selected only one. More than 600 facil-
ities identified themselves as detention
centers in 2018; they accounted for
41% of all facilities and held 46% of
youth.
There were 553 facilities that identified
themselves as residential treatment cen-
ters. They made up 37% of all facilities
and held 37% of youth in 2018.
Facilities identified as detention centers
most commonly also identified them-
selves as residential treatment centers
(45 facilities) and training schools (44).
There were 59 facilities that identified
themselves as both residential treat-
ment centers and training schools, the
most common type of facility combina-
tion.
Training schools tend to be state facilities, detention centers tend to be local facilities, and group homes
tend to be private facilities
Facility type
Facility operation Total
Detention
center Shelter
Reception/
diagnostic
center
Group
home
Ranch/
wilderness
camp
Training
school
Residential
treatment
center
Number of facilities 1,510 625 116 37 240 27 164 553
Operation profile
All facilities 100% 100% 100% 100% 100% 100% 100% 100%
Public 60 93 34 81 28 59 77 35
State 22 21 3 68 14 26 59 19
Local 38 72 30 14 14 33 19 16
Private 40 7 66 19 72 41 23 65
Facility profile
All facilities 100% 41% 8% 2% 16% 2% 11% 37%
Public 100 64 4 3 7 2 14 21
State 100 40 1 8 10 2 29 32
Local 100 78 6 1 6 2 5 16
Private 100 7 13 1 29 2 6 59
Q Detention centers, reception/diagnostic centers, ranch/wilderness camps, and training schools were more likely to be public
facilities than private facilities.
Q Most shelters, group homes, and residential treatment centers were private facilities.
Q Detention centers made up more than three quarters of all local facilities and nearly two-thirds of all public facilities.
Q Detention centers and residential treatment centers accounted for the largest proportions of all state facilities (40% and 32%,
respectively); training schools accounted for 29%.
Q Residential treatment centers accounted for 59% of all private facilities, and group homes accounted for 29%.
Notes: Counts (and row percentages) may sum to more than the total number of facilities because facilities could select more than one facility type. De-
tail may not sum to total because of rounding.
Source: Authors’ analysis of OJJDP’s
Juvenile Residential Facility Census 2019
[data file].
Chapter 7: Youth in corrections
197
Security features varied across types and size of facilities
Facilities varied in their degree of
security
In 2018, 49% of facilities said that, at
least some of the time, youth were
locked in their sleeping rooms. Among
public facilities, 81% of local facilities
and 69% of state facilities reported
locking youth in sleeping rooms. Few
private facilities locked youth in sleep-
ing rooms (8%).
Among facilities that locked youth in
sleeping rooms, most did this at night
(87%) or when a youth was out of con-
trol (80%). Locking doors whenever
youth were in sleeping rooms (61%)
and locking youth in their rooms dur-
ing shift changes (55%) were also fairly
common. Fewer facilities reported
locking youth in sleeping rooms for a
part of each day (21%) or when they
were suicidal (22%).
Very few facilities reported that they
locked youth in sleeping rooms most
of each day (1%) or all of each day (less
than 1%). Seven percent (7%) had no
set schedule for locking youth in sleep-
ing rooms.
Facilities indicated whether they had
various types of locked doors or gates
to confine youth within the facility. Of
all facilities that reported confinement
information, 64% said they had one or
more confinement features (other than
locked sleeping rooms), with a greater
proportion of public facilities using
these features than private facilities
(87% vs. 30%).
Confinement profile of facilities, 2019:
Facility
operation
No
confinement
features
One or more
confinement
features
Total 36% 64%
Public 13 87
State 13 87
Local 13 87
Private 70 30
Note: Percentages are based on facilities that
reported security information (12 of 1,510
facilities [1%] did not report).
Among detention centers, training
schools, and reception/diagnostic cen-
ters that reported confinement infor-
mation, more than 9 in 10 said they
had one or more features (other than
locked sleeping rooms).
Facilities reporting one or more
confinement features (other than
locked sleeping rooms), 2019:
Facility type Number Percentage
Total 960 64%
Detention center 605 97
Shelter 33 28
Reception/
diagnostic center
35 95
Group home 42 18
Ranch/wilderness
camp
10 37
Training school 158 96
Residential
treatment center
268 50
Note: Detail sums to more than the total
because facilities could select more than one
facility type.
Among group homes, nearly 1 in 5 fa-
cilities said they had locked doors or
gates to confine youth. The presence
of facility staff also serves to confine
youth. For some facilities, their remote
location is a feature that also helps to
keep youth from leaving.
Security features increased as
facility size increased
Although the majority of facilities re-
ported using more than one confine-
ment feature in 2018, the proportion
varied by facility size. For example,
about half (53%) of small facilities
(those holding between 1 and 20 resi-
dents) reported using multiple confine-
ment features, compared with 78% of
medium facilities (those holding be-
tween 21 and 50 residents), and 79%
of large facilities (those holding be-
tween 101 and 200 residents).
Although the use of razor wire is a far
less common confinement feature—
overall, less than one-third (29%) of fa-
cilities reported using razor wire—46%
of large facilities said they had locked
gates in fences or walls with razor wire.
Percent of facilities reporting confinement
feature, 2019:
Facility
size
Youth
locked in
sleeping
rooms
One
or more
confinement
features
Razor
wire
Total 49% 64% 29%
Small 40 53 20
Medium 61 78 41
Large 66 79 46
Note: Percentages are based on facilities that
reported security information (12 of 1,510
facilities [1%] did not report).
The Juvenile Residential
Facility Census asks facilities
about their confinement
features
Are any young persons in this facili-
ty locked in their sleeping rooms by
staff at any time to confine them?
Does the facility have any of the fol-
lowing features intended to confine
young persons within specific areas?
Q Doors for secure day rooms that
are locked by staff to confine
young persons within specific
areas?
Q Wing, floor, corridor, or other in-
ternal security doors that are
locked by staff to confine young
persons within specific areas?
Q Outside doors that are locked
by staff to confine young per-
sons within specific buildings?
Q External gates in fences or walls
without razor wire that are
locked by staff to confine young
persons?
Q External gates in fences or walls
with razor wire that are locked
by staff to contain young per-
sons?

Youth and the Juvenile Justice System: 2022 National Report
198
Facility crowding affected a relatively small proportion of
youth in residential placement
Few youth were in facilities with
more residents than standard
beds
Facilities reported both the number of
standard beds and the number of
makeshift beds they had on the census
date. Occupancy rates provide the
broadest assessment of the adequacy of
living space. Although occupancy rate
standards have not been established, as
a facility’s occupancy passes 100%, op-
erational functioning may be com-
prised.
Crowding occurs when the number of
residents occupying all or part of a fa-
cility exceeds some predetermined limit
based on square footage, utility use, or
even fire codes. Although it is an im-
perfect measure of crowding, compar-
ing the number of residents to the
number of standard beds gives a sense
of the crowding problem in a facility.
Even without relying on makeshift
beds, a facility may be crowded. For
example, using standard beds in an in-
firmary for youth who are not sick or
beds in seclusion for youth who have
not committed infractions may indicate
crowding problems.
In 2018, 1% of facilities reported being
over capacity (having fewer standard
beds than they had residents or relying
on makeshift beds). These facilities
held 1% of youth. In comparison, 8%
of facilities in 2000 reported being
over capacity and they held 20% of
youth.
In 2018, only public facilities
reported operating above capacity
No privately operated facilities exceed-
ed standard bed capacity or had resi-
dents occupying makeshift beds on the
2018 census date. For publicly operat-
ed facilities, the proportion was 1%. In
contrast, a larger proportion of private
facilities (25%) compared with public
facilities (12%) said they were operat-
ing at 100% capacity.
Percent of facilities under, at, or over their
standard bed capacity, 2019:
Facility
operation <100% 100% >100%
Total 82% 17% 1%
Public 87 12 1
State 81 17 2
Local 90 9 1
Private 75 25 0
In 2000, 257 facilities from 41 states were over capacity; by 2018, just 11 facilities in 9 states were over
Number of
facilities
Percent of
facilities over
capacity
Percent of youth
in over capacity
facilities
Number of
facilities
Percent of
facilities over
capacity
Percent of youth
in over capacity
facilities
State
2000 2018
2000
2018
2000
2018
State
2000 2018
2000
2018
2000
2018
U.S. total 3,047 1,510 8% 1% 20% 1% Missouri 65 50 9% 2% 16% 2%
Alabama 46 38 7 0 11 0 Montana 18 13 6 0 8 0
Alaska 19 18 5 6 6 5 Nebraska 22 11 14 0 40 0
Arizona 51 17 12 0 16 0 Nevada 15 11 27 9 39 3
Arkansas 45 24 0 0 0 0
New Hampshire
83 0* 0*
California 285 104 9 0 21 0 New Jersey 57 24 14 0 24 0
Colorado 72 21 8 5 30 18 New Mexico 27 16 15 0 44 0
Connecticut 25 3 4 * 6 * New York 210 75 5 0 22 0
Delaware 7 8 29 0 59 0 North Carolina 67 27 12 0 22 0
Dist. of Columbia
17 5 0 0 0 0 North Dakota 13 7 0 0 0 0
Florida 166 62 10 2 23 1 Ohio 106 67 15 1 15 5
Georgia 50 30 28 0 25 0 Oklahoma 52 25 0 0 0 0
Hawaii 7 3 14 * 66 * Oregon 48 33 13 0 23 0
Idaho 22 17 14 0 25 0 Pennsylvania 163 94 5 0 5 0
Illinois 46 28 7 4 4 6 Rhode Island 11 9 9 0 58 0
Indiana 97 62 11 0 34 0 South Carolina 42 17 10 0 15 0
Iowa 76 33 0 0 0 0 South Dakota 22 14 0 7 0 28
Kansas 51 20 4 0 25 0 Tennessee 63 20 3 0 3 0
Kentucky 58 29 2 0 4 0 Texas 138 86 16 0 38 0
Louisiana 64 30 5 0 3 0 Utah 51 25 14 0 15 0
Maine 17 1 0 * 0 * Vermont 5 2 0 * 0 *
Maryland 43 24 7 0 13 0 Virginia 74 38 22 0 32 0
Massachusetts 71 36 8 0 14 0 Washington 42 31 7 0 24 0
Michigan 107 46 7 0 5 0 West Virginia 27 46 22 7 31 11
Minnesota 121 39 4 0 17 0 Wisconsin 94 40 1 0 22 0
Mississippi 20 16 5 0 4 0 Wyoming 24 12 0 0 0 0
*To protect the identity of specific facilities, no detail is displayed if the total number of facilities is greater than 0 and less than 5.
Notes: A single bed is counted as one standard bed, and a bunk bed is counted as two standard beds. Makeshift beds (e.g., cots, roll-out beds, mat-
tresses, and sofas) are not counted as standard beds. Facilities are counted as over capacity if they reported more residents than standard beds or if they
reported any occupied makeshift beds. “State” is the state where the facility is located. Youth sent to out-of-state facilities are counted in the state where
the facility is located, not the state where they committed their offense.
Source: Authors’ analysis of OJJDP’s
Juvenile Residential Facility Census
for 2000 and 2018 [data files].

Chapter 7: Youth in corrections
199
Most facilities evaluate youth for educational, substance
abuse, and mental health service needs
The JRFC asked facilities about
procedures regarding educational,
substance abuse, and mental
health screening
As part of the information collection
on educational, substance abuse, and
mental health services, the JRFC ques-
tionnaire asked facilities which youth
are screened for services and when this
screening takes place. Additionally, fa-
cilities are also asked to provide infor-
mation about services they provide
youth.
Most reporting facilities indicated they
screened at least some youth for service
needs. However, the proportion of fa-
cilities that screen all youth for educa-
tion, substance abuse, and mental
health service needs increased between
2000 and 2018.
Compared with other services, screen-
ing for substance abuse needs was least
likely to occur among facilities in both
2000 and 2018. Despite this, 87% of
reporting facilities indicated they
screened all or some youth for sub-
stance abuse needs in 2018.
Most reporting facilities screened
youth for service needs within one
week of admission. In 2018, 99% of fa-
cilities screened youth within one week
for suicide risk, 96% for education
needs, 92% for substance abuse needs,
and 77% for mental health needs. The
proportion of facilities that screened
youth for suicide risk within the first
24 hours increased from 69% in 2000
to 92% in 2018.
2000 2018 2000 2018 2000 2018 2000 2018
All youth
Some youth No youth
Education
Substance abuse
Mental health
Suicide risk
0%
20%
40%
60%
80%
100%
Percent of facilities (of those that reported evaluating)
The proportion of facilities that screened all youth for service needs
increased between 2000 and 2018
Q Screening all youth for service needs varied by service need in 2018; 88% of re-
porting facilities screened all youth for educational needs, 75% screened all youth
for substance abuse needs, 63% screened all youth for mental health needs, and
95% screened all youth for suicide risk.
Q The practice of screening all youth increased the most for suicide risk screening
between 2000 and 2018—up 33 percentage points from 61% in 2000.
Source: Authors’ analysis of the OJJDP’s
Juvenile Residential Facility Census
for 2000 and 2018 [data
files].
2000 2018 2000 2018 2000 2018 2000 2018
Education
Substance abuse
Mental health
Suicide risk
84%
96%
78%
92%
63%
77%
81%
99%
0%
20%
40%
60%
80%
100%
Percent of facilities that reported within 1 week (of those that reported evaluating)
The majority of facilities reported screening youth within one week of
admission
Q With the exception of mental health screening, more than 9 in 10 facilities screened
youth for services within the first week of admission in 2018.
Q Screening within the first week of admission increased across all service needs be-
tween 2000 and 2018.
Source: Authors’ analysis of the OJJDP’s
Juvenile Residential Facility Census
for 2000 and 2018 [data
files].

Youth and the Juvenile Justice System: 2022 National Report
200
Most youth were evaluated for educational needs and
attended school while held in facilities
Facilities that screened all youth
for educational needs held 89% of
youth in placement
Since 2000, there has been an increase
in the proportion of facilities that re-
ported evaluating all youth for grade
level and educational needs. For exam-
ple, in 2018, 88% of reporting facilities
said they screened all youth for educa-
tional needs, up from 78% in 2000. An
additional 4% of facilities in 2018 eval-
uated some youth and only 8% did not
evaluate any youth for educational
needs.
Of the 73 facilities in 2018 that
screened some but not all youth, 71%
evaluated youth whom staff identified
as needing an assessment, 34% evaluat-
ed youth with known educational
problems, 50% evaluated youth for
whom no educational record was avail-
able, and 11% evaluated youth who
came directly from home rather than
another facility. In addition, 28% re-
ported evaluating youth based on some
“other” reason.
In 2018, those facilities that screened
all youth held 89% of youth charged
with or adjudicated for an offense. An
additional 3% of such youth in 2018
were in facilities that screened some
youth.
Procedures for evaluating youth
changed little between 2000 and 2018.
In 2018, the vast majority of facilities
(93%) that screened some or all youth
for grade level and educational needs
used previous academic records. Some
facilities also administered written tests
(60%), or conducted an education-re-
lated interview with an education spe-
cialist (60%), intake counselor (37%),
or guidance counselor (27%).
Most facilities reported that youth
in their facility attended school
Ninety-five percent (95%) of facilities
reported that at least some youth in
their facility attended school either in-
side or outside the facility. Facilities re-
porting that all youth attended school
(76% of facilities) accounted for 76% of
the youth population in residential
placement. Reception/diagnostic cen-
ters were the least likely to report that
all youth attended school (59%), while
ranch/wilderness camps were the most
likely to report that no youth attended
school (11%).
Facilities offered a variety of
educational services
Ninety-four percent (94%) of all facili-
ties provided high school-level educa-
tion, and 89% provided middle school-
level education. Most facilities also
reported offering special education ser-
vices (83%) and GED preparation
(71%). A much smaller percentage of
facilities provided vocational or techni-
cal education (41%) and post-high
school education (38%).
Local facilities were more likely than state or privately operated
facilities to report that all youth attended school
Percent of facilities
Facility characteristic Total All youth Some youth No youth
Facility operation
State 100% 76% 21% 3%
Local 100 80 17 3
Private 100 73 18 9
Facility type
Detention center 100 82 15 3
Shelter 100 77 22 2
Reception/diagnostic center 100 59 32 8
Group home 100 63 29 8
Ranch/wilderness camp 100 67 22 11
Training school 100 77 23 1
Residential treatment center 100 76 16 8
Facility size
Small (20 or fewer residents) 100 75 19 6
Medium (21–100 residents) 100 79 16 4
Large (>100 residents) 100 66 28 6
Q Reception/diagnostic centers were the least likely to report that all youth at-
tended school (59%), while ranch/wilderness camps were the most likely to re-
port that no youth attended school.
Q Medium facilities with 21 to 100 residents were more likely to report that all
youth attended school (79%), while large facilities with more than 100 residents
were least likely (66%) to have all youth attend school.
Source: Authors’ analysis of OJJDP’s
Juvenile Residential Facility Census 2018
[data file].

Chapter 7: Youth in corrections
201
Substance abuse screening and drug testing were common
procedures at juvenile residential facilities
Facilities that screened all youth
held 76% of youth in placement
In 2018, 75% of facilities that reported
information about substance abuse
evaluation said that they evaluated all
youth (up from 59% in 2000), 12%
said that they evaluated some youth,
and 13% did not evaluate any youth.
Of the 174 facilities that evaluated
some but not all youth in 2018, 86%
evaluated youth that the court or a
probation officer identified as poten-
tially having substance abuse problems,
66% evaluated youth that facility staff
identified as potentially have a sub-
stance abuse problem, and 60% evalu-
ated youth charged with or adjudicated
for a drug- or alcohol-related offense.
Those facilities that screened all youth
held 76% of youth in placement, up
from 64% in 2000. An additional 12%
of youth were in facilities that screened
some youth.
The most common form of
substance abuse evaluation was
staff-administered questions
Methods for evaluating youth for sub-
stance abuse needs changed very little
since 2000. In 2018, the majority of
facilities (78%) that evaluated some or
all youth for substance abuse problems
had staff administer a series of ques-
tions about substance use and abuse,
66% visually observed youth to evalu-
ate them, 55% used a self-report check-
list inventory that asks about substance
use and abuse to evaluate youth, and
41% used a standardized self-report in-
strument, such as the Substance Abuse
Subtle Screening Inventory.
Drug testing practices have
changed somewhat since 2000
While drug testing was a routine prac-
tice in both 2000 and 2018, the pro-
portion of facilities that reported that
they required youth to provide a urine
sample to test for drug use was slightly
lower in 2018 than in 2000 (72% and
69%, respectively), However it was
more common for facilities to require a
urine sample when youth entered and
re-entered the facility in 2018 than in
2000. The practice of randomly screen-
ing youth for drug use decreased be-
tween the two years.
In 2018, substance abuse
education was the most common
service provided at facilities
Of the facilities holding more than 100
residents that reported providing sub-
stance abuse services, all of them pro-
vided substance abuse education and
were more likely than smaller facilities
to have special living units in which all
young persons have substance abuse
offenses and/or problems.
The majority of facilities that provided
counseling or therapy were more likely
to provide those services on an individ-
ual basis. In 2018, detention centers,
shelters and group homes were most
likely to provide individual counseling
and all training schools provided indi-
vidual therapy.
Ranch/wilderness camps were the
most likely to provide group counsel-
ing and 95% of training schools report-
ed providing group therapy. Across fa-
cility types, family counseling or
therapy was the least likely substance
abuse service provided; half of all facili-
ties provided family therapy and less
than half provided family counseling.
Drug testing was a routine procedure in most facilities
Percent of facilities
Circumstances of testing 2000 2018
All youth
After initial arrival 18% 31%
At each reentry 15 26
Randomly 31 29
When drug use is suspected 51 51
At the request of the court or probation officer 51 68
Youth suspected of recent drug/alcohol use
After initial arrival 28 37
At each reentry 21 24
Randomly 40 31
When drug use is suspected or drug is present 65 55
At the request of the court or probation officer 70 69
Youth with substance abuse problems
After initial arrival 22 27
At each reentry 19 23
Randomly 42 31
When drug use is suspected or drug is present 59 50
At the request of the court or probation officer 67 66
Q In both 2000 and 2018, of facilities that reported testing all or some youth, the
most common reason for testing was a request from the court or the probation
officer.
Source: Authors’ analysis of OJJDP’s
Juvenile Residential Facility Census
for 2000 and 2018 [data
files].

Youth and the Juvenile Justice System: 2022 National Report
202
Most facilities evaluated all youth for mental health needs
and provided therapy
Facilities that screened all youth
for mental health needs held 64%
of youth
Among facilities that responded to
mental health evaluation questions in
2018, 70% reported they evaluated all
youth for mental health needs using an
in-house mental health professional; up
from 58% in 2000. These facilities held
64% of youth charged with or adjudi-
cated for an offense on the census
date, up from 43% in 2000. Facilities
that reported using an in-house mental
professional to evaluate some youth
(30%) held 25% of youth.
In 2018, a greater proportion of pri-
vately operated than publicly operated
facilities said that in-house mental
health professionals evaluated all youth
(88% vs. 59% of facilities reporting
mental health evaluation information).
However, in a greater proportion of
public facilities than private facilities
(41% vs. 12%), in-house mental health
professionals evaluated some youth.
Profile of in-house mental health evalua-
tion by health professional, 2019:
Youth evaluated Public Private
Total reporting facilities 774 428
All reporting facilities 100% 100%
All youth screened 59 88
Some youth screened 41 12
Facilities also indicated whether treat-
ment was provided onsite. Facilities
that said they provided mental health
treatment inside the facility were likely
to have had all youth evaluated by an
in-house mental health professional.
Facilities that did not provide onsite
mental health treatment were more
likely to have had some youth evaluat-
ed by an in-house health professional.
Profile of onsite mental health treatment
availability, 2019:
Youth evaluated Yes No
Total reporting facilities 1,077 125
All reporting facilities 100% 100%
All youth screened 74 30
Some youth screened 26 70
Individual therapy was the most common therapy provided at all
reporting facilities
Total
facilities
Facilities
reporting
therapy
Percent of facilities
Facility type Individual Group Family
Total 1,510 1,120 98% 75% 66%
Detention center 625 468 97 57 43
Shelter 116 72 100 79 72
Reception/diagnostic center 37 30 100 90 90
Group home 240 114 97 81 75
Ranch/wilderness camp 27 18 100 72 67
Training school 164 159 96 89 72
Residential treatment center 553 466 100 89 89
Q Facilities were more likely to provide individual therapy than group or family
therapy in 2018.
Q Of all reporting facilities, 100% of shelters, reception/diagnostic centers, ranch/
wilderness camps, and residential treatment centers provided individual therapy.
Q Reception diagnostic centers and residential treatment centers were more likely
than other facilities to provide group and family therapy.
Source: Authors’ analysis of OJJDP’s
Juvenile Residential Facility Census 2018
[data file].
Individual therapy was a common practice regardless of facility size
Total
facilities
Facilities
reporting
therapy
Percent of facilities
Facility size Individual Group Family
Total 1,510 1,122 98% 75% 66%
Small (20 or fewer residents) 857 561 98 70 64
Medium (21–100 residents) 585 500 98 78 67
Large (>100 residents) 68 61 98 92 79
Q Large facilities (those holding more than 100 residents) were more likely than
smaller facilities to provide group and family therapy in 2018.
Source: Authors’ analysis of OJJDP’s
Juvenile Residential Facility Census 2018
[data file].

Chapter 7: Youth in corrections
203
Most youth were held in facilities that evaluate all youth for
suicide risk on their first day
Facilities that screened all youth
for suicide risk held 94% of the
youth in custody
In 2018, 95% of facilities that reported
information on suicide screening said
that they evaluated all youth for suicide
risk, up from 61% in 2000. An addi-
tional 1% said that they evaluated some
youth. Some facilities (4%) said that
they did not evaluate any youth for
suicide risk. In 2018, the overwhelm-
ing majority of youth (94%) were in fa-
cilities that screened all youth for sui-
cide risk.
Some facilities used trained
counselors or professional mental
health staff to conduct suicide
screening
More than half (55%) of facilities that
screened some or all youth for suicide
risk reported that mental health profes-
sionals with at least a master’s degree
in psychology or social work conduct-
ed the screenings. More than one-third
(37%) used neither mental health pro-
fessionals nor counselors whom a men-
tal health professional had trained to
conduct suicide screenings.
Facilities reported on the screening
methods used to determine suicide
risk. Facilities could choose more than
one method. Of facilities that conduct-
ed suicide risk screening, a majority
(77%) reported that they incorporated
one or more questions about suicide in
the medical history or intake process to
screen youth, 39% used a form their fa-
cility designed, and 25% used a form or
questions that a county or state juve-
nile justice system designed to assess
suicide risk. Half of facilities (51%) re-
ported using the Massachusetts Youth
Screening Instrument (MAYSI)—41%
reported using the MAYSI full form,
and 9% used the MAYSI suicide/de-
pression module. Very few facilities
(less than 1%) used the Voice Diagnos-
tic Interview Schedule for Children.
Of facilities that reported screening
youth for suicide risk, 90% reassessed
youth at some point during their stay.
Most facilities (88%) reported rescreen-
ing on a case-by-case basis or as neces-
sary. An additional 40% of facilities also
reported that rescreening occurred sys-
tematically and was based on a variety
of factors (e.g., length of stay, facility
events, or negative life events). Less
than 1% of facilities did not reassess
youth to determine suicide risk.
All facilities used some type of
preventive measure once they
determined a youth was at risk for
suicide
Facilities that reported suicide screen-
ing information were asked a series of
questions related to preventive mea-
sures taken for youth determined to be
at risk for suicide. Of these facilities
63% reported placing at-risk youth in
sleeping or observation rooms that are
locked or under staff security. Aside
from using sleeping or observation
rooms, 85% of facilities reported using
line-of-sight supervision, 88% reported
removing personal items that could be
used to attempt suicide, and 75% re-
ported using one-on-one or arm’s
length supervision. Half of facilities
(50%) reported using special clothing
to prevent suicide attempts, and 29%
reported removing the youth from the
general population. Twenty percent
(20%) of facilities used special clothing
to identify youth at risk for suicide,
and 19% of facilities used restraints to
prevent suicide attempts.
All youth All youth within 24 hours
0%
20%
40%
60%
80%
100%
72%
99%
60%
92%
2000
2018
Percent of facilities (of those that reported evaluating suicide risk)
Compared with 2000, facilities in 2018 were more likely to report
screening all youth for suicide risk on the youth’s first day at the facility
Q Nearly all facilities (99%) that reported screening for suicide risk in 2018 said they
screened all youth, up from 72% in 2000.
Q In 2018, a large portion (92%) said they screened al youth on their first day at the
facility, up from 60% in 2000. These facilities accounted for 93% of youth charged
with or adjudicated for an offense held in facilities that conducted suicide screen-
ings in 2018, up from 74% in 2000.
Q An additional 6% of facilities in 2018 said they screened all youth by the end of the
first week of the youth’s stay at the facility.
Source: Authors’ analysis of the OJJDP’s
Juvenile Residential Facility Census
for 2000 and 2018 [data
files].

Youth and the Juvenile Justice System: 2022 National Report
204
Facility reported eight deaths of youth in placement over 12
months—six were suicides
Youth in residential placement
rarely died in custody
Juvenile residential facilities reported
that eight youth died while in the legal
custody of the facility between October
1, 2017 and September 30, 2018.
Routine collection of national data on
deaths of youth in residential place-
ment began with the 1988-1989 Chil-
dren in Custody (CIC) Census of Pub-
lic and Private Juvenile Detention,
Correctional and Shelter Facilities. Ac-
cidents or suicides have usually been
the leading cause of death. Over the
years 1988–1994 (CIC data reporting
years), an average of 46 deaths were
reported nationally per year, including
an annual average of 18 suicides. Over
the years 2000–2018 (JRFC data re-
porting years), those averages dropped
to 16 deaths overall and 6 suicides.
Residential treatment centers reported
three of the eight deaths in 2018—one
accidental death, one suicide, and one
resulting from an illness/natural cause.
Detention centers and training schools
accounted for two deaths each as the
result of suicides. Shelters accounted
for one of the eight deaths—a suicide.
There is no pattern in the timing of
deaths in 2018
In 2018, the timing of death varied
between 6 and 204 days after admis-
sion. Two suicides occurred about 1
week (6 days and 8 days) after admis-
sion; another occurred within 23 days.
The remaining suicides occurred 4, 6,
and 7 months after admission. One
death as a result of an illness occurred
1 month after admission. The remain-
ing death, an accident, occurred ap-
proximately 4 months (122 days) after
admission.
During the 12 months prior to the 2018 census, suicides were the
most commonly reported cause of death in residential placement
Cause
of death
Total
deaths
Deaths inside the facility Deaths outside the facility
All Public Private All Public Private
Total 8 5 2 3 3 2 1
Suicide 6 4 2 2 2 2 0
Illness/natural 1 1 0 1 0 0 0
Accident 1 0 0 0 1 0 1
Q In 2018, an equal number of deaths occurred at private facilities and public fa-
cilities—four each.
Notes: Deaths are reported deaths of youth in custody from October 1, 2017, through September
30, 2018. None of the deaths from illness were AIDS related.
Source: Authors’ analysis of OJJDP’s
Juvenile Residential Facility Census 2018
[data file].
In 2018, the death rate was higher for private facilities than for
public facilities
Characteristic
Deaths per 100,000 youth held on
the census date, October 24, 2018
Total Public facility Private facility
Cause of death
Total 2.1 1.5 4.0
Suicide 1.6 1.5 2.0
Illness/natural 0.3 0.0 1.0
Accident 0.3 0.0 1.0
Type of facility
Detention center 1.1 1.2 0.0
Shelter 9.7 0.0 15.8
Training school 2.0 2.4 0.0
Residential training center 2.1 0.0 3.9
Q The death rate in 2018 (2.1) was lower than that in 2000 (2.8). Of the 30 report-
ed deaths of youth in residential placement in 2000, accidents were the most
commonly reported cause. In 2018, suicides were most common.
Notes: Deaths are reported deaths of youth in custody from October 1, 2017, through September
30, 2018. None of the deaths from illness were AIDS related. One death was reported in a private-
ly operated shelter, but the relatively small size of the population of youth held in such facilities in
2018 (approximately 630 youth) results in a high death rate.
Source: Authors’ analysis of OJJDP’s
Juvenile Residential Facility Census 2018
[data file].

Chapter 7: Youth in corrections
205
Youth in residential placement are
at less risk of death than youth in
general
There is concern about the risk of
death to youth in residential placement
and whether that risk is greater than
the risk faced by youth in the general
population. Death rates for the general
population (detailed by age, sex, race,
ethnicity, and cause of death) can be
applied to the population of youth in
residential placement facilities to calcu-
late the number of deaths that would
be expected if the residential placement
population had the same rate of death
as the general youth population.
The number of deaths reported at ju-
venile residential facilities has decreased
from 30 in 2000 to 8 in 2018. Histori-
cally, the actual number of deaths re-
ported to JRFC were lower than the
expected number of deaths, however
this varied by cause of death.
For all years between 2000 and 2018,
the number of homicides and uninten-
tional deaths reported at facilities was
lower than the number of expected
deaths. For suicides however, the num-
ber of actual deaths reported at facili-
ties outnumbered the number of ex-
pected deaths in several years, most
notably in 2004 where the actual num-
ber of suicides was nearly three times
the expected number of suicides. As
the occurrence of suicide in facilities
has decreased since the early 2000s,
the gap between the number of actual
and expected deaths has narrowed.
For each year between 2000 and 2018,
youth at residential facilities were less
likely to die as a result of a homicide
than from an unintended/accidental
death or suicide. For most years during
the same period, unintended/acciden-
tal deaths were the leading cause of
death among youth in facilities.
Overall, the number of expected deaths exceeded the actual number of deaths reported by juvenile
residential placement facilities each year since 2000
All deaths Suicide Homicide Accident
Year Expected Actual Expected Actual Expected Actual Expected Actual
2000 56 30 8 7 19 4 29 19
2002 50 26 6 10 16 2 28 14
2004 45 27 6 16 14 2 24 9
2006 46 15 5 4 18 0 22 11
2008 37 14 5 6 14 1 16 7
2010 29 11 4 5 11 0 12 6
2012 22 14 4 5 9 2 9 7
2014 19 8 3 5 7 1 8 2
2016 20 6 3 1 8 0 8 5
2018 15 8 3 6 6 0 6 2
Q Deaths by suicide were a notable exception to the overall pattern. The actual number of suicide deaths report-
ed by facilities exceeded the expected number in all but 3 years (2000, 2006, and 2016).
Notes: Deaths are reported deaths of youth in custody from October 1 of the year before the census through September 30 of the year
of the JRFC reference date.
Source: Authors’ analysis of OJJDP’s
Juvenile Residential Facility Census
for 2000 through 2018 [data files].

Youth and the Juvenile Justice System: 2022 National Report
206
The Juvenile Residential Facility Census includes data
submitted by tribal facilities
Tribal facilities responding to the
JRFC tend to be small detention
centers owned and operated by
tribes
OJJDP works with the Bureau of Indi-
an Affairs to ensure a greater represen-
tation of tribal facilities in the CJRP
and JRFC data collections. As a result,
the 2018 JRFC collected data from 16
tribal facilities. The tribal facilities were
in Arizona, Colorado, Michigan, Min-
nesota, Mississippi, Montana, North
Dakota, Oklahoma, and South Dakota
and held 116 youth charged with or
adjudicated for an offense (up from
113 in 2016, when 14 facilities report-
ed).
Tribal facilities were asked what agency
owned and/or operated their facilities.
The tribes owned and operated 11 of
the 16 facilities. The remaining five fa-
cilities were either owned by the tribe
and operated by the federal govern-
ment or owned by the federal govern-
ment and operated by the tribe.
Compared with the nation’s reporting
about juvenile residential facilities, trib-
al facilities are small, most holding 20
or fewer residents. The majority (79%)
of youth charged with or adjudicated
for an offense were held at facilities
that held between 1 and 20 residents.
Each tribal facility identified itself as a
detention center, and one also identi-
fied itself as a training school.
Most tribal facilities were
operating under capacity
On the census day, almost all facilities
(14) were operating at less than their
standard bed capacity, and the remain-
ing 2 facilities were operating at capaci-
ty. Standard bed capacities ranged from
6 to 196; only 2 facilities had more
than 100 standard beds. This pattern
was similar for all census years prior to
2018.
The use of mechanical restraints
or locking youth in isolation rooms
is uncommon in tribal facilities
In all census years, most, if not all, re-
porting tribal facilities said they lock
youth in their rooms. Fifteen of the 16
tribal facilities reported locking youth
in their sleeping rooms in 2018.
Among tribal facilities that locked
youth in their rooms, 14 did so when
the youth were out of control. Thir-
teen facilities locked youth in their
rooms at night, 10 facilities locked
youth in rooms during shift changes,
and 8 locked youth in their rooms
whenever the youth were in their
rooms. Eight facilities locked youth in
their rooms when youth were suicidal,
and three facilities locked youth in
their rooms for part of each day. One
facility stated there was no set schedule
for locking youth in rooms.
In each JRFC collection, only a few
tribal facilities reported using either
mechanical restraints or isolation. In
2018, mechanical restraints was report-
ed by 5 of 16 tribal facilities, and 4 fa-
cilities reported locking youth alone
for more than 4 hours to regain con-
trol of unruly behavior.
Tribal facilities provide a range of
services
Fifteen of the 16 tribal facilities said
that mental health evaluations (other
than suicide risk assessments) were
provided to youth in their facilities.
Two tribal facilities reported evaluating
all youth and 13 facilities evaluated
some youth. Five facilities said that
evaluations were conducted only at an
outside location. Thirteen facilities re-
ported providing ongoing therapy ei-
ther onsite or at another location.
Of the 16 tribal facilities, all reported
assessing youth for suicide risk. Each
facility reported screening all youth
within the first 24 hours of their arrival
to the facility. Most (14) facilities said
they reassessed youth for suicide risk at
some point during the youth’s stay at
the facility; 9 reassessed youth as neces-
sary on a case-by-case basis, and 8 reas-
sessed systematically based on the
youth’s length of stay or after certain
facility events or negative life events
(such as after each court appearance,
every time the young person re-enters
the facility, or after a death in the fami-
ly).
Most (13) of the 16 facilities screening
for suicide risk used untrained staff for
those screenings, but trained screeners
were also used; 9 facilities said mental
health professionals conducted suicide
screenings, and 3 said screenings were
done by staff that were trained by a
mental health professional. All 16 facil-
ities said they took preventative mea-
sures to reduce suicide risk.
Most (10) tribal facilities said they
evaluated youth for substance abuse; 5
of those 10 said they evaluated all
youth. Five facilities said they require
youth to provide urine samples for
drug analysis. Eight of the facilities
that evaluated for substance abuse pro-
vided substance abuse services either
inside or outside the facility.
Of 13 facilities reporting education in-
formation, 11 said that all youth were
evaluated for educational needs and 2
facilities reported that some youth
were evaluated. Twelve facilities con-
ducted evaluations within one week of
the youth’s arrival at the facility. All 13
reporting tribal facilities reported that
youth attended school either inside or
outside the facility; in 11 facilities, all
youth attended school.

Chapter 7: Youth in corrections
207
In 2018, 1 in 14 adjudicated youth in state-owned or state-
operated facilities reported sexual victimization
BJS surveys provide estimates of
sexual victimization in state
juvenile facilities and in private or
local facilities under state contract
The Prison Rape Elimination Act of
2003 (PREA) requires the Bureau of
Justice Statistics (BJS) to report the in-
cidence and prevalence of sexual vio-
lence in adult and juvenile correctional
facilities. In response, BJS developed
the National Survey of Youth in Cus-
tody (NSYC). To date, three waves of
the NSYC have been administered:
2008–2009 (NSYC-1), 2012 (NSYC-
2), and 2018 (NSYC-3).
The NSYC is based on interviews of
adjudicated youth in state-owned or
state-operated juvenile facilities and lo-
cally or privately operated facilities that
hold adjudicated youth under state
contract. The surveys included only fa-
cilities that hold adjudicated youth for
at least 90 days, with more than 25%
of residents adjudicated, and with at
least 10 adjudicated youth. Youth in-
terviews are conducted via audio com-
puter-assisted self-interview methodol-
ogy. The reference period for the
NSYC is the past 12 months, or since
the date of admission for youth who
had been in the facility less than 12
months.
The 2018 NSYC administered the sex-
ual victimization survey to a national
sample of 6,049 youth in 327 eligible
facilities, representing 12,750 adjudi-
cated youth held nationwide. Compar-
atively, the 2012 NSYC sexual victim-
ization survey was administered to
8,707 youth in 326 eligible facilities,
representing 18,140 adjudicated youth
nationwide.*
Sexual victimization declined
significantly between 2012 and
2018
The overall rate of sexual victimization
reported by adjudicated youth in juve-
nile facilities decreased from 9.5% in
2012 to 7.1% in 2018, as did the rate
of youth-on-youth victimization (from
2.5% to 1.9%) and staff sexual miscon-
duct (from 7.7% to 5.8%). Between the
2012 and 2018 NSYC collections, the
estimated number of youth reporting
sexual victimization fell 48%, from
1,720 to 900 victims.
In both 2012 and 2018, more than
80% of sexually victimized youth re-
ported events that NSYC defines as
staff sexual misconduct (5.8% of 7.1%
in 2018 and 7.7% of 9.5% in 2012).
More than 60% of these youth victims
of staff sexual misconduct described
events that did not involve any report-
ed force or coercion. It is worth noting
that, among youth victims of staff sex-
ual misconduct, the proportion of vic-
tims reporting force or coercion fell
from 45% in 2012 to 36% in 2018.
The majority of sexually victimized
youth described explicit sexual acts in-
volving the genitalia or anus in both
2012 and 2018.
Among youth reporting youth-on-
youth victimization, 33% of youth vic-
tims indicated they were threatened
with physical harm, 22% reported
being held down or restrained, and
22% indicated they were threatened
with a weapon. Comparatively, among
youth reporting staff sexual miscon-
duct involving pressure or coercion,
13% reported being threatened with
physical harm, 10% reported being
held down or restrained, and 13% re-
ported being threatened with a weap-
on. Nearly one-fourth (24%) of youth-
on-youth victims indicated the event
took place in their rooms, while 36%
reported that the incident took place in
other common areas on facility
grounds, such as the yard/recreation
area, classroom, library, or workshop.
* The 30% drop in the NSYC estimated adju-
dicated youth population in state facilities be-
tween 2012 and 2018 is consistent with the
36% drop in the committed population seen
between 2011 and 2017 in OJJDP’s Census
of Juveniles in Residential Placement data col-
lection.
How BJS measures sexual
victimization in NSYC
As defined in the NSYC, sexual vic-
timization involves any forced or co-
erced sexual activity with another
youth and any sexual activity with
facility staff, regardless of whether
the act was completed. NSYC fur-
ther classifies sexual victimization
into two categories of youth-on-
youth sexual acts and four catego-
ries involving sexual acts between
staff and youth, distinguishing these
categories by use of force and by
the nature of the sexual acts in-
volved.
Force. NSYC defines force broadly,
including physical force, threat of
force, other force or pressure, and
other forms of coercion, such as re-
ceiving money, favors, protection,
or special treatment.
Explicit sexual acts involving geni-
talia or anus. Includes all contact
involving the penis, vagina, or anus,
regardless of penetration.
Other sexual contacts only. In-
cludes kissing, touching (excluding
any touching involving the penis,
vagina, or anus), looking at private
parts, displaying sexual material,
such as pictures or a movie, and
engaging in some other sexual con-
tact that did not include touching.
Youth-on-youth sexual victimiza-
tion. All youth-on-youth sexual vic-
timization must involve some form
of force. NSYC defines two catego-
ries: explicit sexual acts and other
sexual contacts only.
Staff sexual misconduct. Staff-and-
youth sexual activity is divided into
acts that involved force and acts
without force. Each of these cate-
gories is further divided into the na-
ture of the sexual activity involved:
explicit sexual acts and other sexual
contacts only.

Youth and the Juvenile Justice: 2022 National Report
208
For youth victims of staff sexual mis-
conduct, nearly one-third (32%) re-
ported the incident took place in their
room, and 21.5% reported the incident
took place in other common areas on
facility grounds.
Sexual victimization rates differed
by youth characteristics and
experiences
While the overall sexual victimization
rates in 2018 were similar for males
and females (7.1% and 6.6%, respec-
tively), males were much less likely to
report youth-on-youth victimization
than males (1.6% vs. 4.7%). In con-
trast, males were more likely to report
staff sexual misconduct than their fe-
male counterparts (6.1% vs. 2.9%). For
Changes to the sample
between NSYC-2 and NSYC-3
The total number of state-owned
and -operated juvenile residential
facilities and the number of youth
being held in them declined be-
tween administration of the 2012
NSYC-2 and the 2018 NSYC-3,
while the number of locally or pri-
vately owned contract facilities in-
creased. As a result of this change,
the 2018 NSYC-3 sample included
a larger number of locally or pri-
vately operated contract facilities
than the 2012 NSYC-2.
To assess the impact of the differ-
ences between the 2012 and 2018
samples, BJS analyzed data from
states with contract facilities that
were sampled in both data collec-
tions. Their analysis showed that
the overall rate of sexual victimiza-
tion reported by youth had declined
from an estimated 9.5% in 2012 to
7.2% in 2018. Comparatively, the
estimated rate of sexual victimiza-
tion using the full 2018 sample (i.e.,
not limited to the same contract fa-
cilities included in 2012) was 7.1%,
suggesting that the sample design
had little impact on the overall esti-
mate of sexual victimization of
youth in juvenile confinement facili-
ties. Similarly small differences were
found between 2012 and 2018 esti-
mates for youth-on-youth and staff
sexual misconduct. As such, 2018
estimates are based on state-
owned and -operated juvenile resi-
dential facilities, and the full com-
plement of contract facilities
included in the 2018 sample.
both male and female victims, the ma-
jority of staff sexual misconduct report-
ed by youth involved sexual acts, that
is, sexual activity that involved touch-
ing or penetrating of sexual body parts.
Although the overall sexual victimiza-
tion rate was greatest for 16-year-olds,
differences between age groups were
not significant. This pattern was repli-
cated among victims of staff sexual
misconduct and youth-on-youth vic-
timization—the lone exception being
that 17-year-olds were more likely than
youth age 18 or older to report youth-
on-youth victimization.
Overall, White youth were more likely
to report youth-on-youth and staff sex-
ual misconduct than Hispanic youth,
Between 2012 and 2018, the proportion of youth reporting sexual
victimization declined
Percent of youth reporting
sexual victimization*
Type of incident 2018 2012
Total sexual victimization 7.1%** 9.5%
Youth-on-youth sexual victimization 1.9** 2.5
Forced or coerced sexual acts 1.2 1.7
Other forced or coerced sexual activity 0.5 0.6
Unknown type of forced or coerced
sexual activity 0.2 0.3
Staff sexual misconduct 5.8** 7.7
Forced or coerced reported 2.1** 3.5
Sexual acts 1.8** 3.1
Other sexual activity 0.2 0.2
Unknown type of sexual activity 0.1 0.2
No report of force or coercion 3.9 4.7
Sexual acts 3.6 4.3
Other sexual activity 0.3 0.4
Estimated number of adjudicated youth 12,750 18,140
Estimated number reporting sexual victimization 900 1,720
* Reporting period is in the past 12 months, or since admission to the facility if the youth had been
in the facility less than 12 months.
** Difference with the 2012 group is significant at the 95% confidence level.
Note: Details do not sum to the total because of rounding and because a small proportion of youth
in both years reported more than one type of victimization.
Source: Authors’ adaptation of Smith and Stroop’s
Sexual Victimization Reported by Youth in Juve-
nile Facilities, 2018
.

Chapter 7: Youth in corrections
209
and more likely than Black youth to re-
port youth-on-youth victimization. In
fact, rates for White youth were about
twice the rates of Hispanic and Black
youth for both types of sexual victim-
ization.
Youth-on-youth victimization
varied according to sexual
orientation and gender identity
Overall, youth who described their sex-
ual orientation as non-heterosexual
were nearly twice as likely to report
sexual victimization as youth who de-
scribed themselves as heterosexual
(12.0% vs. 6.5%); for youth-on-youth
victimization, rate differences were
more substantial (8.4% vs. 1.1%). Simi-
larly, youth who described their gender
identity as different from their gender
recorded at birth were nearly 3 times
more likely (19.1% vs. 6.8%) to report
any sexual victimization and nearly 9
times more likely (14.3% vs. 1.6%) to
report youth-on-youth victimization
than their peers who identify as the
same gender as recorded at birth.
The NSYC also found that youth who
reported sexual victimization in the
past were more likely to be victims in
their current facility. For example
among youth who had experienced
prior sexual victimization in another fa-
cility, more than half (51.0%) reported
sexual victimization in 2018, and
among youth who had experienced no
prior victimization, 5.9% reported sex-
ual victimization in 2018. Sexual vic-
timization was also related to a youth’s
time in the facility, with longer expo-
sure times associated with higher vic-
timization rates. This pattern was true
both for youth-on-youth victimizations
(3.1% for youth in the facility a year or
more vs. 1.2% for youth in the facility
less than 6 months) and for incidents
of staff sexual misconduct (9.3% for
youth in the facility a year or more vs.
4.1% for youth in the facility less than
6 months).
Sexual victimization rates were related to youth characteristics,
particularly gender, sexual orientation, and gender identity
Percent of youth reporting
Victim demographic
Any sexual
victimization
Youth-on-
youth
victimization
Staff sexual
misconduct
Gender
Male* 7.1% 1.6% 6.1%
Female 6.6 4.7** 2.9**
Age
14 or younger 4.4 2.3 3.2
15 5.9 1.6 4.8
16 8.2 2.4 6.8
17 7.3 2.4** 5.7
18 or older* 7.1 1.3 6.1
Race/ethnicity
White, non-Hispanic* 8.5 3.1 6.3
Black, non-Hispanic 7.3 1.2** 6.7
Hispanic 4.1** 1.0** 3.2**
Other, non-Hispanic 4.7 1.9 3.8
Two or more, non-Hispanic 6.8 2.4 4.0
Sexual orientation
Heterosexual* 6.5 1.1 5.9
Lesbian/gay/bisexual/something
else 12.0** 8.4** 5.5
Not sure 6.2 5.0** 4.7
Gender identity
Same as gender recorded at birth* 6.8 1.6 5.7
Different from gender recorded at birth 19.1** 14.3** 8.1
Not sure 26.8** 19.3** 10.8
Time in current facility
Less than 6 months 4.9** 1.2** 4.1**
6–11 months 8.3 2.4 6.6
12 months or more* 11.3 3.1 9.3
Sexual victimization in lifetime prior to
entering current facility
Prior sexual victimization in another
facility 51.0** 33.2** 30.3**
Prior sexual victimization but not in
another facility 8.7** 3.6** 5.5
No prior sexual victimization* 5.9 1.0 5.3
* Comparison groups.
** Difference with comparison group is significant at the 95% confidence level.
Notes: Youth-on-youth victimization and staff sexual misconduct may not sum to any sexual vic-
timization because some youth reported both types of victimization.
Source: Authors’ adaptation of Field and Davis’
Sexual Victimization Reported by Youth in Juvenile
Facilities, 2018 Statistical Tables
.

Youth and the Juvenile Justice System: 2022 National Report
210
In 2019, the number of youth younger than 18 held in adult
jails reached its lowest level since the early 1990s
Youth younger than 18 accounted
for about 1% of all jail inmates
According to the Bureau of Justice Sta-
tistics, an estimated 2,300 youth
younger than 18 were held in adult
jails on June 30, 1990. The 1-day
count of jail inmates younger than 18
rose to a peak of 9,500 in 1999, de-
clined through 2006, then rose again
through 2010. Since 2010, the count
fell 62%, reaching a level in 2019
(2,900) that was 69% below the 1999
peak. These youth accounted for about
0.5% of the total jail population in
2019, down from 1% in 2010. Since
1990, inmates younger than 18 have
not exceeded 2% of the jail inmate
population.
The vast majority of jail inmates
younger than 18 continues to be those
held as adults. Youth younger than 18
may be held as adults if they are con-
victed or awaiting trial in criminal
court, either because they were trans-
ferred to criminal court or because
they are in a state that considers all
17-year-olds (or all 16- and 17-year-
olds) as adults for purposes of criminal
prosecution.
The Juvenile Justice and Delinquency Prevention Act limits the placement of juveniles in adult
facilities
The Act states that “ … juveniles al-
leged to be or found to be delin-
quent,” as well as youth charged with
status offenses and those not ac-
cused of any offense “will not be de-
tained or confined in any institution in
which they have contact with adult
inmates ….” This provision of the Act
is commonly referred to as the “sight
and sound separation requirement.”
Subsequent regulations implementing
the Act clarify this requirement and
provide that brief and inadvertent
contact in nonresidential areas is not
a violation. The Act also states that
“ … no juvenile shall be detained or
confined in any jail or lockup for
adults ….” This provision is known as
the “jail and lockup removal require-
ment.” Regulations exempt youth
who have been convicted in criminal
court from the jail and lockup removal
requirement. Revisions passed in
2018 require that, as of December
21, 2021, unless a court holds a hear-
ing and finds that it is “in the interest
of justice,” youth awaiting trial having
been charged as adults for the pur-
pose of prosecution in criminal court
shall not have sight or sound contact
with adult inmates and may not be
held in an adult jail or lockup. The def-
inition of “adult” in the new statute is
tied to each state’s age of criminal re-
sponsibility and extended age of juris-
diction. There is an exception if a
court holds a hearing and finds that
holding the youth in an adult facility is
“in the interest of justice.” If the court
allows the youth held in jail, a review
hearing must be held every 30 days
with a 180-day maximum.
In institutions other than adult jails or
lockups or in jails and lockups under
temporary hold exceptions, confine-
ment of youth charged with delinquen-
cy offenses is permitted if youth and
adult inmates cannot see each other
and no conversation between them is
possible. This reflects the sight and
sound separation requirement.
Some temporary hold exceptions to
jail and lockup removal include: a
6-hour grace period that allows adult
jails and lockups to hold youth
charged with delinquency offenses in
secure custody until other arrange-
ments can be made (including 6 hours
before and after court appearances)
and a 48-hour exception, exclusive of
weekends and holidays, for rural facili-
ties that meet statutory conditions.
Some jurisdictions have established
juvenile detention centers that are col-
located with adult jails or lockups. A
collocated juvenile facility must meet
specific criteria to establish that it is a
separate and distinct facility. The regu-
lations allow time-phased use of pro-
gram areas in collocated facilities.
1995 1999 2003 2007 2011 2015 2019
0
2,000
4,000
6,000
8,000
10,000
Inmates in adult jails
Younger than 18
1995 1999 2003 2007 2011 2015 2019
0%
20%
40%
60%
80%
100%
Percent of jail inmates younger than 18
Held as adults
On a typical day in 2019, about 2,900 persons younger than 18 were
inmates in jails in the U.S.
Q Following a 62% decline since 2010, the number of jail inmates younger than 18 in
2019 was at its lowest level since the early 1990s.
Q Between 1993 and 2019, the proportion of jail inmates younger than 18 who were
held as adults ranged between 70% and 91%; in 2019, 76% of inmates younger
than 18 were held as adults.
Source: Authors’ analyses of Gillard’s
Prison and Jail Inmates at Midyear 1998
; Beck’s
Prison and Jail
Inmates at Midyear 1999
; Beck, Karberg, and Harrison’s
Prison and Jail Inmates at Midyear 2001
; Har-
rison and Karberg’s
Prison and Jail Inmates at Midyear 2003
; Harrison and Beck’s
Prison and Jail In-
mates at Midyear 2004
; Minton’s
Jail Inmates at Midyear 2010 —Statistical Tables
; Minton and Zeng’s
Jail Inmates in 2015
; and Zeng and Minton’s
Jail Inmates in 2019
.

Chapter 7: Youth in corrections
211
Between 2000 and 2019, the number of youth younger than
18 in state prison decreased more than 80%
The number of youth under age
18 in state prisons reached a new
low in 2019
Based on data from the Bureau of Jus-
tice Statistics’ National Prisoner Statis-
tics (NPS) program, 626 youth young-
er than age 18 were held in state
prisons on December 31, 2019. The
number of youth in state prisons in
2019 was well below (84%) the level in
2000, when nearly 4,000 youth were
in state prison on the last day of the
year. The number of youth in state
prisons in 2019 accounted for 0.05%
of the state prison population in that
year—or 1 of every 2,000 persons in a
state prison.
While the number of youth younger
than 18 in adult prisons decreased by
an average of 11% each year from 2000
to 2005, the total prison population
remained relatively constant, increasing
an average of 1% each year. After a pe-
riod of increase through 2009, the
number of youth in adult prisons de-
creased an average of 13% per year
from 2009 to 2019.
Prisons differ from jails
Jails are generally local correctional
facilities used to incarcerate both
persons detained pending adjudica-
tion and adjudicated/convicted of-
fenders. Convicted inmates are
usually misdemeanants sentenced
to a year or less. Under certain cir-
cumstances, jails may hold juveniles
awaiting juvenile court hearings.
Prisons are state or federal facilities
used to incarcerate offenders con-
victed in criminal court; these con-
victed inmates are usually felons
sentenced to more than a year.
0
500
1,000
1,500
2,000
2,500
3,000
3,500
4,000
One-day count of persons held in state prisons
Younger than 18
2001 2003 2005 2007 2009 2011 2013 2015 2017 2019
The 1-day count of youth younger than 18 in state prisons at yearend
2019 was 84% below the level in 2000, while the count for adults ages
18 or older in 2019 was about the same as in 2000
2001 2003 2005 2007 2009 2011 2013 2015 2017 2019
0
200,000
400,000
600,000
800,000
1,000,000
1,200,000
1,400,000
1,600,000
One-day count of persons held in state prisons
Ages 18 and older
Q The number of youth in state prisons decreased 43% between 2000 and 2005, then
increased 24% through 2009. Since 2009, however, the number of youth in state
prison decreased considerably, falling 77% through 2019
Q The number of adults ages 18 and older in state prisons increased 13% between
2000 and 2009, the fell 11% through 2019. The net result was that number of
adults in state prisons at the end of 2019 was 1% above the number in 2000.
Source: Authors’ analysis of the Bureau of Justice Statistics’
Corrections Statistical Analysis Tool
[on-
line data analysis tool].

Youth and the Juvenile Justice System: 2022 National Report
212
Sources
Beck, A. 2000.
Prison and Jail Inmates
at Midyear 1999
. Washington, DC:
U.S. Department of Justice, Office of
Justice Programs, Bureau of Justice
Statistics.
Beck, A., Cantor, D., Hartge, J., and
Smith, T. 2013.
Sexual Victimization
in Juvenile Facilities Reported by
Youth, 2012
. Washington, DC: U.S.
Department of Justice, Office of Jus-
tice Programs, Bureau of Justice Statis-
tics. Available online at www.bjs.gov/
content/pub/pdf/svjfry12.pdf.
Beck, A., Karberg, J., and Harrison, P.
2002.
Prison and Jail Inmates at Mid-
year 2001
. Washington, DC: U.S. De-
partment of Justice, Office of Justice
Programs, Bureau of Justice Statistics.
Bureau of Justice Statistics. Reported
number of inmates age 17 or younger
held in custody in federal or state pris-
ons, December 31, 2000–2019. Gen-
erated using the Corrections Statistical
Analysis Tool at www.bjs.gov.
Bureau of Justice Statistics. Prisoners
under the jurisdiction of state or feder-
al correctional authorities, December
31, 1978–2019. Generated using the
Corrections Statistical Analysis Tool
at
www.bjs.gov.
Field, M., and Davis, E. 2020. Victim,
Perpetrator, and Incident Characteris-
tics of Sexual Victimization of Youth in
Juvenile Facilities, 2018 – Statistical
Tables. Washington, DC: U.S. Depart-
ment of Justice, Office of Justice Pro-
grams, Bureau of Justice Statistics.
Available online at www.bjs.gov/
content/pub/pdf/vpicsvyjf18st.pdf.
Gillard, D. 1999.
Prison and Jail In-
mates at Midyear 1998
. Washington,
DC: U.S. Department of Justice, Of-
fice of Justice Programs, Bureau of
Justice Statistics.
Harrison, P., and Beck, A. 2005.
Pris-
on and Jail Inmates at Midyear 2004
.
Washington, DC: U.S. Department of
Justice, Office of Justice Programs, Bu-
reau of Justice Statistics.
Harrison, P., and Karberg, J. 2004.
Prison and Jail Inmates at Midyear
2003.
Washington, DC: U.S. Depart-
ment of Justice, Office of Justice Pro-
grams, Bureau of Justice Statistics.
Minton, T. 2011.
Jail Inmates at Mid-
year 2010—Statistical Tables
. Washing-
ton, DC: U.S. Department of Justice,
Office of Justice Programs, Bureau of
Justice Statistics.
Minton, T. and Zeng, Z. 2016.
Jail In-
mates in 2015
. Washington, DC: U.S.
Department of Justice, Office of Jus-
tice Programs, Bureau of Justice Statis-
tics.
Office of Juvenile Justice and Delin-
quency Prevention. Various.
Census of
Juveniles in Residential Placement
for
1997, 1999, 2001, 2003, 2006, 2007,
2010, 2011, 2013, 2015, 2017, and
2019 [data files]. Washington, DC:
U.S. Census Bureau [producer].
Office of Juvenile Justice and Delin-
quency Prevention. Various.
Juvenile
Residential Placement Census
for
1998, 2000, 2002, 2004, 2006, 2008,
2010, 2012, 2014, 2016, and 2018
[data files]. Washington, DC: U.S.
Census Bureau [producer].
Smith, E., and Stroop, J. 2019.
Sexual
Victimization Reported by Youth in
Juvenile Facilities, 2018
. Washington,
DC: U.S. Department of Justice, Of-
fice of Justice Programs, Bureau of
Justice Statistics. Available online at
www.bjs.gov/content/pub/pdf/
svryjf18.pdf.
Zeng, Z., and Minton, T. 2021.
Jail
Inmates in 2019
. Washington, DC:
U.S. Department of Justice, Office of
Justice Programs, Bureau of Justice
Statistics.

National Council of Juvenile
and Family Court Judges
ncjfcj.org
The NCJFCJ is one of the largest and oldest
judicial membership organizations in the
nation, serving an estimated 30,000 juvenile
and family justice system professionals,
including judges, referees, commissioners,
court masters and administrators, social and
mental health workers, police, and probation
officers.
For those involved with juvenile, family, and
domestic violence cases, the NCJFCJ provides
the resources, knowledge, and training to
improve the lives of families and children
seeking justice. NCJFCJ resources include:
Q Cutting-edge training
Q Wide-ranging technical assistance
Q Research to assist family courts
Q Advanced degree programs for judges and
other court professionals, offered in con-
junction with the University of Nevada,
Reno, and the National Judicial College
.
Online resources
OJJDP’s Online Statistical Briefing Book
ojjdp.gov/ojstatbb
The fastest path to the latest statistical information on:
Offending by youth
Victimization of youth
Youth in the juvenile justice system
The Statistical Briefing Book makes it easy for policymakers, juvenile justice
practitioners, the media, and the general public to access infor
mation on
topics that mir
ror the major sections of
Youth and the Justice System: 2022
National Report
.
Q Find timely, reliable answers to frequently asked questions.
Q With “Easy Access” tools and downloadable spreadsheets, create your
own national, state, and county tables on juvenile populations, arr
ests,
court cases, and custody populations.
Q Link to more than 25 web-based resources.
Q Search OJJDP’s online library of hundreds of statistical publications.
Make the Statistical Briefing Book your first stop for statical infor
mation on
juvenile justice.
n
:
National Center for Juvenile Justice
ncjj.org
NCJJ’s website describes its research activities, servic-
es, and publications, featuring links to project-sup-
ported sites and data resources, including OJJDP’s
Statistical Briefing Book, the National Juvenile Court
Data Archive, and the Juvenile Justice Geography,
Policy, Practice & Statistics website.
National Juvenile Court Data Archive
ojjdp.gov/ojstatbb/njcda
The National Juvenile Court Data Archive (Archive)
houses the automated records of cases handled by
courts with juvenile jurisdiction and provides juvenile
justice professionals, policymakers, researchers, and the
public with the most detailed information available on
the activities of the nation’s juvenile courts.
Q The Archive website informs researchers about the
available data sets and the procedures for use and
access, and provides variable lists and user guides for
the data sets.
Q Easy Access tools give users
access to national estimates on
more than 48 million delin-
quency cases processed by the
nation’s juvenile courts since
1985 and to state and county
juvenile court case counts.
Q Links to publications using
Archive data, including
the annual
Juvenile
Court Statistics
reports.
jjgps
Juvenile Justice
Geography, Policy, Practice & Statistics
JJGPS.org
Juvenile Justice GPS (Geography, Policy, Practice, & Statistics) is an online repository
providing state policymakers and system stakeholders with a clear understanding of the
juvenile justice landscape in the states.
The site layers the most relevant national and state level statistics with information on
state laws and practice and charts juvenile justice system change. In a landscape that is
highly decentralized and ever-shifting, JJGPS provides an invaluable resource for those
wanting to improve the juvenile justice system. The content of the website is assembled
from one of four sources:
Q Legal research based upon state policies as they are contained in statutes, court rules,
and case laws
Q Practice scans based on interviews and surveys of juvenile justice stakeholders
Q National scans based on web searches for descriptive data published by state agencies
that help illuminate JJGPS r
efor
m topics
Q Strategic overlays of data that are standardized at the national level in ongoing data
collections.
s
on
-
th
e
ce
n
ty

