
A Year in Review: 2020 Gun Deaths in the U.S. 1
A Year in Review
2020 GUN DEATHS IN THE U.S.
T
he Johns Hopkins Center for Gun Violence Solutions
April 28, 2022

A Year in Review: 2020 Gun Deaths in the U.S. 2
Contents
About This Report........................................................................ 3
Introduction 4.............................................................................
An Overview of U.S. Gun Deaths in 2020 5....................................................
Gun Deaths Over Time 7....................................................................
2019–2020: A One-Year Spike in Gun Violence
..
............................................7
Gun Deaths Over the Last 40 Years 7.........................................................
Policy Recommendations 9.................................................................
The Lethality and Availability of Firearms 11.................................................
Homicides 11..............................................................................
Suicides 12................................................................................
The Burden of Gun Violence Relative to Other Injuries and Diseases 13..........................
A Leading Cause of Death Among Young People 13............................................
Firearm Fatalities Compared to Other Forms of Fatal Injuries 14.................................
Firearm Fatalities Compared to Car Crashes 15................................................
Gun Deaths by Demographic Groups 17......................................................
Gun Violence Rates Across States 23.........................................................
A Closer Look: Gun Violence by Intent Across Counties and Urbanization Levels 26...............
Conclusion 28.............................................................................
Appendices 29.............................................................................
Appendix 1: Gun Deaths, 2020 29............................................................
Appendix 2: Gun Deaths Among Children and Teens, 2020 29...................................
Appendix 3: Average Number of Gun Deaths, 2016–2020 ....................................29
Appendix 4: Average Number of Gun Deaths Among Children and Teens, 2016–2020. .........
.30
Appendix 5: United States Gun Deaths by Intent, 2011–2020. .....
......................... .30
Appendix 6: United States Gun Death Rates, by Intent, 2011–2020 ............................31
Appendix 7: United States Gun Death Numbers by Demographic Groups, 2020 . . . . . . . . . . . . . . . . 32
Appendix 8: United States Gun Death Rates by Demographic Groups, 2020 ................... 33
Appendix 9: State Variations, 2020 ......
..................................................34
Appendix 10: Top 5 Counties With the Highest Firearm Homicide Rate, 2016–2020. ............36
Appendix 11: Top 5 Counties With the Highest Firearm Suicide Rate, 2016–2020 ...............
36
Appendix 12: Top 5 Counties With the Highest Firearm Death Rate, 2016–2020 ...............
.36
Appendix 13: Rise in Gun Homicides by State, 2019–2020. .........
......................... 37
G
lossary ...............................................................................39

A Year in Review: 2020 Gun Deaths in the U.S. 3
About this Report
About the Johns Hopkins Center for Gun Violence Solutions
Two leading organizations dedicated to gun violence prevention—the Johns Hopkins Center for
Gun Violence Prevention and Policy and the Educational Fund to Stop Gun Violence—have merged
to form a new center at the Johns Hopkins Bloomberg School of Public Health, the Johns Hopkins
Center for Gun Violence Solutions.
The Johns Hopkins Center for Gun Violence Solutions combines the expertise of highly respected gun
violence researchers with the skills of deeply experienced gun violence prevention advocates. We
use a public health approach to conduct rigorous scientific research to identify a range of innovative
solutions to gun violence. Because gun violence disproportionately impacts communities of color,
we ground our work in equity and seek insights from those most impacted on appropriate solutions.
Using the best available science, our Center works toward expanding evidence-based advocacy and
policy-making eorts. This combination of expertise creates a unique opportunity to turn public
health research into action that reduces deaths and injuries from gun violence.
Report Authors:
Ari Davis, MPP
Lisa Geller, MPH
Rose Kim, MPA
Silvia Villarreal, MPP
Alexander McCourt, JD, PhD, MPH
Janel Cubbage, MS, LCPC
Cassandra Crifasi, PhD, MPH
The Center for Gun Violence Solutions would like to thank Lauren Footman, MS, for her equity
reviews, as well as Spencer Cantrell, JD, for her contributions to this report. We would also like to
acknowledge staff and former staff of the Educational Fund to Stop Gun Violence who led similar
reports analyzing 2019 and 2018 CDC data, including Vicka Chaplin and Dakota Jablon, and who
created the foundation from which much of this report is based.
How to Cite This Report
Johns Hopkins Center for Gun Violence Solutions. (2022). A Year in Review: 2020 Gun Deaths in the
U.S. Available: https://publichealth.jhu.edu/gun-violence-solutions.
Data Source
This report outlines gun death data from 2020, the most recent year of data available. The purpose of
the report is to share data in an accessible and user-friendly format. All data were accessed using the
Centers for Disease Control’s Underlying Cause of Death database, part of the Wide-ranging Online
Data for Epidemiologic Research (WONDER) database. The Underlying Cause of Death database
contains data based on death certificates for United States residents. If while reading through this
report, you have questions about any of the data or would like to learn more about specific aspects of
the data that are not included in this report, please reach out to the team at the Center for Gun

A Year in Review: 2020 Gun Deaths in the U.S. 4
I
ntroduction
Gun violence is an ongoing public health crisis in the United States that impacts the health and
well-being of all of us. In 2020, gun deaths reached the highest number ever recorded. According
to data released by Centers for Disease Control and Prevention (CDC), more than 45,000 people
died by gun violence in the U.S. As we struggled against the COVID-19 pandemic, a concurrent
public health crisis intensified. Gun homicides rose dramatically across the country, increasing by
35% in just one year. Nearly 5,000 more lives were lost to gun homicide in 2020 than in 2019. Gun
suicides remained at historically high levels. Guns were the leading cause of death among children
and teens in 2020, accounting for more deaths than COVID-19, car crashes, or cancers.
1
Coincident with the rise in gun-related deaths, 2020 was also a year of record gun sales. Millions of
people, including many first-time purchasers, bought guns. Tens of thousands of these new guns
turned up at crime scenes across the country—almost twice as many as in 2019.
2
While it remains
to be seen whether this surge in gun purchases contributed to the rise in gun violence over the
long term, a strong body of research has identified drivers of gun violence—namely, easy access to
guns and weaknesses in our country’s laws that create a patchwork of gun regulations.
There are equitable, evidence-based solutions to prevent gun violence. These solutions are
supported by most people, including gun owners. In spite of their wide support, many policymakers
have been unwilling to follow the evidence and enact policies that will save lives.
The aim of this report is to illustrate the enormous toll gun violence has on our country. Ultimately,
we strive to use these data to advocate for and implement life-saving policies and programs that
will end the gun violence epidemic. This report builds o of “A Public Health Crisis Decades in the
Making: A Review of 2019 CDC Gun Mortality Data” released by the Educational Fund to Stop Gun
Violence in February 2021. Each year it is our mission to provide policymakers and the public the
most accurate and up-to-date data on gun fatalities.
This year’s report uses the CDC’s 2020 firearm fatality data, which only became available in late
December 2021—an unacceptable delay that hampers potential responses to gun violence. We cannot
solve a problem we cannot quantify. Without timely data, we lack the information we need to make the
best possible decisions. Data collection and reporting related to gun violence must be more timely.
We recognize that each data point discussed in this report is a person whose life was lost to gun
violence. This loss has an immeasurable impact on the families, friends, and communities; and data
can only partly illuminate the true burden of gun violence. In addition to analyzing the data we must
listen to and uplift the voices of those directly impacted by gun violence, their loved ones, and their
communities.
Yet even on its own, the 2020 CDC data paint an alarming picture of the epidemic of gun violence.
It illustrates how people from all walks of life are impacted. These deaths, and the associated pain
and suering, can be prevented. By leveraging the data outlined in this report, we can improve gun
violence prevention strategies and create a more peaceful future, free from gun violence.
1 Provisional death counts for Coronavirus disease 2019 (COVID-19). (2022). National Center for Health Statistics. Available: https://www.cdc.
gov/nchs/nvss/vsrr/covid_weekly/index.htm#SexAndAge
2 Barton C. (2021). New data suggests a connection between pandemic gun sales and increased violence. The Trace. Available: https://www.
thetrace.org/2021/12/atf-time-to-crime-gun-data-shooting-pandemic/

A Year in Review: 2020 Gun Deaths in the U.S. 5
An Overview of U.S. Gun Deaths in 2020
Gun violence was a leading cause of death in 2020. On average, 124 individuals died from gun
violence every day in 2020, an additional 15 more gun deaths per day than in 2019. The overall
gun death rate increased by 15% from 2019 reaching the highest level ever recorded. This
increase was driven by a dramatic rise in gun homicides—nearly 5,000 more gun homicides than
in 2019—and persistently high numbers of gun suicides.
Fiv
e Fast Facts for Firearm Fatalities in 2020
There were
45,222
gun deaths in the U.S.
The highest number of gun
deaths ever in the U.S.
Gun violence has a
disproportionate impact
Black males ages 15–34 were over
20x
more likely to be a
victim of gun homicide
than their white counterparts
Gun deaths increased from 2019 to 2020
Firearm homicides
increased by 35%
For the second time in three years, more
than 24,000 people died by gun suicide
States with stronger
gun laws have lower rates
of gun violence
Someone living in Mississippi was
8.5x
more likely to die
by gun violence
than someone living in Hawaii
LAWS
GUN VIOLENCE
LAWS
GUN VIOLENCE
Gun violence was the leading cause of death among
children, teens, and young adults under the age of 25
Young people under 30 were nearly 10 times more
likely to die by firearm than from COVID-19 in 2020

A Year in Review: 2020 Gun Deaths in the U.S. 6
Each one of these dots represents
a life lost to gun violence in 2020.
SUICIDE: 24,292
HOMICIDE: 19,384
UNINTENTIONAL ACCIDENTAL : 535
LEGAL INTERVENTION: 611*
UNDETERMINED INTENT: 400
TOTAL GUN DEATHS: 45,222
Note: * The CDC data classification “legal intervention” under-counts police-involved gun fatalities. To address this gap,
media sources like the Washington Post’s Fatal Force database have tracked police-involved shootings in recent years,
reporting that 1,021 people were shot and killed by police in 2020.

A Year in Review: 2020 Gun Deaths in the U.S. 7
Gun Deaths Over Time
2019
–2020: A One-Year Spike in Gun Violence
In 2020, gun deaths in the U.S. reached the highest level ever recorded—driven by a dramatic rise in
gun homicides. In 2020, more than 45,000 people died from gun violence. The increase coincided with
a number of unique factors, including COVID-19, record increases in gun sales, widespread social unrest
in the aftermath of George Floyd’s murder, and deep political divisions further exacerbated by attempts
to overturn an election.
QUICK TAKEAWAYS:
• Firearm homicides increased by nearly 5,000 deaths, or 35%, from 2019 to 2020. The firearm
homicide spike was experienced in communities across the country—both rural and urban.
• The overall gun death rate among children and teens under age 19 increased by 30%—this
increase was driven by a dramatic (40%) increase in the gun homicide rate and 11% increase in
the gun suicide rate.
• There was a 47% increase in the firearm homicide rate among Black women from 2019 to 2020.
• The rate of gun suicides was the second highest in three decades, and 2020 was only the second
time ever there were over 24,000 gun suicides.
Domestic Violence, Firearms, and COVID-19
Domestic violence has been deemed the “pandemic within a pandemic.”
3
During COVID-19 lockdowns,
victims and survivors of domestic violence faced unique vulnerabilities as they were quarantined with their
abusers, including being unable to access the safety planning, victim advocacy, counseling, shelter, or legal
services they would have traditionally relied on to escape abusive situations. The added stressors of the
pandemic, including economic stressors and isolation, often caused abuse to further escalate. Research
shows that access to firearms is one of the primary predictors of lethality in abusive relationships, and even
when not used fatally, firearms are a tool for ongoing coercive control and threats. While the CDC data do
not show how many of the gun violence deaths were related to domestic violence, studies show that there
was an increase in domestic violence during the COVID-19 epidemic.
4
FBI data from 2020 show that over
1,400 individuals were murdered by current or former dating partners or spouses.
5
More information on
the intersection of domestic violence and firearms is available at www.disarmdv.org.
Gun Deaths Over the Last 40 Years
The crisis of gun violence in the United States is not new. For over four decades, people have suered
from persistently high gun death rates. Over this time, 1,357,000 people have died from gun violence.
This is more than the number of Americans who have died in wars fought throughout U.S. history.
6
3 Evans ML, Lindauer M, & Farrell ME. (2020). A pandemic within a pandemic — Intimate partner violence during Covid-19. The New England
Journal of New Medicine.
4 Piquero AR, Jennings WG, Jemison E, Kaukinen C, & Knaul FM. (2021). Domestic violence during COVID-19: Evidence from a systematic review
and meta-analysis. Council on Criminal Justice. Available: https://build.neoninspire.com/counciloncj/wp-content/uploads/sites/96/2021/07/
Domestic-Violence-During-COVID-19-February-2021.pdf
5 Federal Bureau of Investigation crime data explorer. (2021). FBI Uniform Crime Reporting Program. Available: https://crime-data-explorer.
fr.cloud.gov/pages/home
6 Crigger M & Santhanam L. (2015). How many Americans have died in U.S. wars? PBS. Available: https://www.pbs.org/newshour/nation/many-
americans-died-u-s-wars

A Year in Review: 2020 Gun Deaths in the U.S. 8
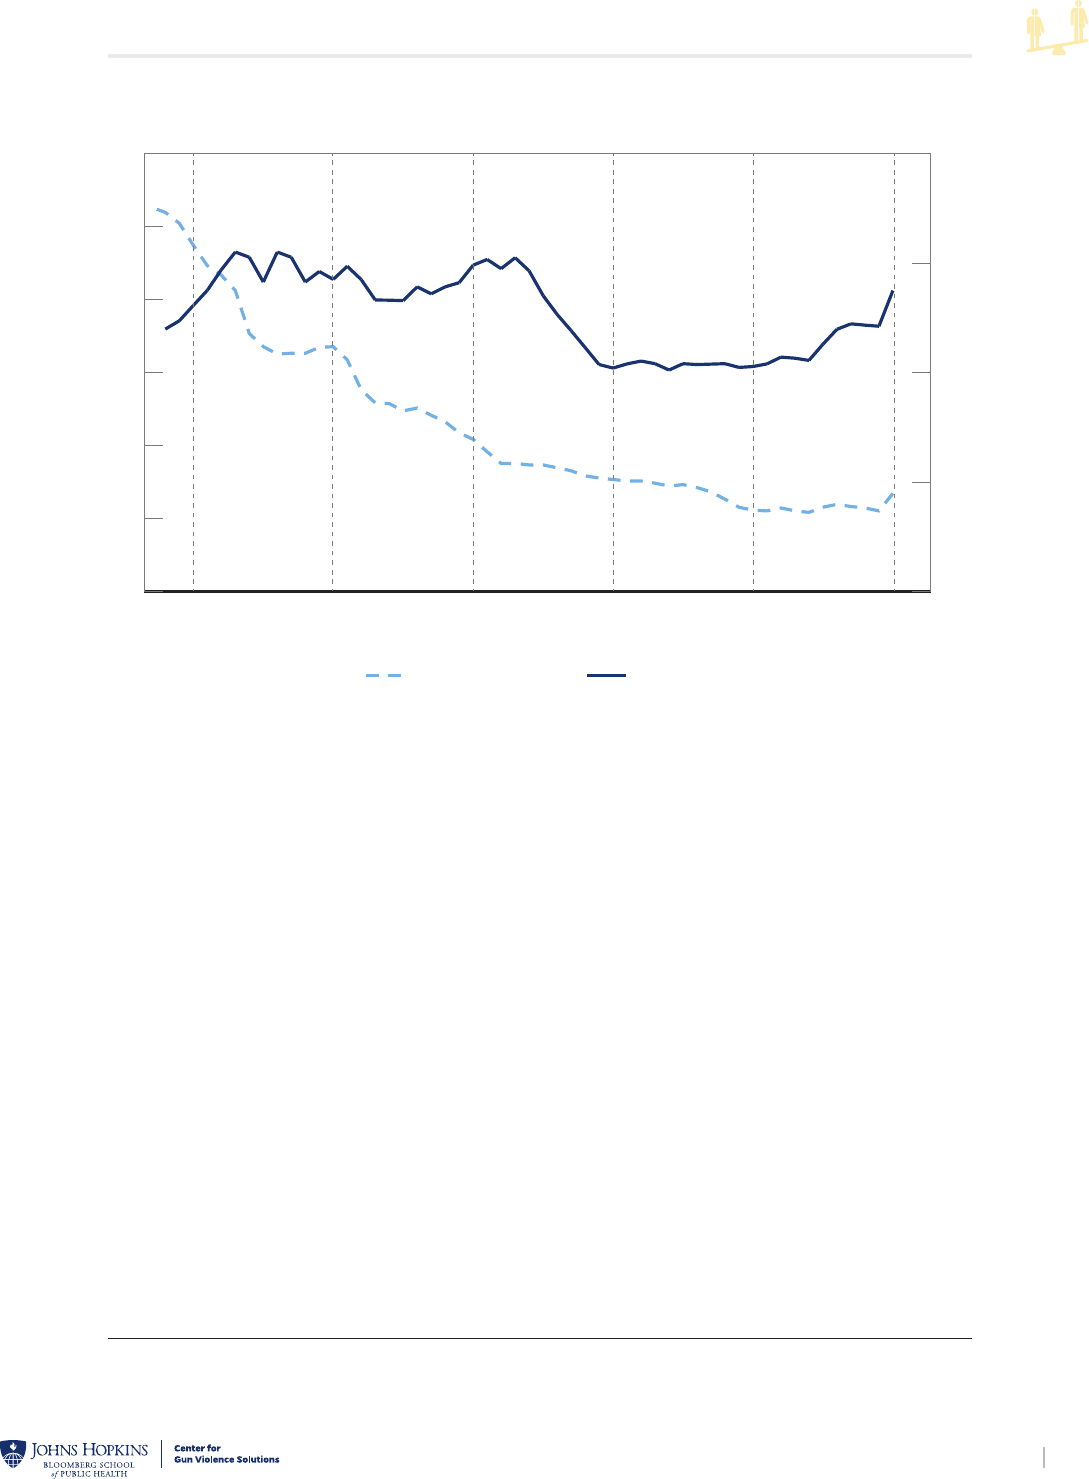
The overall firearm suicide rate hasn’t fluctuated much over the last 40 years. It dipped slightly in
the 2000s before starting to rise in the 2010s. In 2020, the firearm suicide rate remained at
essentially the same level it was in 1981. The firearm homicide rate has fluctuated much more than
the gun suicide rate. It peaked in the early 1990s, declined significantly, and then leveled off in the
2000s. The gun homicide rate spiked in 2015–2016; and in 2020, the gun homicide rate
experienced the largest one-year increase in modern history. Despite this monumental one-year
spike, the gun homicide rate is still lower than it was in the early 1990s.
FIGURE 1: Firearm Death Rate, 1980–2020
0
5
10
15
20
20202010200019901981
Total gun death rate
Suicide
Homicide
Other (Unintentional,
Undetermined Intent;
Legal Intervention)
Firearm Death Rate, 1980-2020
Year
Rate per 100,000
Total firearm death rate Suicide Homicide Other
Note:
The gun death rates depicted in the graph above are classified from two versions of the International Classification of
Diseases (ICD). The data from 1981 to 1998 were classified using ICD-9 codes, and from 1999 to 2020 classified using ICD-10.
WHY USE RATES?
The numbers of gun deaths can help illustrate the burden of gun violence in a particular population.
However, because the total population varies by geographic area and over time, firearm death rates
(typically measured as the number of gun deaths per 100,000 people) provide an important
measure for comparison.
For example, 2020 had the highest number of gun deaths ever, but not the highest rate because the
U.S. population in 2020 was larger than in prior years. While there were fewer gun deaths in the
early 1990s, the gun death rate in the early 1990s was higher than it is today because the number of
gun deaths compared to the population was higher.
7
7 Rates in this report are generally age-adjusted. Age adjustment allows for accurate comparisons between populations with different
age distributions. To learn more about age adjustment see the definition in the glossary.

9A Year in Review: 2020 Gun Deaths in the U.S.
Policy Reco
mmendations
Gun violence is a complex issue requiring many approaches to its prevention. We are committed
to evidence-based policies, programs, and practices and ensuring that all of these preventative
measures are designed and implemented equitably. Below, we highlight a few promising policy
recommendations to stop gun violence in all its forms. For more information on gun violence
solutions, visit our website at https://publichealth.jhu.edu/gun-violence-solutions.
States should implement firearm purchaser licensing (also known as permit-to-
purchase) that requires prospective gun purchasers to obtain a license prior to
buying a gun.
• F
irearm purchaser licensing systems create a robust structure to verify individuals’ identities
and ensure they are not prohibited from gun ownership. Background checks as part of a firearm
purchaser licensing system often are facilitated using fingerprints and utilize records at the state
level that might not have been reported to the federal system. Firearm purchaser licensing laws
are associated with lower rates of diversion of guns for use in crime, homicide and suicide by
firearm, mass shootings, and shootings by police.
8,9,10,11
These laws are supported by more than
75% of adults, including more than 60% of gun owners and Republicans.
12
States should enact and implement firearm removal laws—Domestic Violence
Protection Orders (DVPOs) and Extreme Risk Protection Orders (ERPOs).
• DVPOs are civil court orders to protect victims and survivors of domestic abuse, including dating
partners. Federal law prohibits anyone subject to a DVPO issued after notice and hearing from
purchasing or possessing firearms. Research shows that the stronger the DVPO protections, the
stronger the life-saving benefits. For example, the largest reductions in intimate partner homicide
connected to DVPO firearm restrictions are those that extend to dating partners, temporary or
emergency orders, and those that explicitly require defendants to surrender their firearms.
13
• ERPO laws, which are modeled o of DVPOs, create a civil process allowing law enforcement,
family members, and, in some states, medical professionals to petition a court to temporarily
separate someone at risk of harming themselves or others from their firearms. ERPOs also prohibit
individuals from acquiring new guns for the duration of the order. ERPO laws are associated with
lower rates of firearm suicide and have been successfully used in response to threats of mass
shootings. Law enforcement-initiated ERPOs are supported by 76% of adults, including more than
65% of gun owners and Republicans. Family-initiated ERPOs are supported by 80% of adults,
including more than 70% of gun owners and Republicans.
14
8
Crifasi CK, McCourt AD, & Webster DW. (2020). The impact of handgun purchaser licensing on gun violence. John Hopkins University
Bloomberg School of Public Health. Available: https://www.jhsph.edu/research/centers-and-institutes/johns-hopkins-center-for-gun-violence-
prevention-and-policy/_docs/Impact_of_Handgun.pdf
9 McCourt AD, Crifasi CK, Stuart EA, Vernick, JS, Kagawa RMC, Wintemute GJ, & Webster DW. (2020). Purchaser licensing laws, point-of-sale
background check laws, and firearm homicide and suicide in 4 US States, 1985-2017. American Journal of Public Health.
10 Webster DW, McCourt AD, Crifasi CK, Booty MD, & Stuart EA. (2020). Evidence concerning the regulation of firearms design, sale, and
carrying on fatal mass shootings in the United States. Criminology and Public Policy.
11 Crifasi CK, Pollack K, & Webster DW. (2016). The influence of state-level policy changes on the risk environment for law enforcement ocers.
Injury Prevention.
12 Barry CL, Stone E, Crifasi CK, Vernick JS, Webster DW, & McGinty EE. (2019). Trends in Americans’ support for gun policies. Health Aairs.
13 Zeoli AM, McCourt A, Buggs S, Frattaroli S, Lilley D, & Webster DW. (2018). Analysis of the strength of legal firearms restrictions for
perpetrators of domestic violence and their associations with intimate partner homicide. American Journal of Epidemiology.
14 Barry CL, Stone E, Crifasi CK, Vernick JS, Webster DW, & McGinty EE. (2019). Trends in Americans’ support for gun policies. Health Affairs.

10A Year in Review: 2020 Gun Deaths in the U.S.
Cities should prioritize funding for Homicide Review Commissions (HRC) and
community violence intervention (CVI).
• Homicide Review Commissions (HRC) are a public health and public safety partnership that seek to
analyze patterns and trends in gun violence, gather community input, and generate
recommendations for action. An HRC is comprised of
three committees: a criminal justice review, a
community-based review, and an executive committee review. The HRC is led by a public health
researcher who serves as a neutral convener to review data, synthesize findings, and generate
recommendations. Prior research of Milwaukee’s HRC found a 50% decline in homicide in the
intervention districts compared to control districts.
15
• Community violence interventions (CVI) are promising programs that aim to identify and support
the small number of people at risk for violence by helping them peacefully resolve conflicts and
providing them with wraparound mental health and social support. CVI is most effective when cities
first establish an inter-agency process, like a Homicide Review Commission, to identify the drivers
of violence within a city and deploy resources comprehensively to address these drivers of
violence. Promising CVI initiatives that can help reduce violence include: violence interruption
programs, group violence intervention strategies, violence reduction through blight remediation,
hospital-based violence intervention programs, programs that use cognitive behavioral therapy,
and programs that provide life coaching and case management to those at risk for violence.
Gun violence prevention advocates, policy makers, and researchers should ensure that the
policies they pursue to reduce gun violence are equitable and don’t unintentionally harm the very
communities they aim to help. To do this, stakeholders should consider using a Racial Equity
Impact Assessment (REIA) to examine policies through an equity lens, engage with impacted
communities, anticipate the potential outcomes, and mitigate foreseeable risks. The Educational
Fund to Stop Gun Violence and DC Justice Lab—in collaboration with five other organizations—
have developed a Racial Equity Impact Assessment Tool specifically designed for gun violence.
16
15
Azrael D, Braga AA, & O’Brien ME. (2010). Developing the capacity to understand and prevent homicide: An evaluation of the Milwaukee
Homicide Review Commission. National Institute of Justice. Available: https://nij.ojp.gov/library/publications/developing-capacity-
understand-and-prevent-homicide-evaluation-milwaukee
16 Educational Fund to Stop Gun Violence, DC Justice Lab, Cities United, March for Our Lives, Community Justice Action Fund, Consortium
for Risk-Based Firearm Policy, and Johns Hopkins Center for Gun Violence Prevention and Policy. (2022). Racial Equity Framework for Gun
Violence Prevention. https://efsgv.org/racialequity/

A Year in Review: 2020 Gun Deaths in the U.S. 11
The Lethality and Availability of Firearms
Due to their high lethality and availability, firearms fuel our nation’s high suicide and homicide
rates. Nearly 80% of all homicides and more than half of all suicides are by firearm. Yet far too
often, the role of firearms is left out of policy and programmatic eorts to reduce homicides and
suicides. In order to eectively prevent these tragedies, we need to incorporate policy solutions that
acknowledge the lethality of firearms and address their availability, especially among those at an
elevated risk for suicide or interpersonal violence.
Homicides
In 2020, 79% of all homicides were by firearm, the highest proportion of homicides by firearm in history:
2011
68
%
2020
79
%
68
%
2011
79
%
2020
• The lethality an
d availability of guns drive our nation’s high homicide rate. In fact, other high-income
countries with fewer guns and stronger gun laws have comparable rates of violent assault to the U.S.,
but the U.S. has a firearm homicide rate 25 times higher than other high-income countries.
17
• Guns are used in homicides nine times more than the second most common method of homicide
(cutting/piercing) and 47 times more than suffocation.
• The increase in homicides from 2019 to 2020 was driven almost exclusively by firearms. Firearm
homicides increased by 35% from 2019 to 2020. Non-firearm homicides only increased by 10%
during the same period.
FIGURE 2: Homicides by Method, 2020
0 5,000 10,000 15,000 20,000
All Other
Methods Combine
Poisoning
Struck by or Against
Suocation
Cut/Pierce
Firearm
Injury Mechanism
d
0 5000 10000 15000 20000
All Other Methods Combined
Poisoning
Struck by or Against
Suocation
Cut/Pierce
Firearm
Homicides by Method, 2020
19,384
2,063
415
265
179
2,270
Number of Deaths
Note: The “All other methods combined” category includes: Unspecified i
njury (1,375 deaths), Other specified, not elsewhere
classified injury (450), Other specified, classifiable injury (187), Fire/flame (116), Other land transport (99), Drowning (26),
Fall (14), and Hot object/substance (3).
17 Grinshteyn E & Hemenway D. (2019). Violent death rates in the US compared to those of the other high-income countries, 2015. Preventive Medicine.

A Year in Review: 2020 Gun Deaths in the U.S. 12
Suicides
In 2020, 53% of all suicides were by firearm:
• Access to lethal means, like firearms, greatly increases the risk that a suicide attempt will result in
death. 90% of suicide attempts involving firearms are fatal.
18
• Because firearms are so lethal, they account for more than half of all suicide deaths even though
they make up less than 10% of all suicide attempts.
19
• Drug poisoning and cutting account for around 80% of all suicide attempts, but fewer than 1 in 20
suicide attempts involving these methods result in death.
20
• Delaying a suicide attempt can also allow suicidal crises to pass and lead to fewer suicides. Ninety
percent of individuals who attempt suicide do not eventually go on to die by suicide.
21
• Guns are used in suicides twice as often as the second most common method of suicide
(suocation) and 27 times more than cutting/piercing.
FIGURE 3: Suicides by Method, 2020
0 5000 10000 15000 20000 25000
All Other Methods Combined
Cut/Pierce
Fall
Poisoning
Suocation
Firearm
0 5,000 10,000 15,000 20,000 25,000
All Other
Methods Combined
Cut/Pierce
Fall
Poisoning
Suocation
Firearm
Number of Deaths
Injury Mechanism
Suicides by Method, 2020
24,292
12,495
5,528
1,074
907
1,683
No
te: The “All other methods combined” category includes: Other specified, classifiable injury (638 deaths), Drowning (498),
Fire/flame (175), Other land transport (161), Other specified, not elsewhere classified injury (125), and Unspecified injury (86).
18 Azrael D & Miller M. (2016). Reducing suicide without aecting underlying mental health: Theoretical underpinnings and a review of the
evidence base linking the availability of lethal means and suicide. The International Handbook of Suicide Prevention.
19 Conner A, Azrael D, & Miller M. (2019). Suicide case-fatality rates in the United States, 2007 to 2014. A nationwide population-based study.
Annals of Internal Medicine.
20 Ibid.
21 Owens D, Horrocks J, &
House A. (2002). Fatal and non-fatal repetition of self-harm. Systematic review. The British Journal of Psychiatry.

A Year in Review: 2020 Gun Deaths in the U.S. 13
The Burden of Gun Violence Relati
ve to
Other Injuries and Diseases
A Leading Cause of Death Among Young People
Gun violence is the leading cause of death among children, teens, and young adults under the age
of 25, taking the lives of over 10,000 young people in 2020 alone. When young people are shot and
killed, they lose decades of potential: the potential to grow up, have a family, contribute to society,
and pursue their passions in life. These losses are felt across neighborhoods and communities.
Compared to other causes of death, gun violence often poses a larger burden on society in terms of
years of potential life lost. Years of potential life lost calculations estimate the average time a person
would have otherwise been expected to live if they did not die prematurely. In 2020, firearm
deaths accounted for 1,131,105 years of potential life lost before the age of 65—more than
diabetes, stroke, and liver disease combined.
22
Shockingly, firearms also had a much larger burden on young people in terms of mortality than
COVID-19 did in 2020. In fact, young people under the age of 30 were nearly 10 times more likely
to die by firearm than by COVID-19 in 2020.
23
,
24
In 2020, firearms also accounted for 1.6 times more
years of potential life lost before the age of 65 than COVID-19.
25
These comparisons are not meant
to diminish the unprecedented toll of the COVID-19 epidemic and the devastating effect it had on
the same communities disproportionately impacted by gun violence, but they do help illuminate the
often overlooked public health epidemic of gun violence that impacts our country year after year.
Despite the enormous toll of gun violence, scant attention and only minimal funding are allocated to
prevent this leading cause of death. We must treat gun violence with the same urgency we have
addressed COVID-19 and other public health crises. Every week we delay action on gun violence
prevention, hundreds of young people—including children—are needlessly killed.
IMPACT ON CHILDREN, TEENS, AND YOUNG ADULTS
• Firearms were the leading cause of death for children and teens ages 1–19, prematurely taking
the
lives of 4,357 young people.
• Homicides are the most common type of gun death among children and teens—64% of child and
teen gun deaths were homicides and 30% were suicides.
• While teenagers account for the majority of these deaths, younger children are not immune. An
average of eight children ages 0–12 were killed by guns every single week in 2020.
• Every 2.5 days a child or teen was killed by an unintentional gun injury.
• Black children and teens face alarmingly high rates of gun victimization. More than half of all
Black teens (15–19) who died in 2020—a staggering 52%—were killed by gun violence.
22 WISQARS years of potential life lost (YPLL) Report, 1981–2020. (2020). Centers for Disea
se Control and Prevention. Available: https://
wisqars.cdc.gov/ypll
23 According to provisional CDC data, there were 1,682 deaths due to COVID-19 in 2020 among those ages 0–29. There were 15,835 firearm
deaths among this population.
24 Provisional death counts for Coronavirus disease 2019 (COVID-19). (2022). National Center for Health Statistics. Available: https://
www.cdc. gov/nchs/nvss/vsrr/covid_weekly/index.htm#SexAndAge
25 WISQARS years of potential life lost (YPLL) Report, 1981–2020. (2020). Centers for Disease Control and Prevention. Available: https://
wisqars.cdc.gov/ypll

A Year in Review: 2020 Gun Deaths in the U.S. 14
• Gun violence remains a leading cause of death for young adults in their 20s and 30s. These age
groups are particularly impacted by gun homicide. People ages 20–39 years old made up 27%
of the population but accounted for 61% of all homicide victims in 2020.
FIGURE 4: Leading Cau
ses of Death, Ages 1–19
0 1000 2000 3000 4000 5000
Suocation
Cancers
Poisoning/ Overdose
Motor Vehicle Crash
Firearm
0 1,000 2,000 3,000 4,000 5,000
Firearm
Motor Vehicle Crash
Poisoning/Overdose
Cancers
Suocation
Number of Deaths
Cause of Death
Leading Causes of Death for Americans, Ages 1–19
By Injury Mechanism and all Other Leading Causes
4,357
3,639
1,845
1,648
1,411
Number of Deaths
Note: We chose not to include infant deaths in our analyses, as infants (under age 1) are at a unique risk for age-specific causes
of death, including perinatal period deaths and congenital anomalies. In 2020, 11 infants were killed by firearms. There were
1,711 deaths classified as “all other diseases” making it the fourth leading cause of death behind poisoning/overdose.
Firearm Fatalities Compared to Other Forms of Fatal Injuries
Injuries make up a substantial burden of premature death in the United States, and among injury
mechanisms, firearms are one of the deadliest. In 2020, firearms contributed to the second most
injury fatalities in the U.S., surpassed only by poisonings (overdose).
FIGURE 5: Total Injury Deaths by Mechanism, 2020
0 20000 40000 60000 80000 100000
All Other Injuries Combined
Cut/Pierce
Fire/Flame
Drowning
Unspecified Injury
Suocation
Motor Vehicle Trac
Fall
Firearm
Poisoning/Overdose
0 20,000 40,000 60,000 80,000 100,000
All Other
Injuries Combined
Cut/Pierce
Fire/Flame
Drowning
Unspecified Injury
Suocation
Motor Vehicle Trac
Fall
Firearm
Poisoning/Overdose
Injury Mechanism
Total Injury Deaths by Mechanism, 2020
Number of Deaths
97,034
45,222
43,292
40,698
19,811
8,412
5,007
3,440
3,168
12,268
Number of Deaths
Note: The “All other injuries combined” category includes: Natural/environmental (2,118 deaths), Other specified, not
elsewhere classified injury (2,002), Other land transport (1,696), Struck by or against (1,173), Other transport (938),
Other pedestrian (899), Machinery (530), Other pedal cyclist (454), Hot object/substance (89), Overexertion (20).

A Year in Review: 2020 Gun Deaths in the U.S. 15
Firearm Fatalities Compared to Car Crashes
The burden of firearm mortality is often compared to car crashes, in part because their numbers are
similar. In the last four years, however, for the first time more people died by guns than by car crashes
(in 2020, there were 45,222 and 40,698 deaths, respectively). However, there are vast dierences in
exposure to motor vehicles compared to firearms. The average person spends around eight hours per
week in their car.
26
Cars are a part of our daily lives, while, for many people, firearms are not.
By using a comprehensive public health approach to car safety that included vehicle and road design
improvements, the United States reduced per-mile driving deaths by nearly 80% from 1967 to 2017
(see figure 6).
27
This public health approach to car safety prevented more than 3.5 million deaths
over 50 years.
28
Reducing motor vehicle injuries and their severity has long been a focus of injury
prevention policy. While there is more work to do, substantial reductions have been made. A similarly
comprehensive approach to gun violence prevention also holds promise.
29,30
To learn more about this approach, read the Educational Fund to Stop Gun Violence report entitled
“The Public Health Approach to Gun Violence Prevention.”
Preventing Car Crashes Preventing Gun Deaths
Research Allocate funds to study the epidemic
of motor vehicle crashes.
Allocate federal funds to research gun
violence.
Industry
Regulations
and Oversight
Federal agencies regulate car
manufacturers and ensure car safety.
Cars are monitored and regulated, and
recalls are issued for unsafe models.
Manufacturers are held liable if they
sell a dangerous vehicle.
Allow federal agencies to regulate
firearm manufacturers, require gun
safety components, and ensure
industry accountability and liability for
reckless practices.
Licensing Drivers must submit an application
and pass a test to obtain a driver’s
license.
Require firearm purchasers to submit
an application, undergo a background
check, get fingerprinted, and take
safety education to obtain a license to
own a firearm.
P
rohibiting
Risky People
Reckless and drunk driving laws
ensure that risky individuals do not
endanger others on the road.
Expand firearm prohibitions to include
individuals who are at elevated risk for
violence.
Age
Requirements
Age requirements for obtaining a
driver’s license, including a graduated
licensing system (driver’s permit) for
young drivers.
Enact stronger age requirements
for owning or possessing all types of
firearms.
26 How much time do Americans spend behind the wheel? (2017). U.S. Department of Transportation. Available: https://www.volpe.dot.gov/
news/how-much-time-do-americans-spend-behind-wheel
27 Trac safety facts: A compilation of motor vehicle crash data. (2020). National Highway Trac Safety Administration. Available: https://
cdan.nhtsa.gov/tsftables/tsfar.htm
28 On 50th anniversary of Ralph Nader’s ‘Unsafe at Any Speed,’ safety group reports auto safety regulation has saved 3.5 million lives. (2015).
The Nation. Available: www.thenation.com/article/archive/on-50th-anniversary-of-ralph-naders-unsafe-at-any-speed-safety-group-reports-
auto-safety-regulation-has-saved-3-5-million-lives/
29 Mozaarian D, Hemenway D, & Ludwig DS. (2013). Curbing gun violence: Lessons from public health successes. JAMA Network Open
30 The Public Health Approach to Gun Violence Prevention. (2020). Educational Fund to Stop Gun Violence. Available: www.efsgv.org/
PublicHealthApproachToGVP
A Year in Review: 2020 Gun Deaths in the U.S. 16
FIGURE 6: Comparison of Car Crash Deaths and Gun Deaths Over Time
31
0
1
2
3
4
5
6
202020102000199019801970
Car crash death rates per 100
million vehicle miles traveled
0
5
10
15
20
0
5
10
15
20
202020192018201720162015201420132012201120102009200820072006200520042003200220012000199919981997199619951994199319921991199019891988198719861985198419831982198119801979197819771976197519741973197219711970196919681967
Comparison of Car Crash Deaths and Gun Deaths Over Time
Year
Gun death rates per 100,000 people
Car crash deaths Gun deaths
Note: This graph depicts the gun death rate per 100,000 people (ICD code classifications 8-10) and the car crash fatality rate
per 100 million vehicle miles traveled as reported by the National Highway Traffic Safety Administration. Because car use
has increased dramatically over the last 50 years, examining the fatality rate per million miles traveled more accurately
depicts how much safer cars have become, and as a result, how many fatalities have been prevented.
31 National Highway Trac Safety Administration. Trac safety facts annual report tables. Motor vehicle trac fatalities and fatality rates.
Available: https://cdan.nhtsa.gov/tsftables/tsfar.htm

A Year in Review: 2020 Gun Deaths in the U.S. 17
Gun Deaths by Demographic Groups
To stop gun violence in all its forms, we must implement broad prevention eorts to reduce risk to
the population as a whole, together with tailored solutions for high-risk populations. Understanding
how risk diers across the population by sex, race/ethnicity, and age, and broken down by gun death
intent (homicide and suicide), is critical for designing these interventions.
While nobody is immune from gun violence, some demographic groups are at much higher risk than
others:
By sex: Males are much more likely to die by all forms of gun violence than females.
• Nearly nine in ten (87%) firearm suicide decedents and 85% of homicide victims were
male in 2020.
• Males were five t
imes more likely to be gun homicide victims than females.
• Males were nearly seven times more likely to die by firearm suicide than females.
By age: In general, young people are most impacted by gun homicides and elderly people
are most impacted by gun suicides.
• Y
oung people ages 15–34 years old are at the highest risk for dying by firearm homicide.
They had a gun homicide rate twice the national average and accounted for three out of
every five gun homicide victims.
• Elderly people ages 75 and older are at the highest risk for dying by gun suicide. They
had a gun suicide rate twice the national average.
By race/ethnicity: In general, white people are overrepresented among gun suicide
decedents and Black people are disproportionately impacted by gun homicides.
CDC DEMOGRAPHIC CATEGORIES
The Ne
ed for More Inclusive Classifications
The demographic categories used by the CDC WONDER database are limited, and we acknowledge
that these categorizations are not inclusive of all racial, ethnic, and gender identities. However,
because this report is an analysis of CDC WONDER data, we chose to list the categories and labels
used by the CDC.
While Hispanic origin is classified by the CDC as an ethnicity, not a race category, we chose to use
“Hispanic or Latino” as a distinct category regardless of race, and selected “Not Hispanic or Latino”
for each of the race categories. This ensured that individuals were not counted twice in dierent
demographic groups and follows common practice used by the CDC for data analyses.
Ultimately, more nuanced and inclusive data classification is needed to understand and address how
gun violence impacts dierent demographic groups.

A Year in Review: 2020 Gun Deaths in the U.S. 18
People of dierent races and ethnicities in the U.S. are impacted by gun violence dierently. This
is a result of social and economic factors that are associated with increased risk of violence. For
example, gun homicides are highly concentrated within neighborhoods composed of predominantly
Black and Hispanic/Latino residents. These neighborhoods face a host of systemic inequalities—
hypersegregation, discrimination, lack of economic opportunities, and under-resourced public
services. As a result, young Black and Hispanic/Latino people, particularly males, are disproportionately
impacted by gun homicide. In contrast, elderly white men are at increased risk for gun suicide because
this demographic is most likely to live in more rural communities with limited availability of mental
health services and easy access to firearms.
32,33
Black/African American:
• Black people are at highest risk for gun homicide. They were more than 12 times more likely to be
a victim of gun homicide than white people.
• Black men were 15 times more likely to die by firearm homicide than white men.
• Black women were more than five times more likely to die by firearm homicide than white women.
• Gun suicides amoung Black teenagers and young men ages 15–24 doubled from 2011 to 2020.
• Gun suicides amoung Black teenagers and young women ages 15–24 have increased dramatically
over the last decade. The gun suicide rate nearly doubled from 2012 to 2020.
34
BLACK PEOPLE ARE DISPROPORTIONATELY IMPACTED BY GUN HOMICIDE
• In 2020, one out of every 1,000 young Black males (15–34) was shot and killed. Young Black males
(15
–34) are disproportionately impacted—although they represented 2% of the total population
in the U.S., they accounted for 38% of all gun homicide fatalities in 2020. Their rate of firearm
homicide was almost 21 times higher than white males of the same age group.
• The firearm homicide rate among young Black females (15–34) was seven times higher than white
females of the same age group.
• In 2020, there was a 49% increase in Black females who died by gun homicide compared to 2019.
These racial disparities are largely the result of structural inequities that increase the risk of
interpersonal violence.
Hispanic/Latino:
• Hispanic/Latino people were twice as likely to die by gun homicide than their white counterparts.
• Hispanic/Latino men were 2.5 times more likely to die by firearm homicide than white men.
• Among Hispanic/Latino teenagers and young women ages 15–24, the gun suicide rate was 2.6
times higher in 2020 than it was in 2011.
• Hispanic/Latino people in New Mexico had a gun violence death rate 2.5 times higher than the
rate for Hispanic/Latino people nationally. In fact, the homicide rate was nearly two times higher
and the suicide rate was 3.2 times higher than the average homicide and suicide rates for
Hispanic/Latino people in 2020.
32
Ibrahimi SE, Xiao Y, Bergeron CD, & et al. (2021). Suicide distribution and trends among male older adults in the U.S., 1999–2018. American
Journal of Preventive Medicine.
33 Steelesmith DL, Fontanella CA, & Campo JV. (2019). Contextual factors associated with county-level suicide rates in the United States, 1999
to 2016. JAMA Network Open.
34 We used 2012 instead of 2011 because the gun suicide rate among Black females ages 15–34 was reported as unreliable in 2011 (fewer
than 20 fatalities).

A Year in Review: 2020 Gun Deaths in the U.S. 19
American Indian/Alaska Native:
• American Indian/Alaska Native people were 3.7 times more likely to be a victim of firearm
homicide compared
to their white counterparts.
• American Indian/Alaska Native women were two times more likely to be firearm homicide victims
than white women.
• American Indian/Alaska Native males had the highest firearm suicide rate compared to the other
races/ethnicities. While the available data highlight the gun violence many American Indian/Alaska
Native people face, the data on this demographic under-report the true number of victims of gun
violence. This is a result of incomplete and inconsistent reporting of missing persons especially
among females, as well as misclassification of race and ethnicity categories among American
Indian/Alaska Native people.
35
White:
• White males are overrepresented among gun suicides. White males accounted for 30% of the
U.S.
population but 72% of all firearm suicide decedents in 2020.
• White men over the age of 34 made up 18% of the U.S. population but accounted for 54% of all
gun suicides in 2020. Gun ownership is most common among white men with about half (48%)
of all white men reporting that they own a gun.
36
• White females were overrepresented among female gun suicide decedents. In 2020, white
females made up 60% of the female population in the U.S. but accounted for 84% of all female
firearm suicide decedents.
Asian/Pacific Islander:
• Although Asian/
Pacific Islander people had the lowest gun death rates of all races and ethnicities,
531 Asian/Pacific Islander people died by firearm in 2020.
• Among young Asian/Pacific Islander males ages 15–24, the gun suicide rate was 2.4 times higher
in 2020 than it was in 2011.
• The proportion of suicides carried out by firearm among Asian/Pacific Islander people was far
lower than other racial or ethnic groups. For example, in 2020, 25% of all suicides among Asian/
Pacisic Islander people were by firearm. By comparison, 56% of all suicides among white people
were by firearm. The low gun suicide rate among Asian/Pacific Islander people is likely because
they have lower rates of gun ownership.
• Anti-Asian hate crimes, sparked by the COVID-19 pandemic, increased by 76% from 2019 to 2020
and another 339% from 2020 to 2021. As discrimination and violence against Asian/Pacific
Islander people continues to increase, Asian/Pacific Islander people are buying guns for protection
against hate crimes. This is concerning because increased gun ownership is associated with
increases in non-fatal firearm injuries and deaths.
37,38,39
35 Healy J. (2019). In Indian country, a crisis of missing women. And a new one when they’re found. New York Times. Available:
https://www.
nytimes.com/2019/12/25/us/native-women-girls-missing.html
36 Parker K, Horowitz JM, Igielnik R, Oliphant JB, & Brown A. (2017). The demographics of gun ownership. Pew Research Center. Available:
www.pewresearch.org/social-trends/2017/06/22/the-demographics-of-gun-ownership/
37 Fact sheet: Anti-Asian prejudice March 2021. (2021). Center for the Study of Hate & Extremism. Available: www.csusb.edu/sites/default/
files/FACT%20SHEET-%20Anti-Asian%20Hate%202020%20rev%203.21.21.pdf
38 Choi J. (2022). Anti-Asian hate crimes in US spiked 339 percent in 2021: Report. The Hill. Available: https://thehill.com/blogs/blog-briefing-
room/news/592191-anti-asian-hate-crimes-in-us-spiked-339-percent-in-2021-report
39 How the firearms industry markets guns to Asian Americans. (2021). Violence Policy Center. Available: https://vpc.org/studies/AAPI2021.pdf

A Year in Review: 2020 Gun Deaths in the U.S. 20
FIGURE 7: Female Gun Death Rates by Race/Ethnicity, 2020
0
1
2
3
4
5
6
7
8
Hispanic/Latino White Black/African AmericanAsian/Pacic Islander American Indian/Alaska Native All Races/Ethnicities
0
1
2
3
4
5
6
7
8
Age-Adjusted Rate per 100,000
Hispanic/Latino White Black/
African American
Asian/
Pacific Islander
American Indian/
Alaska Native
All Races/
Ethnicities
Female Gun Death Rates by Race/Ethnicity, 2020
Race/Ethnicity
Suicide Homicide Total gun death rate
FIGURE 8: Male Gun Death Rates by Race/Ethnicity, 2020
0
10
20
30
40
50
60
Hispanic/LatinoWhiteBlack/
African American
Asian/
Pacific Islander
American Indian/
Alaska Native
All Races/
Ethnicities
0
10
20
30
40
50
60
Age-Adjusted Rate per 100,000
Hispanic/LatinoWhiteBlack/
African American
Asian/
Pacific Islander
American Indian/
Alaska Native
All Races/
Ethnicities
Male Gun Death Rates by Race/Ethnicity, 2020
Race/Ethnicity
Suicide Homicide Total gun death rate

A Year in Review: 2020 Gun Deaths in the U.S. 21
FIGURE 9: Firearm Homicide Rates by Disproportionately Impacted Populations, 2020
0 20 40 60 80 100 120
Black males ages 15-34
Males ages 15-34
Males
National Average
0 20 40 80 100 120
Black males
ages 15–34
Males
ages 15–34
Males
National
Average
Impacted Populations
0
20
40
60
80
100
120
Black males ages 15-34Males ages 15-34MalesNational Average
Firearm Homicide Rates by Disproportionately
Impacted Populations, 2020
Impacted Populations
60
Age-adjusted rate per 100,000
Age adjusted rate per 100,000
17.9x
FIGURE 10: Firearm Suicide Rates by Disproportionately Impacted Populations, 2020
0 5 10 15 20 25 30 35
White males ages 65+
Males ages 65+
Males
National average
0 5 10 25 30 35
White males
ages 65+
Males
ages 65+
Males
National
average
Impacted Populations
0
10
20
30
40
White males ages 65+Males ages 65+MalesNational average
Firearm Suicide Rates by Disproportionately
Impacted Populations, 2020
Impacted Populations
15 20
Age-adjusted rate per 100,000
Age adjusted rate per 100,000
4.4x
FIGURE 11: Racial/Ethnic Disparities in Gun Homicide: Likelihood of Homicide
Victimization Relative to White Population
0 2 4 6 8 10 12 14
Black/African American
American Indian/Alaska Native
Hispanic/Latino
Asian/Pacific Islander
0 2 4 6 8 10 12 14
Black/
African American
American Indian/
Alaska Native
Hispanic/Latino
Asian/Pacific
Islander
Impacted Populations
0
2
4
6
8
10
12
Black/
African American
American Indian/
Alaska Native
Hispanic/LatinoAsian/Pacific Islander
Racial/Ethnic Disparities in Gun Homicide:
Likelihood of Homicide Victimization Relative to White P opulation
Impacted Populations
Homicide disparity
Age adjusted rate per 100,000
0.5x
2x
4x
12x

A Year in Review: 2020 Gun Deaths in the U.S. 22
FIGURE 12: Dierence in Gun Homicide Rates by Race and Age, 2020
WHITEAGE
75+
65–74
55–64
45–54
35–44
25–34
15–24
<1–14
BLACK
0.35 2.41
3.23 63.42
3.8 60.34
3.58 36.09
2.31 17.05
1.51 8.34
3.67 0.8
0.82 2.03
Dierence in the Gun Homicide Rate by Race and Age, 2020
per 100,000 per 100,000
FIGURE 13: Dierence in Gun Suicide Rates by Race and Age, 2020
WHITEAGE
75+
65–74
55–64
45–54
35–44
25–34
15–24
<1–14
BLACK
0.5
0.25
8.8 7.72
10.42 8.28
10.5 5.48
11.94 3.47
11.98
2.74
11.83 2.61
17.81 2.85
per 100,000 per 100,000
Dierence in the Gun Suicide Rate by Race and Age, 2020

A Year in Review: 2020 Gun Deaths in the U.S. 23
Gun Violence Rates Across States
Gun d
eath rates vary widely between states. For example, in 2020, Hawaii, the state with the lowest
gun death rate, had a rate eight times lower than Mississippi, the state with the highest gun death
rate. A wide number of factors influence state level gun death rates including demographics, socio-
economic factors, and gun policies. In many rural states, gun suicides make up the largest proportion
of gun deaths, while in more urban states, gun homicides generally account for a larger proportion of
gun deaths.
In general, the states with the highest gun death rates tend to be rural states in the South or West
with weaker gun laws. While the media often focuses on gun violence in cities in states like New York,
Pennsylvania, Maryland, and Illinois, all of these states had gun death rates lower than the national
average. New York, for example, had a rate 2.5 times lower than the national rate. Many of the
states with the lowest gun death rates have strong gun violence prevention policies. For example, all
five of the states with the lowest gun death rates had both: 1) a firearm purchaser licensing law or
a purchaser waiting period, and 2) an extreme risk protection order (ERPO) law. Conversely, all
five of the states with the highest gun death rates had stand your ground legislation, and three of
the five had permitless carry laws (a fourth state, Alabama, passed permitless carry in 2022).
The five states with the lowest overall gun death rates in 2020 were:
State Purchaser Licensing ERPO
Hawaii
•
•
Massachusetts
• •
New Jersey
• •
Rhode Island
•
New York
• •
The five states with the highest overall gun death rates in 2020 were:
State Permitless Carry Stand Your Ground
Mississippi
• •
Louisiana
•
Wyoming
•
•
Missouri
•
•
Alabama
Figure 14 displays state gun death rates in 2020, ranking the gun death rates from lowest to highest.
Additionally, it shows the proportion of deaths attributed to homicide, suicide, and other intents
(legal intervention
41
, unintentional, and unclassified).
40 Rhode Island has a firearm purchaser waiting period but does not have a full firearm purchaser licensing law.
Alabama passed a permitless carry law in 2022.
41 The CDC data classification “legal intervention” under-counts police-involved gun fatalities. To address this gap, media sources like the
Washington Post’s Fatal Force database have tracked police-involved shootings in recent years, reporting that 1,021 people were shot and
killed by police in 2020.
•
o
40
o
40

A Year in Review: 2020 Gun Deaths in the U.S. 24
FIGURE 14: Gun Death Rates by State, Ranked Highest to Lowest, 2020
0 10 20 30
Hawaii
Massachusetts
New Jersey
Rhode Island
New York
Connecticut
California
Minnesota
New Hampshire
Nebraska
Maine
Washington
Iowa
Vermont
Wisconsin
Oregon
Virginia
Maryland
South Dakota
Utah
Pennsylvania
Florida
North Dakota
Illinois
Texas
Delaware
Michigan
Ohio
Colorado
North Carolina
Arizona
Kansas
Nevada
Indiana
Idaho
Georgia
West Virginia
Kentucky
Oklahoma
Montana
Tennessee
South Carolina
Arkansas
New Mexico
Alaska
Alabama
Missouri
Wyoming
Louisiana
Mississippi
State
Gun Death Rates by State, Ranked Highest to Lowest, 2020
Age-adjusted rate per 100,000
Suicide
Homicide
Other
Note: The total number of homicide deaths in New Hampshire and Vermont was less than 10 and thus repressed by
CDC. Homicide deaths are thus listed as “other gun death rate” for these two states.

A Year in Review: 2020 Gun Deaths in the U.S. 25
FIGURE 15: Gun Death Rates by State, 2020
Age-Adjusted
Gun Death Rate
3.4–11.5
11.6–14.5
14.6–21.0
21.1–28.6
Figure 9. Gun Death Rates by State, 2020
WA
MT
ID
NV
AZ
NM
CO
WY
KS
OK
AK
MO
AR
LA
MS
AL GA
SC
NC
TN
KY
WV
IN
MI
OR
CA
UT
ND
SD
NE
TX
HI
MN
IA
WI
IL
OH
PA
MD
VA
FL
NY
MA
VT
ME
NH
NJ
CT
DE
RI
DC

A Year in Review: 2020 Gun Deaths in the U.S. 26
A Closer Look: Gun Violence by Intent Across Counties and Urbanization
Levels
While the narratives around gun v
iolence tend to focus on cities like Chicago, Baltimore, or
Philadelphia, all areas in the United States—urban, suburban, and rural—are impacted by gun
violence. The CDC’s 2020 gun fatality data clustered by county urbanization level (large metro, small
& medium metro, and rural) highlight this reality. As illustrated in figure 16, the rural counties in the
U.S. had the highest gun death rates in 2020, a rate 1.4 times higher than the most urban counties
(large metro). This dierence is driven by gun suicides, which make up the majority of gun deaths
and disproportionately impact rural people. While dierent communities experience dierent
types of gun violence, it’s important to recognize how gun violence in the U.S. is not uniquely an
“urban” or a “rural” issue.
FIGURE 16: Gun Death Rates by Urbanization, 2020
0
5
10
15
20
Firearm HomicideFirearm SuicideTotal Gun Death Rate
0
5
10
15
20
Age-adjusted rate per 100,000
Firearm HomicideFirearm SuicideTotal Gun Death Rate
Gun Death Rates by Urbanization, 2020
Injury Intent
RuralMedium & Small MetroLarge Metro
Note: The 2013 urban classifications were combined for simplification. Large Central Metro and Large Fringe Metro
classifications were combined as “Large Metro.” Medium Metro and Small Metro classifications were combined as “Medium &
Small Metro.” Lastly, Micropolitan and Noncore classifications were combined as “Rural.”
FIREARM HOMICIDES
Contrary to popular belief, gun homicide rates were relatively the same across urbanization levels in
2020.
• The most urban counties in the U.S. had only a slightly higher gun homicide rate in 2020 than rural
counties, and many rural counties had homicide rates far higher than large cities.
• Thirteen of the 20 counties with the highest rates of firearm homicides from 2016 to 2020 were rural.
• Phillips County, Arkansas, with only 22,000 residents, had the nation’s highest homicide rate.
Meanwhile, Cook County, Illinois (Chicago), which often captures the media’s attention around
violence, had the 79th highest gun homicide rate.

A Year in Review: 2020 Gun Deaths in the U.S. 27
While high rates in sparsely-populated counties represent small total numbers of deaths, these rates
are alarmingly high and indicate a significant burden on many communities across the U.S., not just
in cities. Policy solutions are needed to address the crisis of gun homicides in our biggest cities as
well as in our most rural communities.
CONCENTRATED FIREARM VIOLENCE
This urbanization data illustrate that both rural and urban communities are impacted by gun
violence, yet this does not mean that all communities are equally impacted. In fact, gun homicide
tends to occur in highly concentrated areas. One analysis, for instance, found that in 2015, 26% of
all firearm homicides in the United States occurred in census tracts that contained only 1.5% of the
population.
42
The CDC does not provide census tract gun fatality data and therefore our analysis relies on the
county level as the smallest geographic area to analyze. Because county size varies significantly
within and between states, data at this level does not consistently portray the most accurate
representation of the local areas most impacted by gun violence. Data at the census tract level is
needed to truly understand concentrations of gun violence.
Despite this, even an examination of 2020 county level data can illustrate geographic disparities
of firearm victimization in the U.S. For example, in Maryland from 2016–2020, someone living in
Baltimore City was 30 times more likely to die by firearm than someone living 40 miles away in
Montgomery County.
43
Geographic disparities in gun victimization help to shed light on the upstream factors that often
contribute to violence, including poverty, lack of opportunity, and concentrated disadvantage. The
example above illustrates this, as Montgomery County is among the wealthiest counties in the
country based on the median household income; and in contrast, one in five residents in Baltimore
City live in poverty.
44,45
Understanding the geographic disparities of gun violence, and how it
concentrates in our most disadvantaged communities, is vital in developing effective policy solutions.
FIREARM SUICIDES
Firearm suicide rates are closely related to urbanization. The more rural a county is, the higher the
firearm suicide rate is.
• In 2020, rural counties had the highest rate of firearm suicide, 2.1 times higher than the most
urban counties, where the firearm suicide rate was lowest.
• Seventeen out of the 20 counties with the highest gun suicide rates from 2016 to 2020 were rural
counties.
Rural counties tend to have limited access to mental health services, high rates of alcohol use, and,
importantly, the highest rates of gun ownership. All of these factors contribute to high rates of
firearm suicide.
46
42
Aufrichtig A, Beckett L, Diehm J, & Lartey J. (2017). Want to fix gun violence in America? Go local. The Guardian. Available: https://www.
theguardian.com/us-news/ng-interactive/2017/jan/09/special-report-fixing-gun-violence-in-america
43 Baltimore City is an independent city and thus classified by the United States Census Bureau as a county equivalent.
44 QuickFacts: Montgomery County, Maryland; Baltimore city, Maryland. (2021). United States Census Bureau. Available: https://
www.census. gov/quickfacts/fact/table/montgomerycountymaryland,baltimorecitymaryland/PST045221
45 Income in the past 12 months (in 2019 inflation-adjusted dollars). (2019). United States Census Bureau. Available: https://data.census.gov/
cedsci/table?t=Income%20and%20Poverty&g=0100000US%240500000&tid=ACSST1Y2019.S1902
46 Steelesmith DL, Fontanella CA, & Campo JV. (2019). Contextual factors associated with county-level suicide rates in the United States, 1999
to 2016. JAMA Network Open.

A Year in Review: 2020 Gun Deaths in the U.S. 28
Limited access to mental health care such as healthcare provider shortages, unreliable
transportation, being uninsured or underinsured, poverty, and mental health stigma may be more of
a concern for those living in rural areas and small communities, impeding help-seeking. In addition,
consuming alcohol is considered a proximal risk factor for suicidal behavior due to its variety of
eects on the body, including aecting behaviors and moods.
47
Individuals with a diagnosis of
alcohol use disorder or dependence are at a 10 times greater risk for suicide compared to the general
population, and suicide is a leading cause of death among people who misuse alcohol and drugs.
48
While social, health, and economic disparities aect suicide rates in rural communities, the primary
driver of the dierence in suicide rates between rural and urban communities is gun access. Gun
ownership is much more common among rural areas as nearly six in ten people have a gun in their
household (compared to three in ten people in urban areas), allowing for easier accessibility and
exposure to guns, and resulting in higher firearm suicide rates.
49,50
The high rates of these risk factors within rural communities coupled with high rates of gun
ownership, make rural people particularly at risk for firearm suicide. Eective solutions to address
our nation’s high gun suicide rate should be aimed at supporting rural communities to address these
disparities as well as easy access to firearms by those in crisis.
Conclusion
In 2020, the outbreak of COVID-19 exacerbated the ongoing gun violence epidemic impacting
individuals, families, and communities. Gun violence aects all of us; it remains the leading cause
of death for young people, and it disproportionately impacts both communities of color and those
in the most rural communities. Fortunately, this crisis of gun violence is preventable. We must call
for a comprehensive public health approach to address this crisis, pushing for evidence-based and
equitable gun violence solutions.
47 Substance use and suicide: A nexus requiring a public health approach. (2016). Substance Abuse and Mental Health Services Administration.
Available: https://store.samhsa.gov/sites/default/files/d7/priv/sma16-4935.pdf
48 Ibid.
49 Igielnik R. (2017). Rural and urban gun owners have dierent experiences, views on gun policy. Pew Research Center.
50 Nestadt PS, Triplett P, Fowler DR, & Mojtabai R. (2017). Urban–rural dierences in suicide in the state of Maryland: The role of firearms.
American Journal of Public Health.

A Year in Review: 2020 Gun Deaths in the U.S. 29
Appendix 1: Gun Deaths, 2020
Gun deaths total, 2020
Average daily gun
deaths, 2020
Gun death rate (age-
adjusted) per 100,000,
2020
Homicide 19,384 53 6.19
Suicide 24,292 66 6.95
Unintentional 535 2 0.17
Legal Intervention* 611 2 0.20
Undetermined Intent 400 1 0.12
Total 45,222 124 13.62
Appendix 2: Gun Deaths Among Children and Teens, 2020
Child and teen gun
deaths total, 2020
Average weekly child
and teen gun deaths,
2020
Child and teen gun
death rate (age-
adjusted) per 100,000,
2020
Homicide 2,811 54 3.46
Suicide 1,293 25 1.59
Unintentional 149 3 0.18
Legal Intervention* 25 <1 0.03
Undetermined Intent 90 2 0.11
Total 4,368 84 5.38
Appendix 3: Average Number of Gun Deaths, 2016–2020
Av
erage annual gun
deaths, 2016–2020
Average daily gun
deaths, 2016–2020
Average gun death rate
(age
-adjusted) per
100,000, 2016–2020
Homicide 15,343 42 4.91
Suicide 23,891 65 6.92
Unintentional 492 1 0.15
Legal Intervention* 547 1 0.17
Undetermined Intent 347 1 0.10
Total
40,620 111 12.23

A Year in Review: 2020 Gun Deaths in the U.S. 30
Appendix 4: Average Number of Gun Deaths Among Children and Teens,
2016–2020
Average annual child
and teen gun deaths,
2016
–2020
Average weekly child
and teen gun deaths,
2016–2020
Average child and
teen gun death rate
(age-adjusted) per
100,000, 2016–2020
Homicide 2,088 40 2.55
Suicide 1,231 24 1.50
Unintentional 125 2 0.15
Legal Intervention* 26 <1 0.03
Undetermined Intent 70 1 0.09
Total 3,540 68
4.33
Appendix 5: United States Gun Deaths by Intent, 2011–2020
Total Gun
Deaths
Firearm
Suicide
Deaths
Firearm
Homicide
Deaths
Unintentional
Gun Deaths
Legal
Intervention
Deaths*
Gun Deaths by
Undetermined
Intent
2011 32,351 19,990 11,068 591 454 248
2012 33,563 20,666 11,622 548 471 256
2013 33,636 21,175 11,208 505 467 281
2014 33,594 21,386 11,008 461 464 275
2015 36,252 22,018 12,979 489 484 282
2016 38,658 22,938 14,415 495 510 300
2017 39,773 23,854 14,542 486 553 338
2018 39,740 24,432 13,958 458 539 353
2019 39,707 23,941 14,414 486 520 346
2020 45,222 24,292 19,384 535 611
400
Note: The CDC data classification “legal intervention” under-counts police-involved gun fatalities. To address this gap, media
sources like the Washington Post’s Fatal Force database have tracked police-involved shootings in recent years, reporting that
1,021 people were shot and killed by police in 2020.

A Year in Review: 2020 Gun Deaths in the U.S. 31
Appendix 6: United States Gun Death Rates, by Intent, 2011–2020
Gun Death Rate
(age
-adjusted)
per 100,000
Firearm
Suicide Rate
(age-adjusted)
per 100,000
Firearm
Homicide Rate
(age-adjusted)
per 100,000
Unintentional
Gun Death Rate
(age-adjusted)
per 100,000
2011 10.22 6.2 3.6 0.2
2012 10.51 6.31 3.79 0.19
2013 10.43 6.41 3.63 0.16
2014 10.31 6.37 3.53 0.14
2015 11.06 6.51 4.17 0.15
2016 11.78 6.75 4.63 0.17
2017 11.99 6.93 4.65 0.16
2018 11.9 7.04 4.44 0.14
2019 11.86 6.84 4.59 0.16
2020 13.62 6.95 6.19
0.17

A Year in Review: 2020 Gun Deaths in the U.S. 32
Appendix 7: United States Gun Death Numbers by Demographic Groups,
2020
Total Gun Deaths
Firearm Homicide
Deaths Firearm Suicide Deaths
Female 6,241 2,956 2,904
American Indian or Alaska
Native (non-Hispanic)
72 38 31
Asian or Pacific Islander
(non-Hispanic)
96 44 48
Black (non-Hispanic) 1,589 1,356 206
White (non-Hispanic) 3,870 1,141 2,619
Hispanic or Latino (any
race)
608 375 204
Male 38,981 16,428 19,551
American Indian or Alaska
Native (non-Hispanic)
450 183 236
Asian or Pacific Islander
(non-Hispanic)
531 183 326
Black (non-Hispanic) 12,530 10,548 1,646
White (non-Hispanic) 21,000 2,911 17,343
Hispanic or Latino (any
race)
4,395 2,572
1,586

A Year in Review: 2020 Gun Deaths in the U.S. 33
Appendix 8: United States Gun Death Rates by Demographic Groups, 2020
Total Gun Death
Rate (age-adjusted)
per 10
0,000
Firearm Homicide
Rate (age-adjusted)
per 100,000
Firearm Suicide
Rate (age-adjusted)
per 100,000
Female (all races/
ethnicities)
3.77 1.86 1.79
American Indian or Alaska
Native (non-Hispanic)
5.00 2.79 2.00
Asian or Pacific Islander
(non-Hispanic)
0.83 0.39 0.45
Black (non-Hispanic) 7.07 6.05 0.90
White (non-Hispanic) 3.72 1.17 2.45
Hispanic or Latino (any
race)
1.93 1.21 0.67
Male (all races/
ethnicities)
23.80 10.41 12.50
American Indian or Alaska
Native (non-Hispanic)
32.90 13.47 17.28
Asian or Pacific Islander
(non-Hispanic)
5.04 1.71 3.13
Black (non-Hispanic) 57.49 48.16 7.78
White (non-Hispanic) 19.76 3.15 15.84
Hispanic or Latino (any
race)
13.78 7.76
5.29

A Year in Review: 2020 Gun Deaths in the U.S. 34
Appendix 9: State Variations, 2020
State
Ranking,
Highest
to
Lowest
Total
Gun
Death
Rate
Total
Gun
Deaths
Total Gun
Death
Rate (age-
adjusted)
per
100,000
Total Gun
Deaths
Among
Children
and Teens
(Ages
0-19)
Child and
Teen Gun
Death
Rate per
100,000
Firearm
Homicide
Deaths
Firearm
Homicide
Rate (age-
adjusted)
per
100,000
Ranking,
Highest
to Lowest
Firearm
Homicide
Rate
Firearm
Suicide
Deaths
Firearm
Suicide
Rate (age-
adjusted)
per
100,000
Ranking,
Highest
to
Lowest
Firearm
Suicide
Rate
Alabama 5 1,141 23
.58 96 7.92 564 12.36 4 542 10.55 14
Alaska 6 175 23.52 22 11.27 27 3.75 31 133 17.78 2
Arizona 21 1,265 16.67 101 5.48 382 5.48 25 830 10.42 17
Arkansas 8 673 22.55 77 9.91 282 10.06 7 364 11.54 7
California 45 3,449 8.54 301 3.07 1,732 4.49 29 1,552 3.63 44
Colorado 23 922 15.41 82 5.87 235 4.07 30 654 10.77 13
Connecticut 46 219 6.01 18 Unreliable 101 3.06 35 109 2.67 46
Delaware 26 135 14.4 15 Unreliable 76 8.67 11 58 5.64 41
District of
Columbia 10 167 21
.94 25 16.63 157 20.35 1 Suppressed Suppressed *
Florida 30 3,041 13.71 251 5.31 1,227 6.35 21 1,730 6.94 38
Georgia 16
1,897 17.71 209 7.48 899 8.63 12 939 8.52 26
Hawaii 51 50 3.37 Suppressed Suppressed 16 Unreliable * 31 2.05 48
Idaho 17 321 17.57 26 5.21 26 1.55 45 277 15.07 4
Illinois 28 1,745 14.07 196 6.33 1,167 9.74 9 543 4.05 43
Indiana 18 1,159 17.28 155 8.86 496 7.76 14 609 8.65 25
Iowa 39 351 11.16 31 3.81 83 2.85 37 260 8.03 29
Kansas 20 494 16.86 70 9.01 160 5.79 23 314 10.4 18
Kentucky 14 902 20.12 97 8.70 341 8.11 13 518 11.03 11
Louisiana 2 1,183 26.26 150 12.56 747 17.1 3 406 8.52 27
Maine 41 153 10.39 Suppressed Suppressed 15 Unreliable * 132 8.84 24
Maryland 34 803 13.52 73 4.91 526 9.27 10 267 4.09 42
Massachusetts 50 268 3.74
21 1.36 130 1.93 44 134 1.75 50
Michigan 25 1,454
14.6 117 4.91 672 7.3 18 761 7.1 36
Minnesota 44 513 8.9 46 3.19 138 2.53 41 354 5.96 40
Mississippi 1 818 28.63 86 11.14 499 17.89 2 278 9.35 23
Missouri 4 1,426 23.89 131 8.59 683 11.98 5 704 11.21 9
Montana 12 238 20.89 14 Unreliable 33 3.46 32 189 15.82 3
Nebraska 42 197 10.13 19 Unreliable 49 2.65 39 139 6.99 37
Nevada 19 547 16.96 48 6.27 148 4.97 27 372 11.12 10
New
Hampshire 43 128 8
.92 Suppressed Suppressed Suppressed Suppressed * 118 8.16 28
New Jersey 49 443 5.03 31 1.45 253 3.12 34 181 1.82 49

A Year in Review: 2020 Gun Deaths in the U.S. 35
State
Ranking,
Highest
to
Lowest
Total
Gun
Death
Rate
Total
Gun
Deaths
Total Gun
Death
Rate (age-
adjusted)
per
100,000
Total Gun
Deaths
Among
Children
and Teens
(Ages
0-19)
Child and
Teen Gun
Death
Rate per
100,000
Firearm
Homicide
Deaths
Firearm
Homicide
Rate (age-
adjusted)
per
100,000
Ranking,
Highest
to Lowest
Firearm
Homicide
Rate
Firearm
Suicide
Deaths
Firearm
Suicide
Rate (age-
adjusted)
per
100,000
Ranking,
Highest
to
Lowest
Firearm
Suicide
Rate
New Mexico 7 479 22
.66 41 7.77 149 7.54 16 303 13.73 5
New York 47 1,052 5.32 82 1.84 561 3.04 36 462 2.12 47
North Carolina 22 1,699 15.97 177 6.82 744 7.34 17 879 7.85 30
North Dakota 29 100 13.77 Suppressed Suppressed 17 Unreliable * 77 10.45 16
Ohio 24 1,764 15.19 186 6.48 824 7.61 15 903 7.24 34
Oklahoma 13 826 20.75 73 6.90 269 7.07 19 538 13.18 6
Oregon 36 592 12.97 39 4.07 109 2.65 40 454 9.63 21
Pennsylvania 31 1,752 13.59 169 5.72 788 6.75 20 919 6.47 39
Rhode Island 48 54 5.13 Suppressed Suppressed 22 2.22 43 30 2.7 45
South Carolina 9 1,131 22.01 127 10.14 528 10.9 6 565 10.3 19
South Dakota 33 120 13.56 10 Unreliable 26 3.29 33 88 9.63 22
Tennessee
11
1,473 21.35 121 7.21 652 10.03 8 767 10.5 15
Texas 27 4,164 14.18 485 5.88 1,734 5.96 22 2,287 7.78 31
Utah 32 429 13.59 46 4.48 75 2.28 42 339 10.83 12
Vermont 38 76 11.58 Suppressed Suppressed Suppressed Suppressed * 69 10.24 20
Virginia 35 1,174 13.43 126 6.03 440 5.33 26 697 7.69 32
Washington 40 864 10.93 66 3.59 211 2.81 38 618 7.67 33
West Virginia 15 325 18.06 17 Unreliable 87 5.52 24 220 11.53 8
Wisconsin 37 717 12.2 59 4.18 253 4.62 28 442 7.15 35
Wyoming 3 154 25.9 Suppressed Suppressed 18 Unreliable * 128 20.91 1
*Denotes where the state firearm homicide or suicide rate is unreliable and cannot be compared.

A Year in Review: 2020 Gun Deaths in the U.S. 36
Appendix 10: Top 5 Counties With the Highest Firearm Homicide
Rate, 2016–2020
Top 5 Counties (by ranking) County & State
Firearm Homicide Rate (age-
adjusted) per 100,000
1 Phillips County, AR 55.45
2 Lowndes County, AL 48.36
3 St. Louis City, MO 45.36
4 Macon County, AL 44.34
5 Petersburg City, VA 42.45
Appendix 11: Top 5 Counties W
ith the Highest Firearm Suicide Rate,
2016–2020
Top 5 Counties (by ranking) County & State
Firearm Suicide Rate (age-
adjusted) per 100,000
1 Park County, CO 34.83
2 Lincoln County, MT 27.54
3 La Paz County, AZ 27.06
4 Aransas County, TX 26.82
5 Lumpkin County, GA 26.13
Appendix 12: Top 5 Counties W
ith the Highest Firearm Death Rate,
2016–2020
Top 5 Counties (by ranking) County & State
Firearm Death Rate (age-
adjusted) per 100,000
1 Phillips County, AR 71.77
2 Wade Hampton Census Area, AK 66.32
3 Lowndes County, AL 62.38
4 Quay County, NM 55.68
5 Petersburg City, VA 53.53

A Year in Review: 2020 Gun Deaths in the U.S. 37
Appendix 13: Rise in Gun Homicides by State, 2019–2020
State
Age-Adjusted Rate
(per 100,000),
2019
Age-Adjusted Rate
(per 100,000),
2020
2019–2020
Rate Di
fference Percent Change
Alabama 10.67 12.36 1.69 16%
Alaska 7.2 3.75 -3.45 -48%
Arizona 4.11 5.48 1.37 33%
Arkansas 7.38 10.06 2.68 36%
California 3.18 4.49 1.31 41%
Colorado 2.89 4.07 1.18 41%
Connecticut 1.97 3.06 1.09 55%
Delaware 5.21 8.67 3.46 66%
District of
Columbia
16.52 20.35 3.83 23%
Florida 5.2 6.35 1.15 22%
Georgia 6.67 8.63 1.96 29%
Hawaii Unreliable Unreliable N/A N/A
Idaho Unreliable 1.55 N/A N/A
Illinois 6.58 9.74 3.16 48%
Indiana 5.53 7.76 2.23 40%
Iowa 1.72 2.85 1.13 66%
Kansas 3.51 5.79 2.28 65%
Kentucky 4.82 8.11 3.29 68%
Louisiana 12.35 17.1 4.75 38%
Maine Unreliable Unreliable N/A N/A
Maryland 8.19 9.27 1.08 13%
Massachusetts 1.39 1.93 0.54 39%
Michigan 4.95 7.3 2.35 47%
Minnesota 1.9 2.53 0.63 33%
Mississippi 13.08 17.89 4.81 37%
Missouri 9.33 11.98 2.65
28%
Montana 2.29 3.46 1.17 51%
Nebraska 2.09 2.65 0.56 27%
Nevada 3.99 4.97 0.98 25%
New Hampshire 1.48 Suppressed N/A N/A
New Jersey 2.39 3.12 0.73 31%

A Year in Review: 2020 Gun Deaths in the U.S. 38
State
Age-Adjusted Rate
(per 100,000),
2019
Age-Adjusted Rate
(per 100,000),
2020
2019–2020
Rate Difference Percent Change
New Mexico 8.16 7.54 -0.62 -8%
New York 1.74 3.04 1.3 75%
North Carolina 5.41 7.34 1.93 36%
North Dakota Unreliable Unreliable N/A N/A
Ohio 5.21 7.61 2.4 46%
Oklahoma 6.56 7.07 0.51 8%
Oregon 1.88 2.65 0.77 41%
Pennsylvania 4.65 6.75 2.1 45%
Rhode Island Unreliable 2.22 N/A N/A
South Carolina 9.5 10.9 1.4 15%
South Dakota Unreliable 3.29 N/A N/A
Tennessee 7.37 10.03 2.66 36%
Texas 4.5 5.96 1.46 32%
Utah 1.6 2.28 0.68 43%
Vermont Suppressed Suppressed N/A N/A
Virginia 4.18 5.33 1.15 28%
Washington 2.22 2.81 0.59 27%
West Virginia 4.86 5.52 0.66 14%
Wisconsin 2.82 4.62 1.8 64%
Wyoming Unreliable Unreliable N/A N/A

A Year in Review: 2020 Gun Deaths in the U.S. 39
Glossary
Age
-adjusted rate: The rates of almost all causes of death vary by age. Age adjustment is a
technique for “removing” the effects of age from crude rates to allow meaningful comparisons
across populations with dierent underlying age structures. Age-adjusted death rates are weighted
averages of the age-specific death rates, where the weights represent a fixed population by age.
An age-adjusted rate represents the rate that would have existed had the age-specific rates of the
particular year prevailed in a population whose age distribution was the same as that of the fixed
population. Age-adjusted rates should be viewed as relative indexes rather than as direct or actual
measures of mortality risk.
Burden of injury: Describes the impact of a health problem (injury), including death and loss of
health due to injuries, related financial costs, and other indicators.
Cause of death: Based on medical information—including injury diagnoses and external causes of
injury—entered on death certificates filed in the United States. This information is classified and
coded per the International Statistical Classification of Diseases and Related Health Problems, 10th
Revision (ICD–10).
International C
lassification of Diseases (ICD): Causes of death are classified per the
International Classification of Diseases. Deaths for 1999 and beyond are classified using
the 10th Revision (ICD-10). ICD is designed to promote international comparability in the
collection, processing, classification, and presentation of mortality statistics. This includes
providing a format for reporting causes of death on the death certificate. The reported
conditions are then translated into medical codes through the use of the classification
structure and the selection and modification rules contained in the applicable revision of the
ICD, published by the World Health Organization (WHO).
Underlying Cause of Death database: The database contains mortality data based on
information from all death certificates filed in the 50 states and the District of Columbia.
Deaths of nonresidents (e.g., nonresident aliens, nationals living abroad, residents of Puerto
Rico, Guam, the Virgin Islands, and other territories of the U.S.) and fetal deaths are excluded.
Each death certificate identifies a single underlying cause of death and demographic data.
County Classification: The CDC categorizes all counties into six levels of urbanization that
incorporate population number and density. From largest and most urban to smallest and most rural,
they are:
Large central metro counties: Counties part of a metropolitan statistical area with >1
million population and
cover a principal city; most urban, large cities.
Large fringe metro counties: Counties part of a metropolitan statistical area with >1 million
population but do not cover a principal city; akin to suburbs.
Medium metro counties: Counties part of a metropolitan statistical area of 250,000–
999,999 population.
Small metro counties: Counties part of a metropolitan statistical area of less than 250,000
population.

A Year in Review: 2020 Gun Deaths in the U.S. 40
Micropolitan (non-metro) counties: Counties part of a micropolitan statistical area (has an
urban cluster of >10,000 but <50,000 population).
Non-core (non-metro) counties: Counties not part of a metropolitan or micropolitan statistical
area; the most rural counties.
Injury Intent: Describes whether an injury was caused by an act carried out on purpose by oneself
or by another person(s), with the goal of injuring or killing. For the CDC data used in this report, all
injury-related causes of death are classified by intent and by mechanism, determined according to
the ICD-10 external cause of injury coded as the underlying cause of death on the death certificate.
Homicide: Injuries inflicted by another person with the intent to injure or kill, by any means.
Excludes injuries due to legal intervention and operations of war. The ICD-10 cause of death
codes for firearm homicide include X93 Assault by handgun discharge; X94 Assault by rifle,
shotgun, and larger firearm discharge; X95 Assault by other and unspecified firearm and gun
discharge; and *U01.4 Terrorism involving firearms.
Legal Intervention: Injuries inflicted by the police or other law-enforcing agents, including
military on duty, in the course of arresting or attempting to arrest lawbreakers, suppressing
disturbances, maintaining order, and other legal actions. Excludes injuries caused by civil
insurrections. The ICD-10 cause of death code for legal intervention by firearm is Y35.0 Legal
intervention involving firearm discharge.
Suicide: An intentionally self-inflicted injury that results in death. The ICD-10 cause of death
codes for firearm suicide are X72 Intentional self-harm by handgun discharge; X73 Intentional
self-harm by rifle, shotgun, and larger firearm discharge; and X74 Intentional self-harm by
other and unspecified firearm and gun discharge.
Undetermined Intent: Events where available information is insucient to enable a medical
or legal authority to make a distinction between accident, self-harm, and assault. The ICD-10
cause of death codes for firearm deaths of undetermined intent are Y22 Handgun discharge,
undetermined intent; Y23 Rifle, shotgun and larger firearm discharge, undetermined intent;
and Y24 Other and unspecified firearm discharge, undetermined intent.
Unintentional: Unintentional injury that results in death. The ICD-10 cause of death codes for
unintentional firearm deaths are W32 Accidental handgun discharge and malfunction; W33
Accidental rifle, shotgun and larger firearm discharge; and W34 Accidental discharge and
malfunction from other and unspecified firearms and guns.
Injury Mechanism or Method: The cause, or mechanism, of injury is the way in which the person
sustained the injury; how the person was injured; or the process by which the injury occurred.
Suppressed: Rates are marked as suppressed when there are zero to nine (0–9) deaths.
Unreliable: Rates are marked as “unreliable” when the death count is less than 20.
