
1
New York City
Automated Speed Enforcement Program
2022 Report

2
In 2013, the New York State Legislature and Governor enacted Section 1180-b of New
York State’s Vehicle and Trafc Law (VTL), which granted New York City the authority to
pilot an automated speed enforcement program to deter speeding in 20 school speed
zones. The rst speed camera violation was issued in January 2014. In June 2014, the
pilot was expanded to a total of 140 school speed zones, in order to support the pursuit
of the City’s Vision Zero goal of eliminating trafc deaths and serious injuries.
In 2019, the New York State Legislature and Governor authorized the New York City
Department of Transportation (NYC DOT) to deploy speed cameras in 750 school
speed zones on all weekdays between 6 AM and 10 PM. The authorization is codied in
Article 30 of the New York State Vehicle and Trafc Law. Cameras may be placed at
any location within a quarter-mile radius of a school building. This change codied into
law NYC DOT’s practice of using data to guide installations to where deterrence of
dangerous speeding can have the greatest impact on preventing injury and death. NYC
DOT data specialists have prioritized installations at locations with the highest
incidence of speeding and serious crashes. NYC DOT completed installation of at least
one camera in all 750 zones by June 2020, and has been adding cameras within these
zones. As of May 2022, there are over 2000 cameras operational in New York City. In
Summer 2022, camera hours will be expanded to 24 hours a day, seven days a week, in
recognition of the proven safety benets of this program.
The speed camera program has proven effective and efcient in its goal of reducing
both dangerous speeding and its consequences. As of December 2021, speeding at
xed camera locations had dropped, on average, 73 percent. Many large corridors,
including the Grand Concourse, Amsterdam Avenue, and Amboy Road, have seen
even greater decreases. When compared to similar roads outside school speed zones,
corridors that received cameras after 2019 program expansions showed greater
decreases in deaths and serious injuries in 2020.
Executive Summary

3
DOT will continue to install cameras at data-guided locations in 2022, until a total of
2,220 cameras are operational.
This report covers data from the program from its inception through December 2021.
However, crash injury and severity data is only available for calendar years 2019 and
2020. This is because starting in 2019, the
National Highway Safety Administration
(NHTSA) mandated that all jurisdictions
follow the Model Minimum Uniform Crash
Criteria (MMUCC) 4th Edition guidelines for
collecting serious injury crash data. They
did this to standardize what data is being collected across the country. Accordingly, the
New York State Department of Motor Vehicles (DMV) changed their denition of severe,
“A”-type injuries. As a result of this change, some injuries not previously attributed to
the serious injury classication are now included. This has made data from 2019 and
2020 difcult to compare to previous years. Any numerical increase in severe injuries
may reect the change in formula and not an actual change in the trend of severe
injuries, and so comparisons to before 2019 are not included.
As of December 2021, speeding at
fixed camera locations had
dropped, on average, 73 percent.

4
Dangerous Speeding is a Leading Cause of
Serious Crashes
Excessive speed is one of the leading factors in serious crashes in New York City.
The faster a vehicle is traveling, the more time and space a driver needs to react to
circumstances in order to prevent a crash. A driver at 40 MPH needs 300 feet to
perceive, react, and brake in the face of an unexpected event—twice as far as a driver
at 25 MPH, who only needs 150 feet.
Not only does speeding make it more difcult to avoid a crash, but it also worsens
the damage caused upon impact when a collision happens. Even a small difference
in vehicle speed makes a big impact in terms of safety – a pedestrian who is struck
by a vehicle traveling at 30 MPH is twice as likely to be killed as a pedestrian struck by
a vehicle traveling at 25 MPH.
When New York City initiated its Vision Zero street safety program in 2014, speeding
was one of the top concerns raised by residents during Vision Zero town halls and
workshops held by the New York City Department of Transportation (DOT) and New
York City Police Department (NYPD). It remains a concern of residents across the City
today, despite the progress achieved through the speed camera program.
These facts inform the New York City’s Vision Zero initiative’s focus on speed
management. The City uses a variety of approaches aside from speed cameras,
including increased installation of speed bumps, focused NYPD enforcement, signal
reprogramming, reduced speed limits and streeredesigns to combat speeding.
New York City Automated
Speed Enforcement Program

5
New York City’s Speeding Solutions Toolkit
The City uses a variety of methods in addition to automated enforcement to encourage
people to drive at safe speeds. DOT and NYPD frequently assess the speeding
conditions in neighborhoods across the City, and identify the appropriate solutions for
each context.
Speed Limits
Speed limits promote road safety by establishing an upper limit on speed appropriate
for the street’s design, vehicle volume and pedestrian density. On November 7, 2014,
New York City reduced the citywide default speed limit to 25 MPH, and has installed
over 5,000 new speed limit signs, each with a rider alerting motorists to the use of
Photo Enforcement. While some city streets remained signed for faster than 25 MPH,
over the years more and more of them have been lowered. In 2021, 45 additional miles
of these streets had their speed limits lowered, including Pelham Parkway and Jerome
Avenue in the Bronx, Woodhaven and Cross-Bay Boulevards in Queens, Conduit
Boulevard in Brooklyn, and Hylan Boulevard in Staten Island.
NYPD Enforcement
The ofcers of the NYPD enforce the
speed limit in order to deter dangerous
driving. In contrast to speed camera
notices of liability, traditional speeding
summonses carry signicant nancial
penalties, along with points on the driver’s
license and signicant consequences
for the driver’s insurance. In 2021 NYPD
issued approximately 107,970
speeding summonses.
6
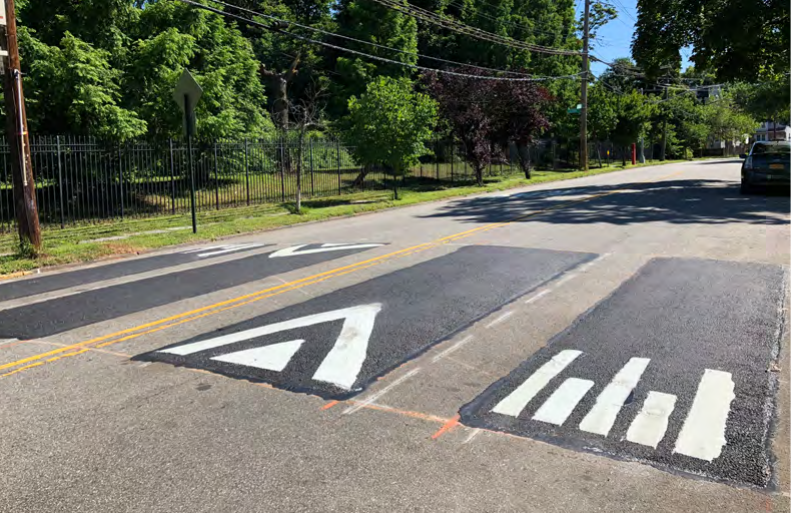
Speed Humps and Cushions
Speed humps are a raised area of a roadway, typically 3 to 4 inches, which deects the
wheels and frame of a traversing vehicle to reduce vehicle speed. On bus routes, truck
routes, and key emergency corridors, where a traditional speed hump is unsuitable, a
speed cushion may be used instead. These raised sections have cutouts spaced for
large vehicle tires, but still require passenger vehicles to slow down. From 2014 through
2021, the City has installed 2,345 standard speed humps. Speed cushion installations
became part of DOT’s toolkit in 2018 and as of 2021, 53 have been built.
Street Improvement Projects
Street redesign strategies which reduce speeding include removing excess width from
existing trafc lanes or converting a lane to use for pedestrians or cyclists. This “trafc
calming” is a context-dependent approach to reducing excessive speeding. The City
has completed more than 800 total safety engineering projects since the start of Vision
Zero. The majority of these projects have taken place at Vision Zero Priority Locations —
the intersections, corridors, and areas with disproportionately high pedestrian deaths
and serious injuries.
7
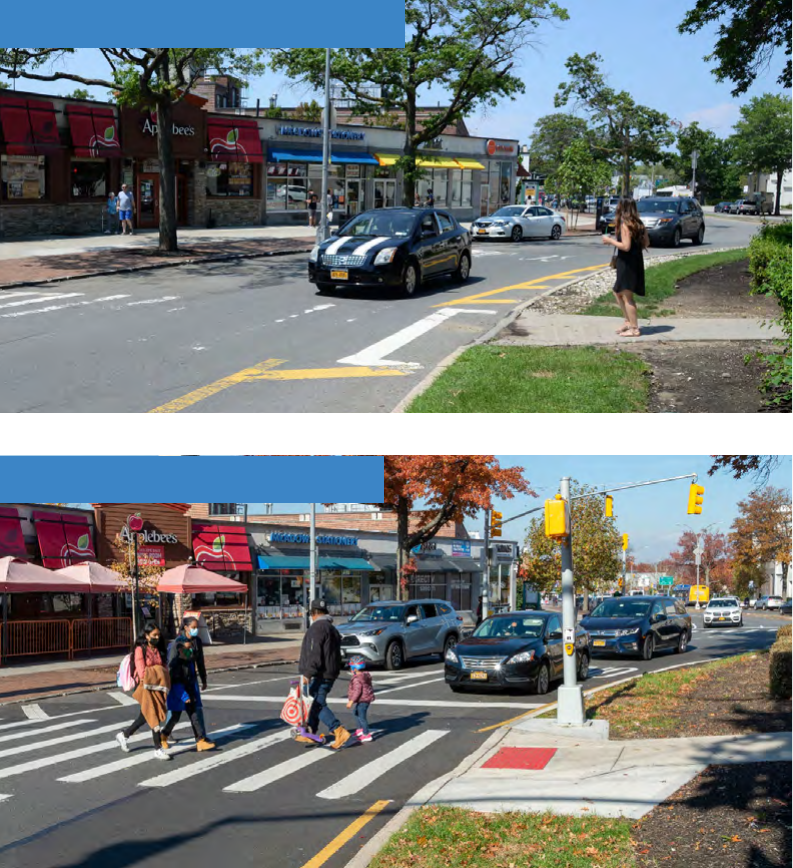
BEFORE: 188th Street & 64th Avenue, Queens
AFTER: 188th Street & 64th Avenue, Queens

8
Community Outreach
Vision Zero Street Teams are a joint outreach project of NYPD and DOT that focus on
the most crash-prone corridors of New York City. In recent years, these included
Northern Boulevard and Jamaica Avenue in Queens, Grand Concourse in the Bronx,
portions of Lexington Avenue and Second Avenue in Manhattan, Hylan Boulevard in
Staten Island, and Linden Boulevard, Bedford Avenue, and Bay Parkway in Brooklyn.
Street Teams hand out postcards focused on safety tips unique to each corridor while
NYPD ofcers focus enforcement on dangerous driving behaviors including speeding.
Education
NYC DOT uses market research to guide its hard-hitting public education campaigns
aimed at stopping dangerous driving behavior, with a particular emphasis on speeding.
Advertisements on television, radio, billboards, bus stops and elsewhere alert
aggressive drivers of the consequences of their behavior. These ads have proven
effective: In 2021, 81 percent of drivers thought the ads encouraged them to be more
responsible behind the wheel, 82 percent said they would give more thought to the
speed at which they approached crosswalks and intersections, and 82 said they would
pay more attention to pedestrians and cyclists while driving.

9
New York City’s Speed Camera Program
In 2013, the New York State Legislature and Governor Cuomo granted New York City
the authority to pilot an automated speed enforcement program to deter speeding in 20
school speed zones. In June 2014, the pilot was expanded to a total of 140 school
speed zones as part of the Vision Zero program. Chapter 30 of the Laws of 2019
expanded both the number of school speed zones and the program’s hours, which
were previously limited to one hour before, after, or during school hours, or a half hour
before, after, or during school activities. NYC DOT thereby became authorized to deploy
speed cameras in 750 school speed zones on all weekdays between 6 AM and 10 PM.
NYC DOT completed the expansion of at least one camera in each of the 750 zones in
June 2020 and has been adding cameras within those zones. Cameras may be located
on any street within a quarter-mile radius of a school, which allows NYC DOT the
discretion to place the devices where they are most needed.
In June 2022, the State Legislature passed a new law permitting NYC DOT to operate
the cameras 24 hours a day, seven days a week. These new hours will go into effect on
August 1, 2022. This report does not include analysis relating to the new hours.
NYC’s speed camera program uses the same radar and laser technology relied upon
by law enforcement to measure a vehicle’s speed. If the system’s radar nds that the
vehicle is exceeding the speed
limit by more than ten miles per
hour, images of the vehicle are
recorded, including the license
plate. The violation is reviewed by
a trained DOT staff technician for
accuracy. If the technician veries
that the identied vehicle was exceeding the speed limit by more than ten miles per
hour within a school speed zone between 6 AM and 10 PM on a weekday, the
technician will issue a Notice of Liability (NOL) to the registered owner of the vehicle.
Cameras do not capture an image of the individual driving the vehicle; the violation is
the responsibility of the owner.
The ne associated with a speed camera NOL is $50, regardless of the speed by which
the vehicle was exceeding the speed limit, or whether it was a repeat offense. This is far
less than the cost of a summons issued by a police ofcer for speeding in a school
speed zone, which could range on the rst offense from $90-$600, depending on the
motorist’s speed and prior record, plus an $88 State surcharge. The violation is
reviewed by a 88 State surcharge. In addition, a conviction on a summons issued by a
NYC DOT thereby became authorized
to deploy speed cameras in 750 school
speed zones on all weekdays between
6 AM and 10 PM.

10
police ofcer will become part of the vehicle operator’s driving record, adding points
and inuencing insurance rates. Because NYC DOT cameras cannot identify a driver, no
points can be issued for a speed camera violation.
State law prohibits the City from using the speed camera program to issue violations for
law-breaking speeding unless it is observed within a quarter-mile radius of a school
building. In the absence of a warrant, camera footage may not be used for any purpose
other than speed enforcement.
In 2021, New York City’s speed cameras issued a total of 4,368,879 NOLs.

11
Results of Automated Speed Enforcement
State law requires the City to report on injuries in speed camera enforced school speed
zones using State-issued data to the extent to which such data is available from the
New York State Department of Motor Vehicles (NYS DMV). The crash data NYC DOT
relies upon originates in motor vehicle collision reports compiled by New York City
Police ofcers at crash scenes. The individual crash reports are sent by NYPD to the
DMV and State DOT, who enter the information into electronic databases, attribute
locations to the collisions, categorize trafc injuries by severity, and identify errors – a
process which typically takes well over a year. The most recently available year of data
is 2020.
Starting in 2019, NHTSA mandated that all jurisdictions follow the Model Minimum
Uniform Crash Criteria (MMUCC) 4th Edition guidelines for collecting Serious Injury
crash data, in order to standardize what data is being collected across the country.
Accordingly the New York State DMV changed their denition of severe, “A”-type
injuries. As a result of this change, some
injuries not previously attributed to the
serious injury classication are now
included in it. This change has made some
data from 2019 and 2020 difcult to
compare to previous years, because any
numerical increase in severe injuries may reect the change in the formula and not an
actual change in the injuries, and so comparisons with earlier year serious injuries are
not included in this report.
The “before” and “after” analysis presented below examines the corridors of 2019
camera installations and compares them to New York City at large between 2018 and
2020. A corridor is dened as the street where the camera is located, for a distance of
one quarter-mile from the camera itself. In order to obtain a full-year period of data to
use as the “after” scenario, the below gures only incorporate locations that had a
camera installed prior to January 1st, 2020. These results therefore reect the impact of
cameras at many of the new locations installed after the State law expanded the
number of school speed zones and their hours of operation in Summer 2019. Corridors
with camera installations in 2018 and 2020 are excluded from the citywide control group
used as a comparison, as these streets would have experienced an intervention in the
“before” and/or “after” period. Also, to isolate the effect of the 2019 camera cohort only,
2019 camera installations with a 2018 or 2020 camera installation on the same corridor
within ¼ mile were excluded entirely.
As of December 2021, speeding
at fixed camera locations had
dropped, on average, 73 percent.

12
The type of comparison is most appropriate for determining the impact of cameras due
to the unique and unprecedented changes to trafc patterns wrought by the Covid-19
pandemic beginning in 2020. From March of 2020, pedestrian and motor vehicle
volumes dropped dramatically and remained below 2019 levels, particularly in
Manhattan. New York City public schools shifted to remote learning in mid-March and
did not return to full in-person lessons until 2021, signicantly altering exposures by all
modes of travel in the vicinity of speed cameras. A conventional “before” and “after”
examination of just the corridors with cameras would not take into account the changes
in the citywide baseline of trafc. Here, comparisons to a control group of corridors
without cameras allows DOT to isolate the effects of the speed cameras as much as
possible. With the speed camera program now well-established alongside a
comprehensive program of Vision Zero trafc safety enhancements, it is difcult to
pinpoint how much one particular intervention alone may be responsible for changes in
injury outcomes, rather than these gures being the product of multiple coexisting
engineering, enforcement, and education efforts occurring across the City.
With the above caveats, data indicates the corridors that received cameras in 2019
showed a greater decline in total injuries than corridors without cameras. Looking
specically at modes of transportation, while pedestrian and motor vehicle occupant
casualties dramatically decreased on both types of corridor, likely due to reduced
activity during the early months of the pandemic, the improvements were greater on
streets with speed cameras. Cyclist injuries increased on both types of corridors, likely
reecting the increased popularity of cycling as a socially-distanced form of
transportation. Overall, results continue to show a safety benet to having speed
cameras, and future analysis using full-year data from 2021 and beyond will provide a
clearer picture.
Source: New York State Department of Transportation/New York State Department of Motor Vehicles
New Camera Corridors Control Corridors
2018 2020 Change 2018 2020 Change
All Injuries
All Modes 2,116 1,369 -35.3% 23,606 16,857 -28.6%
Pedestrians 414 272 -34.3% 5,021 3,354 -33.2%
Cyclists 122 125 +2.5% 1,719 1,823 +6.1%
Motor Vehicle Occupants 1,580 972 -38.5% 16,866 11,680 -30.8%
Changes in Injuries in New School Speed Zones,
Before and After Camera Program Expansion

13
Boston Road
Dec
2021
96
First
Month
431
-78%
Hylan Boulevard
Dec
2021
47
First
Month
360
-87%
4th Avenue (BK)
Dec
2021
77
First
Month
463
-83%
Amsterdam Avenue
Dec
2021
30
First
Month
143
-79%
Grand Concourse
Dec
2021
60
First
Month
604
-90%
Amboy Road
Dec
2021
25
First
Month
201
-88%
Ocean Avenue
Dec
2021
70
First
Month
472
-85%
Queens Boulevard
Dec
2021
347
First
Month
494
-82%
Hillside Avenue
Dec
2021
115
First
Month
1279
-91%
Decline in Average Daily Speeding Violations in
Camera-Enforcement School Speed Zones Along Key Corridors

14
Where Cameras and Violators are Located
Speed cameras are an equitable enforcement solution: They cannot identify an
individual driver and do not look at anything other than the speed of the vehicle. By
choosing the locations of camera installations based solely on serious crash incidence
and frequency of speeding, NYC DOT can ensure that resources are directed to where
they have the most benet while also ensuring that no individual community lacks
protection or has an over-concentration of cameras. Indeed, with 750 school speed
zones, every part of New York City with a signicant speeding problem has this safety
intervention available. There is no correlation between neighborhood income or
neighborhood percentage non-white population and the number of speed camera
violations issued per lane mile.
An analysis of all speed camera violations issued in October 2021 found that 41 percent
of violations – two out of ve – were issued to a vehicle with a registered address
located outside New York City. Two-thirds of all violations, or 67 percent, were issued to
a vehicle with an address located more than three miles away from the camera, far from
the surrounding neighborhood. This shows that overwhelmingly, it is not local residents
who are receiving violations, but local vulnerable road users are receiving benets.

15
The Extent of Dangerous Speeding in School Zones
School speed zones are the area within a quarter-mile radius of a school building. NYC
DOT’s cameras are drastically reducing dangerous speeding in these zones. While the
vast majority of speeders are not exceeding the limit by more than 20 mpg, these speeds
are still highly dangerous and greatly increase the likelihood of pedestrian death.
Speed of Vehicle
Over the Posted Limit
Number of Violations,
2021
Percentage of
Violations, 2021
>10, but < or = 20 mph 4,269,335 97.7%
>20, but < or = 30 mph 92,228 2.1%
>30, but < or = 40 mph 6,307 0.14%
>40 mph 1,009 0.02%
TOTAL 4,368,879 100%
Source: New York City Department of Transportation
Speed cameras do not issue a violation unless the vehicle is traveling at least 11 miles
per hour above the posted speed limit. In practice, this means that at most locations, a
vehicle must be traveling at least 36 miles per hour in a 25 MPH zone. Citywide, almost
all notices of liability – 97.7 percent – went to vehicles traveling at least 11 but less than
20 miles per hour above the limit.
Violations by Speed Over Limit, 2021

16
Sufficiency of Speed Camera Program Hours
In 2021, about 30 percent of the 217 non-highway trafc fatalities in New York City took
place in school speed zones with cameras, but at times when those cameras were not
legally permitted to operate. Those times include overnight hours (10 PM through 6 AM)
on weekdays, and the entirety of weekends.
Looking solely at the 143 fatal crashes that took place within school speed zones with
xed cameras, approximately 24 percent (35 crashes) happened on weekends, and
another 22 percent (31 percent) happened overnight on a weekday. NYC DOT believes
the expansion of the hours of operation of the speed camera program to seven days a
week, twenty-four hours a day, will reduce the incidence of speeding at those times,
and will hopefully in turn reduce serious injuries and fatalities.
Looking at the ratio of camera trigger events to overall trafc volume can provide
insights into both how the hours of operation practiced in recent years succeeded in
reducing speeding and how further expansion will benet New Yorkers. The following
“heat map,” drawn from June 2021
data, indicates the percentage of
vehicles photographed speeding by the
cameras. The number of total trigger
events is divided by vehicle volume in
order to control for times of day when
more trafc is present. Red boxes
indicate larger proportions of vehicles
captured exceeding the speed limit,
whereas green shading indicates fewer
speeders. The current hours of
operation permitted by State law are outlined in black. This indicates a pattern of
relatively less speeding during camera hours of operation, and a higher proportion of
vehicles speeding when the cameras were forbidden by law to issue violations.
NYC DOT believes the upcoming
expansion of the hours of operation of
the speed camera program to seven
days a week, twenty-four hours a day,
will reduce the incidence of speeding
at those times, and will hopefully in turn
reduce serious injuries and fatalities.

17
Sunday Monday Tuesday Wednesday Thursday Friday Saturday
12 AM
1 AM
2 AM
3 AM
4 AM
5 AM
6 AM
7 AM
8 AM
9 AM
10 AM
11 AM
12 PM
1 PM
2 PM
3 PM
4 PM
5 PM
6 PM
7 PM
8 PM
9 PM
10 PM
11 PM
Ratio of Speed Camera Trigger Events to Total Traffic Volumes
All Locations, June 2021
Note: Black outline indicates speed camera hours of operation under State law.
Source: NYC DOT

18
Repeat Violators
In the eight full calendar years New York City’s speed camera program has been in
operation, 46 percent of plates receiving a Notice of Liability have not received a
second. An additional 19 percent received no more than two over this period. In 2021,
55 percent of vehicles receiving NOLs only got one, even as the number of cameras
(and therefore the odds of any speeding vehicle being captured on camera) increased.
While the majority of drivers are deterred from speeding by one or two camera
violations, there is a group of recidivist speeders who continue to drive unsafely despite
receiving multiple NOLs. These habitual speeders will require a stronger penalty in
order to change their dangerous driving behavior. The City of New York supports
implementing an escalating ne regime to address this population.
Following the passage of Local Law 36 of 2020, NYC DOT has been authorized to
create a Dangerous Vehicle Abatement Program. Under this law, registered owners of
vehicles that received 15 or more nally adjudicated speed camera NOLs or ve or
more nally adjudicated red light camera NOLs within a twelve-month period may be
required to take a safe driving class or else risk having their vehicles impounded by the
New York City Sheriff. These classes began in Fall 2021.

19
Repeat Violators, 2014 – 2021
Repeat Violators, 2021 Only
1
1,048,073
377,763
181,139
99,097
59,874
37,748
25,365 44,046
2 3 4 5 6 7
1,200,000
1,000,000
800,000
600,000
400,000
200,000
0
55%
20%
10%
5%
3%
2%
10+
2%
1%
8
1%
9
1%
17,657
12,599
Number of Violations by the Captured Plate
Source: NYC DOT
REPEAT VIOLATORS, 2021 ONLY
1
2,324,947
944,484
527,0 5 4
332,091
224,571
159,665
116,4 9 0
302,564
2 3 4 5 6 7 8 9 10+
2,500,000
2,000,000
1,500,000
1,000,000
500,000
0
46%
19%
10%
7%
4%
3%
2%
87,78 8
2%
66,720
1%
6%
Number of Violations by the Captured Plate
REPEAT VIOLATORS, 2014–2021

20
Adjudication of Speed Camera Violations
All individuals receiving a Notice of Liability are entitled to request a hearing by mail or
in person to contest a violation believed to have been issued in error. The notice itself
provides instructions as to how to request a hearing. From 2014-2021, 2.4 percent of
NOLs led to requests for a hearing, and the other 97.6 percent were issued to individuals
who declined the opportunity and accepted the violation after the NOL was issued.
Pursuant to Section 1180-b of the New York State Vehicle and Trafc Law and through
its Parking Violations Bureau, the New York City Department of Finance (NYC DOF) is
authorized to conduct hearings, either by mail or in person, in any of its ve Borough
Business Centers. When and if an Administrative Law Judge (ALJ) determines the NOL
presents a prima facie case, the ALJ will conduct a hearing on the merits of any defense
presented. The ALJ reviews witness statements as well as other types of documentary
evidence to afford the recipient of the NOL the opportunity to refute the prima facie case
and establish a meritorious defense. An ALJ is permitted to consider hearsay evidence,
and other evidence which may not be admissible in a traditional court of law, in order to
provide the individual with an opportunity to refute the NOL.
At hearing, 93.5 percent of contested NOLs have been upheld throughout the lifetime of
this program. In other words, considering how few NOLs are contested in the rst place,
this means only about 0.15 percent of total speed camera violations issued between
2014 and 2021 were overturned by an ALJ.
Total
Percent of
Total Violations Issued
Speed Camera NOL Issued,
2014–2021
16,284,272 100%
Hearings Requested,
2014–2021
389,134 2.4%
Outcome of NOL Hearings Total
Percent of
Challenged NOLs
NOL Upheld at Hearing 363,984 93.5%
NOL Overturned at Hearing 25,150 6.5%
Source: New York City Department of Finance
Adjudication Results

21
Revenue and Expenses
In total, from January 2014 through June 2025, the City of New York has spent or has
committed to spend almost $3.9 billion in capital and expense funds in furtherance of
Vision Zero.
In calendar year 2021, the City of New York collected approximately $243,887,524 in
nes from 4,216,478 speed camera notices of liability. This includes violations from
previous years that were paid in 2021, and does not include those violations issued in
2021 that were not paid by the end of the year.
Unlike some other cities with automated speed enforcement programs, New York City
does not have, and has never had, a contractor take any proportion of revenue from
violations. NYC DOT believes such systems create perverse incentives to issue greater
number of violations rather than focusing on the behavioral changes to make driving
safer, and thus do not align with the ethics of Vision Zero.
As required by State law, all net revenues from the speed camera program are directed
to the General Fund.
Speed Camera Program Summary
(Fiscal Year 2014–2021)
Operating Costs
$38,055,176
Capital Costs
$94,588,548
Total Costs
$327,210,525
Speed Camera Revenue
$555,014,321
Net Revenue
$227,803,79 6
Vision Zero Program Summary,
City of New York*
(Fiscal Year 2014–2021)
Expense Costs
$598,110,000
Capital Costs
$1,266,326,000
Total Costs
$1,864,436,000

22
All School Speed Zones*
School Speed Zones
with Cameras Installed
Prior to 2020
Injuries 36,388 19,083
Fatalities 175 94
Injury Crashes 27,513 14,250
Property Damage
Crashes
32,417 16,510
Pedestrian Injuries 6,603 3,320
Bicycle Injuries 3,878 1,777
MV Occupant Injuries 25,907 13,986
Severity A Injuries 2,688 1,374
Severity B Injuries 4,520 2,250
Severity C Injuries 28,636 15,187
* Defined as one quarter-mile from a school building
Class A severe injuries include skull fractures, internal injuries, broken or distorted limbs, unconsciousness when taken
from the crash scene, severe lacerations, and inability to leave the scene without assistance.
Class B moderate injuries include visible injuries such as a lump on the head, abrasions, and minor lacerations.
Class C slight injuries include complaints of pain without visible signs injury, momentary loss of consciousness, limping,
and nausea.
Appendix
Number, Type, and Severity of Crashes, Fatalities, Injuries, and
Property Damages in 2020
