
NTP ReseaRch RePoRT oN The
TReNd TesT foR BiNaRy daTa
wiTh suRvivaBiliTy aNd
clusTeRiNg adjusTmeNTs
NTP RR 19
NOVEMBER 2023
NTP Research Report on the
Trend Test for Binary Data with Survivability and
Clustering Adjustments
Research Report 19
November 2023
National Toxicology Program
Public Health Service
U.S. Department of Health and Human Services
ISSN: 2473-4756
Research Triangle Park, North Carolina, USA

Trend Test for Binary Data with Survivability and Clustering Adjustments
ii
Foreword
The National Toxicology Program (NTP), established in 1978, is an interagency program within
the Public Health Service of the U.S. Department of Health and Human Services. Its activities
are executed through a partnership of the National Institute for Occupational Safety and Health
(part of the Centers for Disease Control and Prevention), the Food and Drug Administration
(primarily at the National Center for Toxicological Research), and the National Institute of
Environmental Health Sciences (part of the National Institutes of Health), where the program is
administratively located. NTP offers a unique venue for the testing, research, and analysis of
agents of concern to identify toxic and biological effects, provide information that strengthens
the science base, and inform decisions by health regulatory and research agencies to safeguard
public health. NTP also works to develop and apply new and improved methods and approaches
that advance toxicology and better assess health effects from environmental exposures.
NTP reports the findings from many of its studies in the NTP Technical Report and Monograph
series. NTP uses the Research Report series, which began in 2016, to report on work that does
not fit readily into one of those two series, such as pilot studies, assay development or
optimization studies, literature surveys or scoping reviews, and handbooks on NTP procedures or
study specifications.
NTP Research Reports are available free of charge on the NTP website and cataloged in
PubMed, a free resource developed and maintained by the National Library of Medicine (part of
the National Institutes of Health). Data for these evaluations are included in NTP’s Chemical
Effects in Biological Systems database or the Health Assessment and Workspace Collaborative.
For questions about the reports and studies, please email NTP or call 984-287-3211.
Trend Test for Binary Data with Survivability and Clustering Adjustments
iii
Table of Contents
Foreword ......................................................................................................................................... ii
Tables ............................................................................................................................................. iii
Figures............................................................................................................................................ iii
About This Report.......................................................................................................................... iv
Peer Review ................................................................................................................................... vi
Publication Details ........................................................................................................................ vii
Acknowledgments......................................................................................................................... vii
Abstract ........................................................................................................................................ viii
Introduction ......................................................................................................................................1
Methods............................................................................................................................................3
Summary of the Poly-3 Method ..................................................................................................3
With Clustering Added ...............................................................................................................4
Simulations ..................................................................................................................................5
Application to Real Data .............................................................................................................7
Results ..............................................................................................................................................8
Simulated Data ............................................................................................................................8
Real Data ...................................................................................................................................11
Discussion ......................................................................................................................................14
References ......................................................................................................................................17
Appendix A. Supplementary Tables ........................................................................................... A-1
Appendix B. Approach for Simulations .......................................................................................B-1
Tables
Table 1. Parameter Values for Tumor Onset and Mortality Models (Equations [5] and [6] in the
Text) by Tumor Type .........................................................................................................6
Table 2. Trend Analysis on Nonneoplastic Lesion Incidence from NTP Study on 2-Hydroxy-4-
methoxybenzophenone Using Poly-3 and clusterPoly-3 Tests .......................................11
Figures
Figure 1. Background Tumor Onset Densities Corresponding to the Tumor Types Used in the
Simulations .......................................................................................................................6
Figure 2. Type I Error Results .........................................................................................................9
Figure 3. Power Results .................................................................................................................10
Figure 4. Impact of Litter Correlation on Differences in Poly-3 Test Results ..............................13
Trend Test for Binary Data with Survivability and Clustering Adjustments
iv
About This Report
National Toxicology Program
1
1
Division of Translational Toxicology, National Institute of Environmental Health Sciences,
Research Triangle Park, North Carolina, USA
Collaborators
M.V. Smith, S.F. Harris, K.R. Shockley, H.C. Cunny, S.J. McBride
Social & Scientific Systems, a DLH Company, Research Triangle Park, North Carolina,
USA
Contributed to development of the clusterPoly-3 method and drafted report
S.J. McBride, Ph.D., Principal Investigator
S.F. Harris, M.S.
M.V. Smith, Ph.D.
Biostatistics and Computational Biology Branch, Division of Intramural Research,
National Institute of Environmental Health Sciences, Research Triangle Park, North
Carolina, USA
Contributed to development of the clusterPoly-3 method, drafted report, and provided contract
oversight
K.R. Shockley, Ph.D.
Office of Program Operations, Division of Translational Toxicology, National Institute of
Environmental Health Sciences, Research Triangle Park, North Carolina, USA
Provided contract oversight and drafted report
H.C. Cunny, Ph.D.
Contributors
Division of Translational Toxicology, National Institute of Environmental Health Sciences,
Research Triangle Park, North Carolina, USA
Provided oversight of external peer review
M.L. Brownlow, Ph.D.
M.S. Wolfe, Ph.D.
Provided oversight of reporting activities
G.K. Roberts, Ph.D.
K.A. Shipkowski, Ph.D.
Kelly Government Solutions, Research Triangle Park, North Carolina, USA
Supported external peer review
E.A. Maull, Ph.D.
Trend Test for Binary Data with Survivability and Clustering Adjustments
v
ICF, Reston, Virginia, USA
Provided contract oversight
D. Burch, M.E.M.
J.A. Wignall, M.S.P.H.
Edited and formatted report
T. Hamilton, M.S.
K.T. O’Donovan, B.A.
P. Shirzadi, M.P.H.
Supported external peer review
L.M. Green, M.P.H.
P. Shirzadi, M.P.H.
Trend Test for Binary Data with Survivability and Clustering Adjustments
vi
Peer Review
The National Toxicology Program (NTP) conducted a peer review of the draft NTP Research
Report on the Trend Test for Binary Data with Survivability and Clustering Adjustments by letter
in January and February 2023 by the experts listed below. Reviewer selection and document
review followed established NTP practices. The reviewers were charged to:
(1) Review the draft NTP Research Report on the Trend Test for Binary Data with
Survivability and Clustering Adjustments.
(2) Comment on whether the draft document is clearly stated and objectively presented.
NTP carefully considered reviewer comments in finalizing this report.
Peer Reviewers
A. John Bailer, Ph.D.
Professor Emeritus of Statistics
Miami University
Oxford, Ohio, USA
David B. Dunson, Ph.D.
Arts and Sciences Distinguished Professor of Statistical Science
Duke University
Durham, North Carolina, USA
Chris Gennings, Ph.D.
Research Professor of Biostatistics
Icahn School of Medicine at Mount Sinai
New York, New York, USA

Trend Test for Binary Data with Survivability and Clustering Adjustments
vii
Publication Details
Publisher: National Toxicology Program
Publishing Location: Research Triangle Park, NC
ISSN: 2473-4756
DOI: https://doi.org/10.22427/NTP-RR-19
Report Series: NTP Research Report Series
Report Series Number: 19
Official citation: National Toxicology Program (NTP). 2023. NTP research report on the trend
test for binary data with survivability and clustering adjustments. Research Triangle Park, NC:
National Toxicology Program. Research Report 19.
Acknowledgments
This work was supported by the Intramural Research Program at the National Institute of
Environmental Health Sciences, National Institutes of Health and performed for the National
Toxicology Program, Public Health Service, U.S. Department of Health and Human Services
under contracts HHSN271201800012I, HHSN273201600011C, GS00F173CA-
75N96021F00109, and GS00Q14OADU417 (Order No. HHSN273201600015U).
Trend Test for Binary Data with Survivability and Clustering Adjustments
viii
Abstract
This report introduces a trend test for binary data that accommodates both treatment-affected
survivability and clustering within treatment groups. The test is motivated by chronic rodent
carcinogenicity assays that begin exposure in utero and continue exposing postweaning siblings
at the same dose level as their dams. The new test modifies the Poly-3 trend test introduced by
Bailer and Portier
1
to include clustering by adjusting the variance estimate of the lifetime
incidence rate of findings. The weighted least squares linear regression approach to the Cochran-
Armitage test with weights equal to the inverse of the variance is used to determine the initial
statistic. Since sparse findings are common in low-dose groups and may be present in higher
dose groups, the variance estimate is pooled across dose groups following Bieler and Williams
2
to increase robustness. The new method was first evaluated with simulated data using
distributional models for tumor onset and mortality
1
with sibling correlation added through
copulas. The simulations show that in the absence of positive sibling correlation, the false
positive rate and power are similar for the Poly-3 test and the Poly-3 test modified for sibling
correlation. However, with positive sibling correlation, the false positive rate is lower using the
modified Poly-3 test than with the Poly-3 test. The two methods are also compared using real
data from a National Toxicology Program perinatal chronic study, and the results reinforce the
conclusion that failing to account for sibling correlation sometimes leads to inflated statistical
significance.
Keywords: Littermates, siblings, rat, chronic toxicology testing, developmental carcinogenicity,
statistical analysis of tumor counts, Poly-3 test, cluster analysis, Rao-Scott
Trend Test for Binary Data with Survivability and Clustering Adjustments
1
Introduction
The long-term or chronic rodent carcinogenicity study focuses on binary responses indicating the
presence of findings such as tumors or nonneoplastic lesions after approximately 2 years of
exposure. Without the presence of siblings (littermates), trend analysis is conducted using the
Poly-3 scoring method,
1; 2
which was developed to account for possible treatment toxicity that
may affect survivability over the course of the study.
A more recent extension of this rodent protocol used by the National Toxicology Program (NTP)
includes early dosing of pups through the dam both in utero and during lactation before
continuing with direct exposure after weaning. With multiple pups per litter available in
developmental studies with an in utero component, siblings are available to be included in long-
term rodent studies.
3
Protocols for these “developmental carcinogenicity” or “perinatal chronic” studies have called
for two or three siblings/sex/dose group. Note that the data are always analyzed separately by
sex. In general, clusters are formed when members of the same cluster are more similar than
members of different clusters. For the application discussed in this report, clusters are formed by
littermates, since sibling responses may be more similar than those of nonsiblings due to shared
genetics, maternal care, or other factors.
4
The Poly-3 trend test was not designed to take into
account clustered observations, and so may lead to Type I error inflation and unreliable analysis
results.
The specific goal was to extend the Poly-3 test to clustered data with clusters nested within dose
groups. With this focus, NIEHS staff looked for an approach that allows accounting for
clustering most easily in the above context. As discussed in detail in the Methods section, the
Poly-3 test consists of a scoring method that adjusts sample sizes for early mortality; the adjusted
sample sizes are generally noninteger. Approaches that use distribution models for clustering that
are based on the binomial distribution,
5; 6
as well as exact solutions,
7
are therefore problematic.
In addition, there was concern regarding convergence issues for generalized mixed models
(GLMMs). Without survival issues, the statistic introduced in this report reduces to the statistic
described and used in Harris et al.
8
and denoted as the Rao-Scott Cochran-Armitage method
(mRSCA). Simulations are used to compare the mRSCA statistic to a variety of other
approaches, including GLMMs (logistic regression). While Type I error rates and power were
very similar for these two approaches, the logistic regression had convergence issues in up to
26% of simulations for background incidence rates of around 20%.
Examples of studies using the “developmental carcinogenicity” protocol include those for SAN-
Trimer (TR-573),
9
DE-71 (TR-589),
10
and 2-hydroxy-4-methoxybenzophenone (2H4MBP; TR-
597).
11
Incidence data on 25 nonneoplastic lesions (13 male and 12 female) from the 2H4MBP
study
11
are analyzed in this report. After weaning, pups continue to be exposed at the same
concentration as their dam for 2 more years. The presence of various specific tumors and
nonneoplastic lesions is recorded at death or at study termination. In the 2H4MBP study, each
dose group includes two pups per sex from each of 25 litters per dose group, if available; animals
without siblings are used if there are not enough sibling pairs.
Trend Test for Binary Data with Survivability and Clustering Adjustments
2
In the Methods section, the clusterPoly-3 trend test is presented. The Type I error control and
power of clusterPoly-3 are illustrated and compared with Poly-3 results using simulated data that
are based on distributions for tumor onset and mortality found by Portier et al.
12
and used by
previous authors (Bailer et al.
1
and Bieler et al.
2
). The added clustering is modeled by using
copulas as described in detail in Appendix B. Finally, the method is applied to real data from a
2020 NTP chronic perinatal rat study.
11
The report closes with a discussion.

Trend Test for Binary Data with Survivability and Clustering Adjustments
3
Methods
Summary of the Poly-3 Method
The Poly-3 is a trend statistic for binary data that accounts for early mortality without the
presence of findings such as tumors. It is motivated by long-term exposure rodent bioassays, in
which over the duration of the experiment each animal may develop a finding of interest (e.g.,
tumor, nonneoplastic lesion) in the presence of treatment-induced mortality.
1
If there are i = 1,
…, I dose groups,
denotes the initial size of the i
th
dose group, and
the final number of
animals with the finding. The question for the analysis is whether the proportion of animals for
each dose group with such findings
increases with dose. The linear model,
(
)
=
+
, can be used, where
refers to the i
th
dose. Following Bieler and Williams,
2
the
generalized Wald statistic for the test H
0
: β
1
= 0 versus H
A
: β
1
> 0 can be written as
[1]
where
Then, for large samples under the null hypothesis,
is approximately distributed as a standard
Gaussian distribution.
Without mortality or clustering,
is binomially distributed and, under the null hypothesis,
(
)
may be written as (1 )/
, where =
is the findings rate. Note that although p
itself is pooled, the variance estimates may still differ by dose group due to
in the
denominator. When the inverses of these variances are used as weights, the statistic in
equation [1] becomes the standard Cochran-Armitage test.
If an animal dies early before developing the finding, less information is available and a
mortality adjustment must be made. The Poly-3 method
1
takes such early deaths into account by
giving each animal in the sample a score . For animals that survive to study termination or die
early with the finding, the score is one, i.e., = 1. If T is the duration of the exposure in the
assay, and the animal dies at t < T without the finding, with the lower score
reflecting the uncertainty of whether the animal might have developed the finding if it had lived
longer. The effective sample size is found by summing the alpha scores for the animals in the
sample.
Bieler and Williams
2
noted that if early mortality without findings is possible, then the sum of
the scores is a random variable, so that the binomial distribution for the number of animals
with findings no longer applies. If the sum of the alpha scores over each dose group is denoted as
to distinguish it from the initial dose group size
, these authors derived an improved
variance estimate for
=
using the Taylor expansion. Their improved Poly-3 trend statistic
uses the inverses of pooled approximations to their variance estimates as the weights in
equation [1].

Trend Test for Binary Data with Survivability and Clustering Adjustments
4
With Clustering Added
In this report, variance estimates were found for the findings rates in each dose group,
accounting for clustering as well as treatment lethality. The inverses of these variance estimates
were used as weights in a weighted least squares approach.
2
Cochran
13
derived a variance estimate for ratios of random variables defined on clusters. The
following additional notation is needed. Let i = 1, …, I denote dose group, each with
litters.
The j
th
litter in the i
th
dose group starts the experiment with
animals, for j = 1, …,
.
was
used to denote the number of animals in the j
th
litter of the i
th
dose group with the findings, and
was used to denote the corresponding sum of alpha values.
Cochran’s formula (Section 2.11, Cochran
13
) for the variance is applied to the ratio
and
shown in equation [2] for the i
th
dose group.
[2]
where, as before,
=
.
Note that in the special case that there is no mortality (all scores are ‘one’),
=
and
=
=
, so that the variance estimate in [2] reduces to variance estimate used by Rao
and Scott
14
as the numerator of their design effect. Similarly, in the special case without
clustering and with only one pup in each litter,
=
,
reduces to a 0/1 variable indicating
the presence of a finding, and
reduces to
, the score for the only animal in the j
th
litter.
With those interpretations, the variance estimate in [2] reduces to variance estimate in equation
(6) in Bieler and Williams.
2
In the case of sparse data, the
values may be zero for some dose groups, so that the variance
estimate in [2] is not always stable. To increase stability, the findings rate is pooled across dose
groups. Following a similar argument in Bieler and Williams,
2
equation [2] is first rewritten as
equation [3].
[3]
Note that since

Trend Test for Binary Data with Survivability and Clustering Adjustments
5
the quantity in the square brackets in equation [3] is zero. Under the null hypothesis, all dose
groups have the same findings rate so that the pooled findings rate,
=
, may be
substituted for
.
With that substitution, the second factor in [3] becomes the variance for the quantity,
,
which, again under the null hypothesis, has a constant value. The best estimate for this constant
is found by pooling across dose groups, resulting in the following estimate.
[4]
where I is the number of dose groups and
=
is the total number of litters. Equation
[4] is written with a pooled findings rate but adjusted to the i
th
dose group; the estimates will
vary between dose groups according to values for
and
.
To write the final statistic,
is defined as 1/
,
(
)
and used with equation [1]. For large
numbers of litters, the resulting statistic can be used with the standard normal distribution. The
corresponding test will be denoted by clusterPoly-3.
Simulations
Portier et al.
12
used historical control data from NTP studies for Fischer 344 rats and B6C3F1
(C57BL/6 × C3H F1) mice to fit Weibull distributions to background tumor onset times for a
large variety of specific tumor types. Although the B6C3F1 mice are still used in NTP studies,
Harlan Sprague Dawley rats are used instead of Fischer 344 rats. However, continuing to use
these parameter estimates
12
allows a direct comparison to the simulation results in Bailer and
Portier
1
as well as Bieler and Williams.
2
Modified Weibull distributions were estimated for
background mortality times for both species and sexes, with cumulative distribution functions
(CDFs) given in [5] and [6].
[5]
[6]
In both equations
refers to the four dose levels (0, 0.25, 0.50, and 1.0); the parameters (μ
1
, μ
2
,
θ
1
,θ
2
, θ
3
) all have estimates in Portier et al.
12
The null case with only background rates for
mortality as well as tumor onset corresponds to zero values for the parameters
and
.
1
To
investigate power, Bailer and Portier
1
set
to 1, modeling a treatment effect that increases
tumor onset linearly with dose and approximately doubles the background rate for the highest
dose level. Parameter values of {1, 4} were used for
to increase levels of treatment-related
lethality. Details regarding the setup of simulations are given in Appendix B.
For their simulations, Bailer and Portier
1
chose the parameter sets corresponding to three specific
tumor types with background rates from 1.2% to 19.1% (see Table 1). Bieler and Williams
2
chose the same parameter estimates to simulate data illustrating their statistic, only adding a
stronger level of treatment-related mortality (
= 7). These same distributions and parameter
estimates are again used in this report but with copulas used to add two levels of correlation

Trend Test for Binary Data with Survivability and Clustering Adjustments
6
(Spearman values of 0.24 and 0.48) between tumor onset times for siblings (e.g., Nelson,
15
Genest and Mackay
16
). Additionally, simulations were generated with the parameter estimates
corresponding to a fourth tumor type, female rat pancreatic islet tumors with a similar
background tumor rate to female rat lung tumors, but with a very different distribution for onset
times (Table 1; Figure 1). Note that all but the liver tumor survival parameters were taken from
female rat exposures; the male survival rate is slightly lower than the female survival rate over
the duration of the exposure.
Table 1. Parameter Values for Tumor Onset and Mortality Models (Equations [5] and [6] in the
Text) by Tumor Type
Sex Tumor Type
Background
Rate
μ
0
μ
1
μ
2
θ
0
θ
1
θ
2
θ
3
Female
Leukemia/
lymphoma
High (19.1%)
{0,1}
0.244
2.70
{0, 1, 4, 7}
1.237e-4
2.479e-16
7.384
Male
Liver
Medium (4.6%)
{0,1}
0.063
5.49
{0, 1, 4, 7}
1.238e-4
9.016e-17
7.667
Female
Lung
Low (1.2%)
{0,1}
0.013
0.75
{0, 1, 4, 7}
1.237e-4
2.479e-16
7.384
Female
Pancreatic islet
Low (1.0%)
{0,1}
0.017
9.24
{0, 1, 4, 7}
1.237e-4
2.479e-16
7.384
Figure 1. Background Tumor Onset Densities Corresponding to the Tumor Types Used in the
Simulations
The area under the curves corresponds to the probability of a tumor for each type over the duration of the study.
Leukemia/lymphoma tumors (solid line) have high prevalence of 19%; liver (dotted line) and pancreatic islet (long-dashed line)
tumors have lower prevalence values of ~5% and 1%, respectively. The lung (short-dashed line) tumor density differs
qualitatively from the others with the highest prevalence at birth, declining steeply as the animals get older with low prevalence
of 1.2%.

Trend Test for Binary Data with Survivability and Clustering Adjustments
7
For each scenario, an excess of data sets was simulated using the above procedure to ensure
having 5,000 data sets with at least one finding among all dose groups. All data sets followed the
protocol for a single sex used in NTP Technical Report 597 (2-hydroxy-4-
methoxybenzophenone)
11
with four dose groups of 50 animals (25 litters of 2 pups) each. The
data sets were tested for significant trend at the 0.05 testing level according to two testing
strategies: the Poly-3 method that uses the survival adjustment with the corrected variance
2
but
has no provision for litters and the modified method (clusterPoly-3) that accounts for clustering.
With 5,000 data sets, 95% confidence intervals for the observed percentage of null hypothesis
rejections are [4.4%, 5.6%]. In future applications of either method, multiple comparison
methods may be used depending on the number of tests required by the protocol.
Although the analysis method presented above does not include an explicit effective sample size
estimate as part of the derivation, equation [7] below (e.g., Killip
17
and Golub
4
) was used to
estimate final effective dose group sizes for the high-dose groups. The effective dose group sizes
accounting for both mortality and clustering were compared with the effective dose group sizes
adjusted for mortality only.
=
1 + (1)
[7]
Here
denotes the Poly-3 adjusted sample size ignoring clustering, c is the within cluster
correlation, and s is the average cluster (or litter) size after the Poly-3 adjustment. The n
eff
then
estimates the effective dose group size when both mortality and clustering are accounted for.
Additionally, the above simulation method was used to generate further data sets with the highest
sibling correlation (0.48) and the highest lethality level (4) used in the original Bailer and
Portier
1
paper. These additional simulations correspond to dose groups of 30 litters with three
siblings and dose groups of 10 litters with five siblings. Type I error rates and power were
calculated using both Poly-3 and clusterPoly-3 methods.
Application to Real Data
Both methods described above were also applied to incidence data taken from a recent perinatal
chronic study run for the National Toxicology Program.
11
Both the Poly-3 and clusterPoly-3
trend tests were performed for 25 nonneoplastic lesions (13 male and 12 female). For each
endpoint, sibling correlation was estimated using the Fleiss-Cuzick formula.
18
Trend Test for Binary Data with Survivability and Clustering Adjustments
8
Results
Simulated Data
As described in the Methods section, data were simulated using tumor onset patterns
corresponding to four different tumor types having high, medium, and low tumor rates. Two
tumor onset patterns were included for low tumor rates: very early onset times (female rat lung
tumors) and later onset times (female rat pancreatic islet tumors) (Figure 1). Four levels of
treatment lethality corresponding to the four levels of the theta0 parameter in equation [6] were
considered, ranging from zero (which only includes background mortality) to high levels of
treatment-induced lethality as observed in various studies (Bieler and Williams
2
). Additionally,
two positive levels of sibling correlation were considered, low (24%) and high (48%), as well as
zero correlation between siblings.
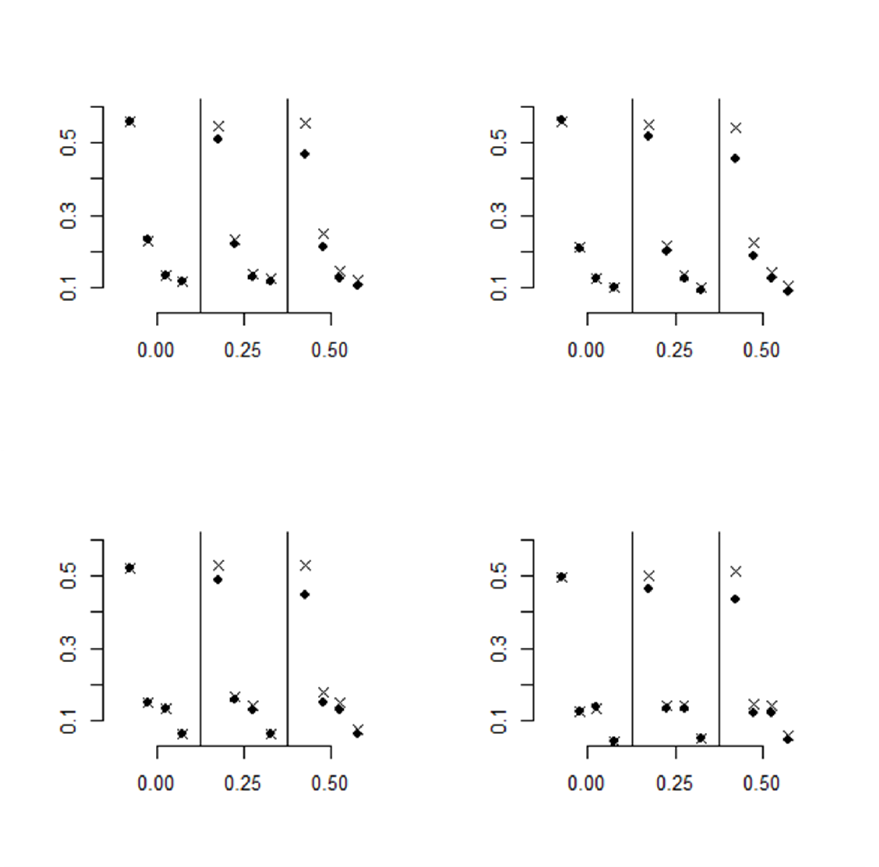
Figure 2 and Figure 3 plot the percentages of significant outcomes (at the 0.05 level) for both
trend tests, Poly-3 (shown as “x”), and clusterPoly-3 (shown as “•”). The numeric values of the
percentages of significant outcomes shown in the figures are given in Table A-1, Table A-2,
Table A-3, and Table A-4 in Appendix A. Both figures are organized in four panels
corresponding to the level of treatment lethality. Each panel includes all three sibling correlation
levels for all four tumor types. The tumor types are arranged from left to right in decreasing
order of background rate. Thus, for each correlation value, the results are shown for:
leukemia/lymphoma, liver, lung, and pancreatic islet tumors.
Figure 2 compares Type I error inflation for the two methods (Poly-3 and clusterPoly-3). The
95% confidence bounds for the nominal Type I error rate of α = 0.05 are included for reference.
The two methods give similar results when correlations are zero as correlations increase the
markers corresponding to the two methods move farther apart. The Poly-3 results show
consistent Type I error inflation (above the 5.6% mark) for the highest incidence tumor
(leukemia/lymphoma with 19.1% background rate), while the lowest incidence tumor (pancreatic
islet tumors with 1% background rate) shows no Type I error inflation. The liver tumors (4.6%
background rate) show Type I error inflation for low lethality rates (0 and 1) but not the higher
rates (4 and 7). The lung tumors (1.2% with early onset of tumors) show consistent but low
inflation for the highest correlation level only. The clusterPoly-3 method has only one instance
of inflated Type I error for the liver tumor at zero treatment-related lethality and correlation
value of 0.24.

Trend Test for Binary Data with Survivability and Clustering Adjustments
9
Figure 2. Type I Error Results
These results correspond to simulations without treatment effect on tumorigenesis (µ
0
= 0 in equation [5]). The proportions of
p values ≤ 0.05 are shown for four levels of treatment-related lethality (θ
0
= 0, 1, 4, 7 in equation [6]) and three levels of sibling
correlation. In each of the 12 panels, the four tumor types are in order of decreasing background rate: leukemia/lymphoma (19%),
liver (4.6%), lung (1.2%), and pancreatic islet (1%). The crosses (x) denote analysis without accounting for clustering (Poly-3);
solid dots (•) show analysis accounting for clustering (clusterPoly-3). Horizontal dashed lines indicate upper and lower bounds of
the 95% confidence interval around alpha = 0.05 (0.044, 0.056).
Figure 3 compares power for the two methods when the rate of tumor onset increases linearly
with dose and is roughly doubled for the highest dose group [Equation 5]. As in Figure 2, when
sibling correlation is zero, the two methods give consistent results. In all cases, the largest power
drops for both methods occur between high and low background tumor rates. ClusterPoly-3
shows a lower rate of significance as sibling correlations increase. Power also goes down
somewhat with decreasing survival due to treatment, especially for the pancreatic islet tumors.
Treatment-related Lethality Is 0
Treatment-related Lethality Is 1
Treatment-related Lethality Is 4 Treatment-related Lethality Is 7
Proportion of Significant P Values
Proportion of Significant P Values
Sibling Correlation
Sibling Correlation
Sibling Correlation
Sibling Correlation
Trend Test for Binary Data with Survivability and Clustering Adjustments
10
Figure 3. Power Results
These results compare power between Poly-3 and clusterPoly-3 methods corresponding to simulations with treatment effect on
tumorigenesis (µ
0
= 1) in equation [5]. The proportions of p values ≤ 0.05 are shown for four levels of treatment-related lethality
(θ
0
= 0, 1, 4, 7 in equation [6]) and three levels of sibling correlation. In each of the 12 panels, the four tumor types are in order of
decreasing background rate: leukemia/lymphoma (19%), liver (4.6%), lung (1.2%), and pancreatic islet (1%). The crosses (x)
denote analysis without accounting for clustering (Poly-3); solid dots (•) show analysis accounting for clustering (clusterPoly-3).
The treatment effect simulated here corresponds to a tumor onset rate increasing linearly to double the background rate in the
highest dose group.
In Table A-5, simulation results that are presented in the text for sibling correlation of 0.48 and
lethality level 4 are compared with two additional protocols differing only in litter and dose
group size. Additional results for dose groups of 30 litters with three pups and dose groups of 10
litters with five pups show that Type I error rates for the Poly-3 adjustment go up roughly with
the number of siblings used per litter, with a high of 12.86% for five-pup litters, and that these
errors are corrected by the clusterPoly-3 adjustment. The protocol with dose groups of 30 litters
of three-sibling litters has the highest power.
Proportion of Significant P ValuesProportion of Significant P Values
Sibling Correlation Sibling Correlation
Sibling Correlation Sibling Correlation
Treatment-related Lethality Is 7
Treatment-related Lethality Is 4
Treatment-related Lethality Is 0
Treatment-related Lethality Is 1

Trend Test for Binary Data with Survivability and Clustering Adjustments
11
Table A-6 compares the effective sample sizes calculated using only the Poly-3 adjustment with
those also accounting for clustering for dose groups of 25 litters of two siblings or 50 animals.
The effective sample sizes using only the Poly-3 adjustment decrease consistently with
increasing levels of treatment-induced lethality with the strongest effect for liver tumors in male
rats. Comparing effective sample sizes for the high tumor rate (19.1% for leukemia/lymphoma in
female rats) with the low tumor rate (1.0% for pancreatic islets also in female rats), the sample
sizes of the sparser tumors are reduced more strongly by increasing the lethality rates, while
further reduction in effective sample sizes due to clustering is stronger for the higher tumor rate.
Real Data
Both Poly-3 and clusterPoly-3 methods were applied to observed data for a total of 25
nonneoplastic lesion types (both male and female) from an NTP perinatal chronic study
(Table 2).
11
Table 2. Trend Analysis on Nonneoplastic Lesion Incidence from NTP Study on 2-Hydroxy-4-
methoxybenzophenone
11
Using Poly-3 and clusterPoly-3 Tests
Nonneoplastic
Lesion
Sex
Estimated
Correlation
a
Singleton
Litters
b
P Values
Poly-3
c
clusterPoly-3
d
Rao-Scott Poly-3
with ccf
e
Adrenal Cortex:
Hyperplasia, Focal
M
−0.1453
14
0.276
0.270
0.323
Adrenal Cortex:
Hypertrophy, Focal
M
0.0079
14
0.066
0.074
0.094
Adrenal Cortex:
Vacuolization
Cytoplasmic
M
0.0573
14
0.286
0.283
0.381
Blood Vessel: Aorta,
Mineralization
M
−0.0333
14
0.064
0.070
0.171
Kidney: Cyst
M
−0.0391
14
0.142
0.150
0.260
Kidney: Pelvis,
Dilation
M
−0.0109
14
0.009
0.009
0.137
Kidney: Pelvis,
Inflammation
M
−0.0391
14
0.109
0.111
0.214
Pancreas: Arteriole,
Inflammation,
Chronic
M
0.2063
14
0.191
0.247
0.290
Prostate:
Epithelium,
Hyperplasia
M
−0.0055
14
0.008
0.009
0.146
Spleen:
Pigmentation
M
−0.0112
14
0.114
0.121
0.152
Spleen: White Pulp,
Atrophy
M
0.2157
14
0.064
0.087
0.124
Testes: Arteriole,
Necrosis
M
0.2483
14
0.015
0.030
0.036
Testes: Germinal
Epithelium, Atrophy
M
0.3902
14
0.068
0.117
0.136

Trend Test for Binary Data with Survivability and Clustering Adjustments
12
Nonneoplastic
Lesion
Sex
Estimated
Correlation
a
Singleton
Litters
b
P Values
Poly-3
c
clusterPoly-3
d
Rao-Scott Poly-3
with ccf
e
Intestine Large:
Rectum Parasite
Metazoan
F
−0.0098
16
0.003
0.003
0.010
Liver: Hepatocyte,
Vacuolization
Cytoplasmic
F
−0.0279
16
0.027
0.030
0.091
Lung: Hemorrhage
F
0.4888
17
0.014
0.042
0.148
Ovary: Cyst
F
0.0862
16
0.025
0.029
0.056
Stomach:
Forestomach:
Epithelium,
Hyperplasia
F
−0.0166
16
0.030
0.031
0.145
Thymus: Atrophy
F
0.0418
17
0.067
0.074
0.106
Adrenal Cortex:
Hyperplasia, Focal
F
0.1199
16
0.164
0.185
0.230
Liver: Bile Duct,
Hyperplasia
F
−0.0110
16
0.204
0.203
0.429
Liver: Hepatocyte,
Necrosis
F
0.2159
16
0.206
0.234
0.324
Parathyroid Gland:
Hyperplasia
F
−0.0534
35
0.102
0.099
0.197
Pituitary Gland: Pars
Distalis, Hyperplasia
F
−0.1014
16
0.231
0.230
0.274
Spleen:
Pigmentation
F
0.0595
16
0.161
0.172
0.217
ccf = continuity correction factor; M = male; F = female.
a
Sibling correlation is estimated by Fleiss-Cuzick
18
across dose groups.
b
Refers to the total number of litters (out of 100) with just one pup.
c
These p values were calculated using the Poly-3 trend test.
d
These p values were calculated using the clusterPoly-3 test presented in the report.
e
These p values were calculated using the Rao-Scott test with Poly-3 adjustment and ccf.
Although the same animals were used for all endpoints within each sex, the different endpoints
differ in the number of missing measurements and estimated correlation. The “singleton litters”
column shows the total number of singleton litters across all four doses due to missing
measurements on siblings. The Fleiss-Cuzick
18
estimates of sibling correlation vary from
negative values to a high of 0.49 for lung hemorrhage in females. The last three columns contain
the estimated Poly-3 p values, clusterPoly-3 p values, and Rao-Scott Poly-3 p values with the
standard NTP continuity correction factor for comparison. In Figure 4, for each endpoint with a
positive correlation estimate, the Poly-3 p value is subtracted from the clusterPoly-3 p value and
the difference normed by the clusterPoly-3 p value. The percent change values are plotted
against the sibling correlation estimates and are seen to increase as the estimated correlation
increases, illustrating the effect of correlation on inflated significance. Comparing the Poly-3 and
clusterPoly-3 p values in Table 2, the largest increase (p = 0.014 to p = 0.042) is for the female
lung hemorrhage, which also has the highest estimated correlation (0.489). However, it is also
noteworthy that p values of the two methods are comparable for all lesion types with respect to
0.05 and 0.01 thresholds.

Trend Test for Binary Data with Survivability and Clustering Adjustments
13
Figure 4. Impact of Litter Correlation on Differences in Poly-3 Test Results
For each endpoint in Table 2 with positive correlation estimates, the difference between Poly-3 p values and clusterPoly-3
p values is divided by the clusterPoly-3 p value and plotted against the estimated sibling correlation. The correlation between
sibling correlation and the percent change values is 94.6% with a 95% confidence interval of [0.815, 0.985].
% Change in P Value (CP3 to Poly3)
Correlation Estimate between Siblings
Trend Test for Binary Data with Survivability and Clustering Adjustments
14
Discussion
Interest in the potential long-term effect of test articles administered during early development
led to the design of National Toxicology Program (NTP) perinatal chronic studies that begin
exposure of pups through the dams during gestation and lactation.
19
The protocol allows 25 or 30
dams per dose group such that the resulting litters will contribute two or three siblings per sex to
populate the chronic study, necessarily in the same dose group. The analysis of the binary
response data coming from these studies includes the challenges of the earlier chronic studies
(sparse findings in control groups and treatment-induced mortality) with the additional clustering
of littermates. Sibling correlations estimated from the NTP incidence data on 25 different
nonneoplastic lesions
11
ranged from negligible to 0.49 (Table 2). In this report, a novel trend
statistic (the clusterPoly-3) is presented as a method for analyzing trend in findings across dose
groups in the presence of treatment lethality, sparse data, and clustering nested within dose
groups. The clusterPoly-3 statistic was compared to the related Poly-3 trend statistic using both
simulated tumor data and observed data on nonneoplastic lesions from a recent NTP chronic
perinatal rat study.
11
The simulated data follow the chronic perinatal protocol, with 50 animals
(25 litters contributing two same-sex siblings/litter) per dose group at the start of the experiment.
Data from earlier NTP chronic studies incorporated dosing of vendor-supplied rats and mice
from 6 weeks old and were analyzed using the Poly-3 scoring method developed by Bailer and
Portier.
1
In their modification of the Poly-3 test, Bieler and Williams
2
incorporated improved
variance estimates of the findings rate as the inverse weights in a generalized Wald statistic. The
approach of Bieler and Williams
2
was combined with a variance estimate taken from survey
sampling that accounts for clusters that are wholly within treatment groups (not distributed
across groups).
13
This same variance estimate accounting for clustering (but not mortality) is
used by Rao and Scott.
14
The variance estimate then reduces to the Rao-Scott estimate when
mortality is zero. Allowing for mortality but with only a single pup in each litter, the variance
estimate reduces to the corrected variance estimate for the Poly-3 test.
2
Following Bieler and
Williams,
2
a pooled approximation to the variance estimate was derived to improve robustness to
sparse findings. The inverse of this variance estimate was used as a weight to modify the
Cochran-Armitage trend test. This approach does not assume a specific correlation model
between sibling responses. The new test is referred to as the clusterPoly-3 test. In this report, the
clusterPoly-3 statistic is compared to the related Poly-3 trend statistic using both simulated tumor
data and observed data on nonneoplastic lesions from a recent NTP chronic perinatal rat study.
11
The simulated data were based on the chronic perinatal protocol with treatment groups consisting
of 50 animals (25 litters with two same-sex siblings).
Sibling correlations estimated for observed nonneoplastic lesion incidence also included very
low and even negative values, showing that the presence of siblings in dose groups does not
always lead to high positive correlations (Table 2). For that reason, it is important to know
whether clusterPoly-3 gives results comparable to the Poly-3 method when sibling correlation is
very low. Figure 2 and Figure 3 (and Table A-1 and Table A-3) show that in simulated data, the
operating characteristics are very similar between the methods when the correlation used to
generate the data is zero. The results are also consistent with previously published power
estimates (e.g., Bailer and Portier
1
and Bieler and Williams
2
). This similarity suggests that the
clusterPoly-3 method can be used anytime sibling clusters are present in the data, without
needing to check that the correlation is significantly positive.

15
Trend Test for Binary Data with Survivability and Clustering Adjustments
Simulated data sets were also generated with two positive levels of sibling correlation: 0.24 and
0.48, the highest level comparable to the highest observed correlation in Table 2. Since
clustering decreases the effective sample size,
4; 14
ignoring clustering when present results in
inflated Type I error. Without being able to adjust for clustering, the Type I error rates for the
Poly-3 adjustment increase with correlation values, especially when litters are likely to contain
tumor-bearing animals, such as with moderate-to-high tumor rates (leukemia/lymphoma tumor
rate) and/or low mortality rates (simulations with theta values of 0 or 1). Inflated error rates are
reduced using the clusterPoly-3 method (Figure 2; Table A-4).
To test the effect of the number of siblings used per litter on Type I error, additional simulation
results for dose groups of 10 litters with five siblings per litter were generated for sibling
correlation 0.48 between siblings and treatment-induced lethality of 4. This setting corresponds
to the highest simulated sibling correlation discussed in this report and the highest lethality level
in the original paper.
1
As shown in Table A-5, using the larger number of five siblings does lead
to higher Type I error rates. The highest error rate is for the leukemia/lymphoma tumors (12.9%
for litters with five siblings compared with 7.6% for litters with two siblings).
As sibling correlation increases to 0.24 and 0.48, the power for the clusterPoly-3 method
decreases with respect to the Poly-3 method in the same cases that showed Type I error inflation:
with higher tumor rates and high sibling correlation (Figure 3; Table A-4). Table A-6 shows the
effective dose group sizes estimated using just the Poly-3 adjustment as well as using the
clusterPoly-3 adjustment accounting for the clustering. For each tumor rate and lethality level,
the effective sample sizes decrease with correlation, as predicted by equation [7] in the text.
For the simulations in this report, the strongest factor in determining power is the background
tumor rate. Treatment effect size was modeled for the simulations as in Bailer and Portier
1
and
Bieler and Williams,
2
as increasing linearly with dose to a twofold increase at the highest dose.
For tumors with a high background rate like the leukemia/lymphoma tumors, a substantial tumor
rate of nearly 40% for the highest dose group results in good power. For very low background
rates such as with as lung and pancreatic islet tumors, the twofold tumor rate is only about 2%
for the high dose resulting in lower power. In NTP studies, to counter low power, the evaluation
of test articles includes pairwise testing as well as trend testing for many endpoints. For some
test articles, NTP studies use an increased sample size. Table A-5 includes a protocol with dose
group size of 30 litters with three siblings, a protocol also used in NTP studies.
20
This protocol
shows the highest power for all endpoints. However, these simulation results show that for any
reasonable sample size, detection of a twofold increase in the tumor rate is an unrealistic goal,
regardless of the distribution of animals or the statistical method used.
The results from applying both Poly-3 and clusterPoly-3 methods to real observed data on
25 nonneoplastic lesions in a recent NTP perinatal chronic study
11
confirm the results from the
simulations. In the presence of positive correlation, the clusterPoly-3 p values tend higher than
those predicted by the Poly-3 method. The normed distance between the p values for the two
methods increases as estimated correlation increases (Figure 4).
As stated in the Bailer and Portier study,
1
the Poly-3 (and therefore the clusterPoly-3) test can be
modified by allowing the exponent of the score function to take on values other
than 3. Results can be improved by estimating the k-parameter from the probability distribution

Trend Test for Binary Data with Survivability and Clustering Adjustments
17
References
1. Bailer AJ, Portier CJ. Effects of treatment-induced mortality and tumor-induced mortality on
tests for carcinogenicity in small samples. Biometrics. 1988; 44(2):417-431.
https://doi.org/10.2307/2531856
2. Bieler GS, Williams RL. Ratio estimates, the delta method, and quantal response tests for
increased carcinogenicity. Biometrics. 1993; 49(3):793-801. https://doi.org/10.2307/2532200
3. Blystone CR, Kissling GE, Bishop JB, Chapin RE, Wolfe GW, Foster PMD. Determination of
the di-(2-ethylhexyl) phthalate NOAEL for reproductive development in the rat: Importance of
the retention of extra animals to adulthood. Toxicol Sci. 2010; 116(2):640-646.
https://doi.org/10.1093/toxsci/kfq147
4. Golub MS, Sobin CA. Statistical modeling with litter as a random effect in mixed models to
manage "intralitter likeness". Neurotoxicol Teratol. 2020; 77:106841.
https://doi.org/10.1016/j.ntt.2019.106841
5. Williams DA. The analysis of binary responses from toxicological experiments involving
reproduction and teratogenicity. Biometrics. 1975; 31(4):949-952.
https://doi.org/10.2307/2529820
6. Kupper LL, Haseman JK. The use of a correlated binomial model for the analysis of certain
toxicological experiments. Biometrics. 1978; 34(1):69-76. https://doi.org/10.2307/2529589
7. Corcoran C, Ryan L, Senchaudhuri P, Mehta C, Patel N, Molenberghs G. An exact trend test
for correlated binary data. Biometrics. 2001; 57(3):941-948. https://doi.org/10.1111/j.0006-
341X.2001.00941.x
8. Harris SF, McBride SJ, Smith MV, Cunny HC, Shockley KR. Analysis of incidence data in
developmental toxicity studies: Statistical tests to account for litter effects in fetal defect data.
Birth Defects Res. 2023; 115(3):327-337. https://doi.org/10.1002/bdr2.2120
9. National Toxicology Program (NTP). NTP technical report on the toxicology and
carcinogenesis study of styrene-acrylonitrile trimer in F344/N rats (perinatal and postnatal feed
studies). Research Triangle Park, NC: U.S. Department of Health and Human Services, Public
Health Service, National Institutes of Health, National Toxicology Program; 2012. NTP
Technical Report No. 573. NIH Publication No. 12-5915. https://ntp.niehs.nih.gov/go/tr573abs
10. National Toxicology Program (NTP). NTP technical report on the toxicology studies of a
pentabromodiphenyl ether mixture [DE-71 (technical grade)] (CASRN 32534-81-9) in F344/N
rats and B6C3F1/N mice and toxicology and carcinogenesis studies of a pentabromodiphenyl
ether mixture [DE-71 (technical grade)] in Wistar Han [Crl:WI(Han)] rats and B6C3F1/N mice
(gavage studies). Research Triangle Park, NC: U.S. Department of Health and Human Services,
Public Health Service, National Toxicology Program; 2016. NTP Technical Report No. 589.
https://doi.org/10.22427/NTP-TR-589
11. National Toxicology Program (NTP). NTP technical report on the toxicology and
carcinogenesis studies of 2-hydroxy-4-methoxybenzophenone (CASRN 131-57-7) administered

Trend Test for Binary Data with Survivability and Clustering Adjustments
18
in feed to Sprague Dawley (Hsd:Sprague Dawley SD) rats and B6C3F1/N mice. Research
Triangle Park, NC: U.S. Department of Health and Human Services, Public Health Service,
National Toxicology Program; 2020. NTP Technical Report No. 597.
https://doi.org/10.22427/NTP-TR-597
12. Portier CJ, Hedges JC, Hoel DG. Age-specific models of mortality and tumor onset for
historical control animals in the National Toxicology Program's carcinogenicity experiments.
Cancer Res. 1986; 46(9):4372-4378.
13. Cochran WG. Sampling techniques. 3rd
ed. New York, NY: Wiley; 1977.
14. Rao JNK, Scott AJ. A simple method for the analysis of clustered binary data. Biometrics.
1992; 48(2):577-585. https://doi.org/10.2307/2532311
15. Nelson RB. An introduction to copulas. 2nd ed. New York, NY: Springer; 2006.
16. Genest C, Mackay J. The joy of copulas: Bivariate distributions with uniform marginals. Am
Stat. 1986; 40(4):280-283. https://doi.org/10.1080/00031305.1986.10475414
17. Killip S, Mahfoud Z, Pearce K. What is an intracluster correlation coefficient? Crucial
concepts for primary care researchers. Ann Fam Med. 2004; 2(3):204-208.
https://doi.org/10.1370/afm.141
18. Ridout MS, Demétrio CGB, Firth D. Estimating intraclass correlation for binary data.
Biometrics. 1999; 55(1):137-148. https://doi.org/10.1111/j.0006-341X.1999.00137.x
19. King-Herbert AP, Sills RC, Bucher JR. Commentary: Update on animal models for NTP
studies. Toxicol Pathol. 2010; 38(1):180-181. https://doi.org/10.1177/0192623309356450
20. National Toxicology Program (NTP). NTP technical report on the toxicology and
carcinogenesis studies in Sprague Dawley (Hsd:Sprague Dawley SD) rats exposed to whole-
body radio frequency radiation at a frequency (900 Mhz) and modulations (GSM and CDMA)
used by cell phones. Research Triangle Park, NC: U.S. Department of Health and Human
Services, Public Health Service, National Toxicology Program; 2018. NTP Technical Report No.
595. https://doi.org/10.22427/NTP-TR-595
21. Kendall MG, Gibbons JD. Rank correlation methods. 5th ed. New York, NY: Oxford
University Press; 1990.
Trend Test for Binary Data with Survivability and Clustering Adjustments
A-1
Appendix A. Supplementary Tables
Tables
Table A-1. Type I Error Rates for Trend Test in Tumor Incidence with Zero Sibling
Correlation ................................................................................................................ A-2
Table A-2. Type I Error Rates for Trend Test in Tumor Incidence with Positive Sibling
Correlation ................................................................................................................ A-3
Table A-3. Power for Trend Test in Tumor Incidence with Zero Sibling Correlation ............... A-4
Table A-4. Power for Trend Test in Tumor Incidence with Positive Sibling Correlation .......... A-5
Table A-5. Proportions of Significant Results Found per 5,000 Simulated Data Sets ............... A-6
Table A-6. Mortality Adjustment (Poly-3) Is Shown for the High-dose Groups (25 Litters with
Two Siblings) and Average Adjusted Litter Size .................................................... A-7

Trend Test for Binary Data with Survivability and Clustering Adjustments
A-2
Table A-1, Table A-2, Table A-3, and Table A-4 provide the numeric results shown in Figure 2
and Figure 3 in the main report text. Table A-1 and Table A-2 provide numeric values for
Figure 2, illustrating Type I error rates. Table A-3 and Table A-4 provide numeric values for
Figure 3, illustrating power.
Table A-1. Type I Error Rates for Trend Test in Tumor Incidence with Zero Sibling Correlation
Sex, Species, Tumor Rate
Tumor Type
Treatment Lethality
(
Values )
P Value
Poly-3
clusterPoly-3
Female rat, ~19.1%
Leukemia/lymphoma
0
0.056
0.056
1
0.054
0.055
4
0.043
0.044
7
0.051
0.052
Male rats, ~4.6%
Liver
0
0.056
0.056
1
0.050
0.049
4
0.041
0.043
7
0.036
0.038
Female rats, ~1.2%
Lung
0
0.050
0.049
1
0.048
0.047
4
0.043
0.043
7
0.046
0.049
Female rats, ~1.0%
Pancreatic islets
0
0.046
0.045
1
0.035
0.035
4
0.019
0.019
7
0.016
0.016
Percentage of 5,000 simulated data sets with significant trend is shown for both methods discussed in text.

Trend Test for Binary Data with Survivability and Clustering Adjustments
A-3
Table A-2. Type I Error Rates for Trend Test in Tumor Incidence with Positive Sibling Correlation
Sex, Species, Tumor Rate
Tumor Type
Treatment
Lethality
(
Values)
Simulated Sibling
Correlation
P Value
Poly-3 clusterPoly-3
Female rats, ~19%
Leukemia/lymphoma
0
0.24
0.062
0.050
0.48
0.078
0.055
1
0.24
0.062
0.052
0.48
0.070
0.048
4
0.24
0.059
0.049
0.48
0.076
0.051
7
0.24
0.059
0.049
0.48
0.071
0.049
Male rats, ~4.6%
Liver
0
0.24
0.063
0.059
0.48
0.069
0.054
1
0.24
0.059
0.055
0.48
0.063
0.051
4
0.24
0.043
0.039
0.48
0.051
0.040
7
0.24
0.034
0.031
0.48
0.041
0.033
Female rats, ~1.2%
Lung
0
0.24
0.053
0.050
0.48
0.057
0.043
1
0.24
0.052
0.048
0.48
0.058
0.046
4
0.24
0.047
0.043
0.48
0.062
0.049
7
0.24
0.050
0.047
0.48
0.058
0.046
Female rats, ~1.0%
Pancreatic islets
0
0.24
0.045
0.042
0.48
0.051
0.040
1
0.24
0.042
0.038
0.48
0.048
0.039
4
0.24
0.028
0.025
0.48
0.031
0.023
7
0.24
0.016
0.014
0.48
0.018
0.014
Percentage of 5,000 simulated data sets with significant trend is shown for both methods discussed in text.

Trend Test for Binary Data with Survivability and Clustering Adjustments
A-4
Table A-3. Power for Trend Test in Tumor Incidence with Zero Sibling Correlation
Sex, Species, Tumor Rate
Tumor Type
Treatment Lethality
(
Values)
P Value
Poly-3
clusterPoly-3
Female rats, ~19%
Leukemia/lymphoma
0
0.559
0.561
1
0.561
0.563
4
0.523
0.523
7
0.496
0.498
Male rats, ~5%
Liver
0
0.227
0.231
1
0.211
0.209
4
0.148
0.149
7
0.125
0.124
Female rats, ~1.2%
Lung
0
0.133
0.133
1
0.124
0.126
4
0.134
0.133
7
0.131
0.135
Female rats, ~1.0%
Pancreatic islets
0
0.114
0.114
1
0.101
0.101
4
0.064
0.062
7
0.042
0.041
Percentage of 5,000 simulated data sets with significant trend is shown for both methods discussed in text. Simulated effect
increases linearly with twice the background rate at high dose.

Trend Test for Binary Data with Survivability and Clustering Adjustments
A-5
Table A-4. Power for Trend Test in Tumor Incidence with Positive Sibling Correlation
Sex, Species, Tumor Rate
Tumor Type
Treatment
Lethality
(
Values)
Simulated Sibling
Correlation
P Value
Poly-3 clusterPoly-3
Female rats, ~19%
Leukemia/lymphoma
0
0.24
0.548
0.511
0.48
0.556
0.469
1
0.24
0.552
0.516
0.48
0.541
0.457
4
0.24
0.530
0.490
0.48
0.529
0.447
7
0.24
0.503
0.465
0.48
0.515
0.433
Male rats, ~5%
Liver
0
0.24
0.231
0.218
0.48
0.250
0.211
1
0.24
0.217
0.199
0.48
0.225
0.186
4
0.24
0.167
0.156
0.48
0.180
0.149
7
0.24
0.142
0.134
0.48
0.143
0.120
Female rats, ~1.2%
Lung
0
0.24
0.135
0.127
0.48
0.146
0.125
1
0.24
0.132
0.126
0.48
0.142
0.125
4
0.24
0.139
0.128
0.48
0.150
0.127
7
0.24
0.139
0.133
0.48
0.141
0.120
Female rats, ~1.0%
Pancreatic islets
0
0.24
0.124
0.117
0.48
0.121
0.103
1
0.24
0.098
0.092
0.48
0.105
0.088
4
0.24
0.064
0.061
0.48
0.073
0.061
7
0.24
0.049
0.048
0.48
0.056
0.047
Percentage of 5,000 simulated data sets with significant trend are shown for both methods discussed in text. Simulated effect
increases linearly with twice the background rate at high dose.

Trend Test for Binary Data with Survivability and Clustering Adjustments
A-6
Table A-5 provides additional results of Type I error rates and power for both the Poly-3 and the
clusterPoly-3 tests for two additional protocols. Results are limited to the highest sibling
correlation (0.48) and induced lethality at theta = 4 (the highest setting in Bailer and Portier).
1
Relevant results from the simulations in the text are included for comparison.
Table A-6 separates the sample size adjustments for early mortality and sibling correlation for
the simulations used in the text. An initial sample size of 50 animals (25 litters × 2 siblings/sex)
are assumed for each dose group. The derivation of the clusterPoly-3 method does not include
calculations of effective sample size, so the Poly-3 adjustment without accounting for clustering
is applied first; a well-known adjustment to sample size for clustering (equation [7] in the text) is
then applied to the Poly-3 adjusted sample size.
Table A-5. Proportions of Significant Results Found per 5,000 Simulated Data Sets
25 Litters of 2 Pups
30 Litters of 3 Pups
10 Litters of 5 Pups
Poly-3
clusterPoly-3
Poly-3
clusterPoly-3
Poly-3
clusterPoly-3
Type I Error Rates
Leukemia/lymphoma
(19.1%)
0.076
0.051
0.087
0.049
0.129
0.058
Liver (4.6%)
0.051
0.040
0.050
0.033
0.078
0.043
Lung (1.2%)
0.062
0.049
0.075
0.055
0.074
0.040
Pancreatic Islets (1.0%)
0.031
0.023
0.040
0.028
0.043
0.021
Power
Leukemia/lymphoma
(19.1%)
0.529
0.447
0.680
0.551
0.511
0.328
Liver (4.6%)
0.180
0.149
0.240
0.178
0.216
0.129
Lung (1.2%)
0.150
0.127
0.200
0.163
0.168
0.099
Pancreatic Islets (1.0%)
0.073
0.061
0.110
0.083
0.104
0.058
Sibling correlation was set at 0.48 with a lethality setting of theta0 = 4. Results for 25 litters of two pups shown in the text are
included for comparison.

Trend Test for Binary Data with Survivability and Clustering Adjustments
A-7
Table A-6. Mortality Adjustment (Poly-3) Is Shown for the High-dose Groups (25 Litters with Two Siblings) and Average Adjusted Litter
Size
Induced
Lethality
Level
Sibling
Correlation
Leukemia/Lymphoma Liver Lung Pancreatic Islet
Poly-3
Adjustment
Only
Poly-3
Adjusted
Litter
Size
Adding
Sibling
Correlation
Poly-3
Adjustment
Only
Effective
Litter
Size
Adding
Sibling
Correlation
Poly-3
Adjustment
Only
Effective
Litter
Size
Adding
Sibling
Correlation
Poly-3
Adjustment
Only
Effective
Litter
Size
Adding
Sibling
Correlation
0
0
47.5
1.90
47.5
46.3
1.85
46.3
47.0
1.88
47.0
46.9
1.88
46.9
0
0.24
47.5
1.90
38.8
46.2
1.85
38.1
47.0
1.88
38.5
46.9
1.88
38.5
0
0.48
47.5
1.90
32.8
46.2
1.85
32.5
47.0
1.88
32.6
46.9
1.88
32.6
1
0
45.3
1.81
45.3
43.0
1.72
43.0
44.3
1.77
44.3
44.1
1.77
44.1
1
0.24
45.3
1.81
37.6
43.0
1.72
36.4
44.2
1.77
37.1
44.2
1.77
37.1
1
0.48
45.3
1.81
32.2
43.0
1.72
31.6
44.2
1.77
31.9
44.2
1.77
31.9
4
0
39.7
1.59
39.7
35.6
1.42
35.6
37.7
1.51
37.7
37.5
1.50
37.5
4
0.24
39.7
1.59
34.6
35.6
1.42
32.2
37.6
1.51
33.4
37.5
1.50
33.3
4
0.48
39.7
1.59
30.7
35.6
1.43
29.4
37.7
1.51
30.1
37.5
1.50
30.0
7
0
35.5
1.42
35.5
30.6
1.22
30.6
32.8
1.31
32.8
32.6
1.31
32.6
7
0.24
35.5
1.42
32.1
30.6
1.22
29.0
32.9
1.32
30.5
32.6
1.30
30.3
7
0.48
35.5
1.42
29.4
30.6
1.22
27.5
32.8
1.31
28.4
32.6
1.30
28.3
Trend Test for Binary Data with Survivability and Clustering Adjustments
B-1
Appendix B. Approach for Simulations
Table of Contents
B.1. Generating Lesion Onset Times ...........................................................................................B-2
B.2. Generating Death Times .......................................................................................................B-3
B.3. Poly-3 Scores........................................................................................................................B-3

Trend Test for Binary Data with Survivability and Clustering Adjustments
B-2
The simulations used in this report were generated with the same models used by Bailer and
Portier
1
and Bieler and Williams,
2
with the addition of sibling correlation. Notation in this
Appendix is the same as that used earlier in the text, and equations [5] and [6] from the text are
repeated below.
[1B]
[2B]
To apply the clusterPoly-3 statistic developed in the Methods sections, descriptive statistics of
the data, such as initial number of siblings per litter and the number of litters per dose group, are
needed. Although balanced data are not required for using the statistic, the simulated data in this
report were balanced with litter numbers and sizes per dose group as described in the text. In
addition, the clusterPoly-3 statistic needs the effective dose and litter sizes found by summing the
Poly-3 scores over the animals in each group. The text below describes how Poly-3 scores are
generated for the simulations. Since both tumors and nonneoplastic lesions are considered in the
text, lesion onset time will be referenced.
Briefly, Gaussian copulas are used to generate lesion onset times according to the Weibull
distributions specified in equation [1B] and death times according to the modified Weibull
distributions specified in equation [2B], both shown above. Statistics staff then compare onset
with death times and apply the Poly-3 score rule for each generated data set.
B.1. Generating Lesion Onset Times
Lesion onset times are generated for each animal, keeping track of both the dose group and the
litter. The assumption is that lesion onset times may be correlated between siblings of the same
litter, so statistics staff begin by using the function “rmvnorm” from the R package “mvtnorm” to
generate random, normally distributed vectors of the same length as each dose group with a
specified zero mean vector and a block matrix with correlation matrices down the diagonal for
each litter. For example, if there are 25 litters with two animals (of the same sex) in each litter,
then the variance matrix will have 25 2 × 2 ma
trices down the diagonal of the form
The “cc” parameter refers to the Pearson correlation with values {0, 0.25, and 0.50} in our
simulations. The goal is to transform these random numbers to random numbers distributed
according to the CDF in [1B], while retaining correlation structure. However, Pearson
correlations will not be conserved across nonlinear transformations, so instead, statistics staff
turn to Spearman correlations, which are based on the ranks of the data. Although the
transformations used are not linear, they are monotone, so the Spearman correlations will be
conserved. Fortunately for normally distributed data, the corresponding Spearman correlations
can be calculated using the following formula.
21
The corresponding Spearman correlations to the Pearson correlation values {0, 0.25, and 0.50}
are {0, 0.24, 0.48}.

B-3
Trend Test for Binary Data with Survivability and Clustering Adjustments
Two transformations are then applied. First, statistics staff apply the normal distribution function
corresponding to the distribution that generated the data. That transformation (sometimes
referred to as the “probability integral transform”) gives a sample of uniformly distributed data
with the designated Spearman correlations between siblings. The procedure is then reversed and
uses the inverse Weibull distribution corresponding the equation [1B] (“qweibull” in R version
Rx64 4.1.2) to generate the onset data that are distributed according to the desired Weibull
distribution and with the Spearman correlations between siblings. Note that the Portier et al.
12
reference also specifies multiplication factors for onset times that were used as directed. All
animals with lesion onset times coming after study termination are considered free of findings.
B.2. Generating Death Times
The procedure for generating death times is similar, but no sibling correlations are included.
Initial simulations did include sibling correlations of death times, but these correlations had no
discernable effect on the outcomes. In addition, early deaths in chronic studies have random
components, such as intermediate sacrifices or accidents that limit maternal effects. For
generating random death times, statistics staff begin again with a random vector of N(0,1) data
and apply the same normal distribution function to convert to random uniformly distributed data.
To convert these numbers to death times with the desired modified Weibull distribution, the
distribution function in equation [2B] is inverted.
Unfortunately, this modification of the Weibull distribution
12
could not be found in the software
NIEHS uses, so the inversion was done by hand. Marking “day intervals” corresponding to the
days on study on the horizontal axis, equation [2B] is used to plot corresponding intervals onto
the [0, 1] range on the vertical axis. Moving through each interval on the vertical axis in turn, the
“sel” command in R is used to identify all uniformly distributed random numbers falling within
that vertical interval and to also find the corresponding day interval on the horizontal axis. The
day interval then determines the day of death for that animal. The result is random death days
distributed according to equation [2B]. Animals with death days after study termination are
recorded as sacrificed at study termination.
B.3. Poly-3 Scores
Finally, the generated death times are compared to the generated days of onset of lesions for each
generated animal, and the Poly-3 scores are calculated: If the lesion onset time is less than the
death day and is less than the day of study termination, the animal is determined to have the
lesion and is assigned a Poly-3 score of “1.” If the death day is the day of study termination, the
Poly-3 score is again “1.” If the death day comes before study termination and before the day of
lesion onset, the Poly-3 score is: , wherein T is the duration of the study, and “t” is
the death day (Note that t is always ≤ T).

National Toxicology Program
National Institute of Environmental Health Sciences
National Institutes of Health
P.O. Box 12233, MD K2-05
Durham, NC 27709
Tel: 984-287-3211
https://ntp.niehs.nih.gov
ISSN 2473-4756
