

www.trelliscompany.org2
About the Student Financial Wellness Survey
The Student Financial Wellness Survey (SFWS) is a self-reported, online survey that
documents the financial well-being and student success indicators of postsecondary
students across the nation. While not nationally representative, responses were weighted
to reflect the total student composition at the participating institutions. The SFWS was
designed and implemented by Trellis Research starting in 2018. Since then, 2.4 million
students have been surveyed at 231 institutions in 33 states.
The SFWS is a free national survey oered by Trellis Company that explores the
connections between student finances, academic success, and more. Interested
in participating in the Fall 2023 implementation of SFWS? Learn more here:
www.trelliscompany.org/SFWS-get-started
About Trellis Company
Trellis Company (trelliscompany.org) is a nonprofit 501(c)(3) corporation focused
on helping people leverage the power of post-secondary education and learning
to improve their quality of life and the communities where they live.
About Trellis Research
Trellis Research (trelliscompany.org/research) provides colleges and policymakers
insight into student success through the lens of higher education aordability.
With more than three decades of experience studying key issues such as student
debt, student loan counseling, and the financial barriers to attainment, our research
team explores the roles of personal finance, financial literacy, and financial aid in
higher education.
Interested in collaborations or need research expertise? Trellis Research welcomes
opportunities to inform policymakers and help organizations address their analytical
needs. For more information, please contact Trellis Research at Trellisresearch@
trelliscompany.org or visit us on Twitter (@TrellisResearch).
Newsletter Subscription
Interested in receiving our monthly newsletter, Trellis Research News: Data, Trends,
and Insights, via email? Subscribe here:
www.trelliscompany.org/research/data-trends-and-insights/
Recommended Citation
Fletcher, C., Cornett, A., Webster, J., and Ashton, B. (2023). Student Financial Wellness
Survey report: Fall 2022 semester results. Trellis Company.
Follow us on Twitter @TrellisResearch

www.trelliscompany.org 3
Table of Contents
Preface ............................................................................................................................................... 4
Acknowledgements ....................................................................................................................4
Executive Summary ....................................................................................................................5
Survey Overview...........................................................................................................................9
Distress Indicators Among College Students ................................................................10
Student Success Indicators .................................................................................................... 16
Students Who Are Parents ....................................................................................................18
Paying For College ....................................................................................................................20
Student Credit Card Use and Risky Borrowing .......................................................... 23
Financial Behavior, Knowledge, and Decision-Making .......................................... 26
Research to Practice ................................................................................................................. 29
Conclusion ....................................................................................................................................31
Appendix A: Detailed Methodology and Sample Characteristics ....................... 32
Appendix B: Survey Questions and Responses ........................................................... 39
Appendix C: Endnotes............................................................................................................. 54

www.trelliscompany.org4
Preface
Over 200,000 students have shared their responses to the Student Financial Wellness
Survey (SFWS) since Trellis Company (Trellis) started this survey in 2018. Trellis is
honored to amplify the voices of these students. This report shares the findings
from the Fall 2022 SFWS and reflects the responses of over 36,000 students.
Institutions across the country have used the results of their school reports to inform
their strategic planning, adjust their student support programs, and advocate for
increased resources to address student need. This work has grown as Trellis and
many other organizations have elevated the importance of addressing student
financial needs.
Participating in the SFWS is free, and each institution receives a customized report
of their results with a comparison group from similar institutions. This report details
aggregated findings from the Fall 2022 implementation.
• The Fall 2022 SFWS was implemented at 89 colleges and universities across
23 states. This includes 61 community colleges, 18 four-year public, and
10 four-year private institutions.
• Trellis surveyed 388,653 undergraduates and received responses from
36,446 students for a response rate of 9.4 percent.
• The responses were weighted to reflect the total composition of
participating institutions.
For more information about how to participate in future implementations of the
SFWS, please contact Trellis Research at Trellisresearch@trelliscompany.org.
Acknowledgements
We are appreciative of the institutions that participated in the SFWS; your work
supporting students in their educational pursuits is making a dierence.
To the students who took the time to participate in the survey—thank you so much.
It is our hope that the information learned from your participation will be used to
support students across the country as they work towards achieving their goals.
Comments and requests for additional information regarding this report or any of
Trellis’ other publications are welcome. Please direct questions to:
Je Webster
Director of Research
Trellis Company
Phone Number: (800) 252-9743, ext.4504
Email: Je.Webster@trelliscompany.org
www.trelliscompany.org/research
Twitter: @TrellisResearch
THIS REPORT SHARES
THE FINDINGS FROM
THE FALL 2022 SFWS
AND REFLECTS THE
RESPONSES OF OVER
36,000 STUDENTS.

www.trelliscompany.org 5
Executive Summary
This survey provides a snapshot of student wellbeing during the fall of 2022. Lingering
economic impacts of the COVID-19 pandemic and rising inflation meant that many
students struggled to make ends meet. Over 380,000 students were surveyed from
89 schools in 23 states and 36,446 students responded. This report is meant to amplify
the lived experience of these students. Understanding these experiences will allow
college administrators and policymakers to better serve students, enabling them to
reach their academic potential.
LINGERING ECONOMIC
IMPACTS OF THE
COVID-19 PANDEMIC AND
RISING INFLATION MEANT
THAT MANY STUDENTS
STRUGGLED TO MAKE
ENDS MEET.
SURVEY METRICS
Fall 2022 SFWS – Undergraduate Cohort
2-year Institutions 4-year Institutions Total
Survey Population 241,307 students 147,346 students 388,653 students
Responses 20,536 students 15,910 students 36,446 students
Response Rate 8.5% 10.8% 9.4%
Completion Rate 78% 79% 79%
Median Time Spent 14 minutes 13 minutes 14 minutes
What is new?
New questions:
• Added questions regarding academics and return on investment: Students were
asked if they have diculty concentrating on schoolwork because of their financial
situation, and they were asked if they felt the cost of college is a good investment
for their financial future.
• Added questions about parking and transportation issues: Students were asked
about the availability of parking on campus and about missing class due to lack of
reliable transportation.
• Added questions to learn more about the impact of childcare access: Parenting
students were asked if they had missed class due to lack of childcare, and what
they would do if they did lose access to their current childcare arrangements.
• Added a question about mental health services: Students were asked if their school
has mental health or counseling services available.

www.trelliscompany.org6
Deleted questions:
• Deleted questions about technology access: These questions had focused
on identifying technology gaps, which was paramount during the COVID-19
pandemic. It was found that the gaps are generally small.
• Deleted a question regarding receipt of federal stimulus funds: This question was
intended to be temporary, to capture federal stimulus fund disbursements during
the COVID-19 pandemic.
• Deleted a question regarding financial discussions with financial professionals:
To reduce survey burden, a question regarding financial professional interactions
was removed.
• Deleted a question about bank accounts: Since very few respondents reported
being unbanked, this question was removed to reduce survey burden.

www.trelliscompany.org 7
The Fall 2022 SFWS covers a range of topics related to the financial wellbeing of postsecondary students. The
following key findings section oers a high-level overview of some of the results from the survey. Each heading
corresponds to a longer section in the remainder of the report which includes more in-depth analysis
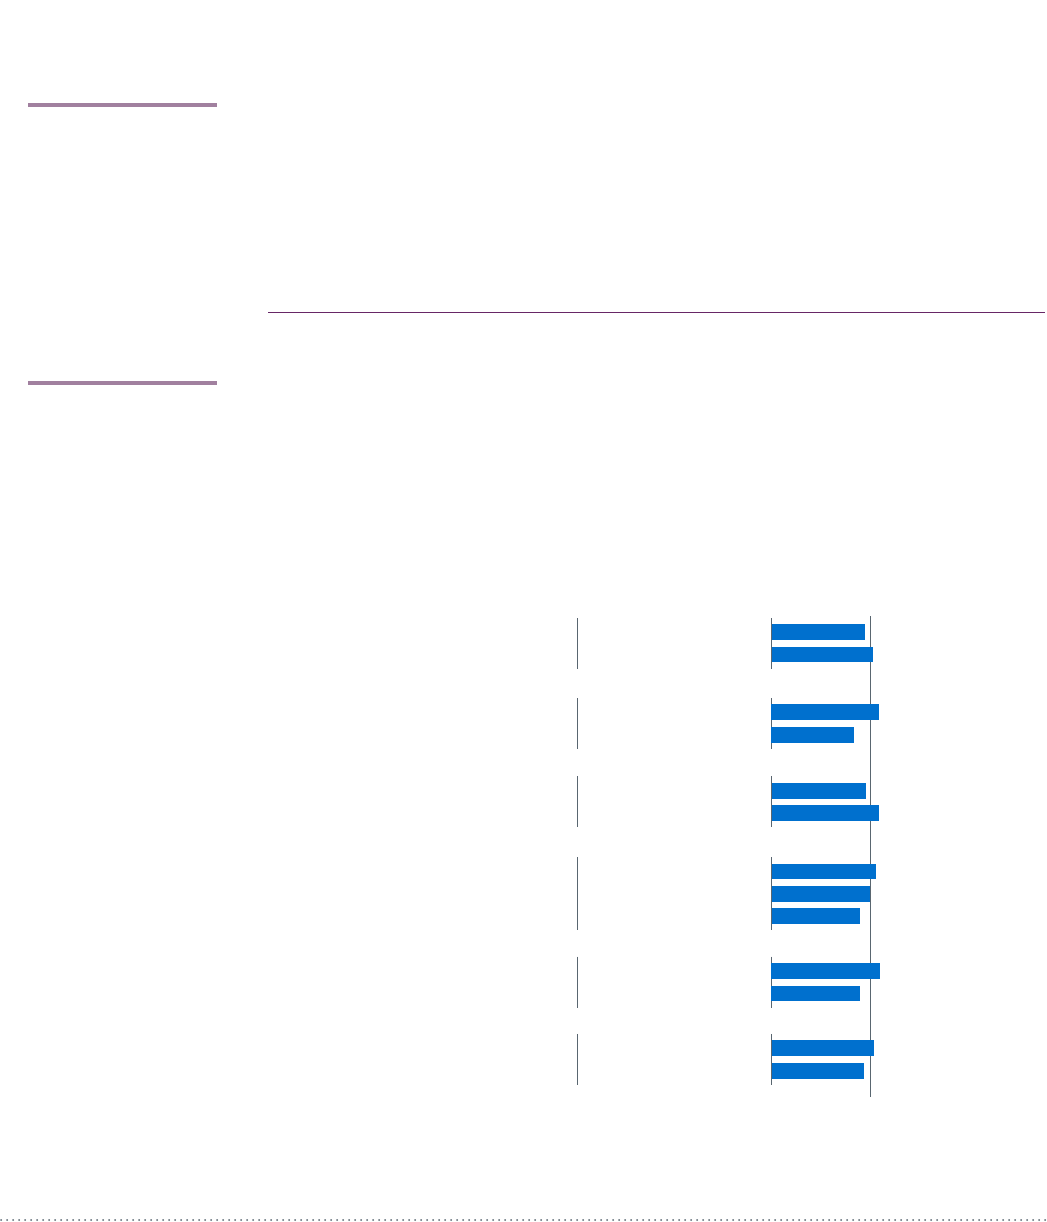
KEY FINDINGS: DISTRESS INDICATORS AMONG COLLEGE STUDENTS
• A majority of students reported they would have diculty finding $500 in cash or credit in case of an
emergency. While some of these students would turn to their savings or to family members for support,
others would be forced to borrow, use their credit cards, sell their possessions, or delay paying a bill.
• Overall, 10 percent of students experienced all three forms of basic needs insecurity in the past year:
food insecurity, housing insecurity, and homelessness.
• Higher percentages of respondents who experienced key indicators of distress were students of color, female
students, first-generation students, or enrolled part-time compared to all undergraduate respondents.
KEY FINDINGS: STUDENT SUCCESS INDICATORS
• Financial concerns impacted academics for some students, with 48 percent of respondents who had
experienced financial challenges while enrolled agreeing or strongly agreeing that they had diculty
concentrating on schoolwork because of their financial situation.
• Learners over 24 years old, first-generation students, students who saw themselves as workers who attend
school, or students who reported it was important they support their family financially while enrolled were
more likely to say they had diculty concentrating on schoolwork because of their financial situation
compared to their peers.
• Higher percentages of parenting students who would not be able to get $500 in an emergency, who ran
out of money, or who had experienced basic needs insecurities had missed classes due to childcare issues
compared to parenting students who did not experience those distress indicators.
KEY FINDINGS: STUDENTS WHO ARE PARENTS
• Twenty-two percent of respondents were parents to children, and these respondents were more likely
to be enrolled part-time, first-generation students, 25 years or older, female, or Black than their
non-parenting peers.
• More than 40 percent of parenting students reported receiving medical assistance and food assistance
during the year.
• Higher percentages of student parents reported they would have diculty finding $500 in an emergency,
ran out of money, sold belongings to make ends meet, or experienced housing security compared to
their non-parenting peers.

www.trelliscompany.org8
KEY FINDINGS: PAYING FOR COLLEGE
• Most respondents had completed the Free Application for Federal Student Aid (FAFSA). Among those who
did not complete the application, the most common reason was perceived ineligibility.
• While many students use savings or income to pay for college, it rarely is enough. Only two percent
of four-year respondents and five percent of two-year respondents reported using only one or both
of these resources.
• Thirty-seven percent of respondents reported receiving some form of family support to pay for college.
• Respondents who borrowed student loans reported experiencing key indicators of distress at higher rates
compared to all respondents.
KEY FINDINGS: STUDENT CREDIT CARD USE AND RISKY BORROWING
• While 77 percent of respondents who used a credit card in the past year reported paying their bill on time, only
39 percent agreed or strongly agreed that they fully pay o their balance each month, with the rest accruing
interest at potentially high rates.
• Respondents from four-year schools, white respondents, and non-first-generation respondents were more
likely to report that they fully pay o their credit card balance each month, compared to their peers.
• Respondents who had borrowed auto title loans and payday loans reported experiencing key distress
indicators at higher rates compared to all respondents.
KEY FINDINGS: FINANCIAL BEHAVIOR, KNOWLEDGE, AND DECISIONMAKING
• Respondents who reported following a budget were more likely to say they pay their bills on time, and
respondents who said they know where to find advice on financial decisions were more likely to report
having confidence in their ability to manage their finances.
• Seventy percent of respondents said they believed the cost of college was a good investment for their
financial future.
• Respondents who disagreed or strongly disagreed they always pay their bills on time reported experiencing
all key distress indicators at higher rates compared to all undergraduate respondents.
www.trelliscompany.org 9
Survey Overview
The SFWS is a self-reported, online survey that seeks to document the financial well-being
and student success indicators of postsecondary students across the country. The survey
was open beginning on October 24, 2022, and closed on November 14, 2022. Eighty-nine
(89) institutions participated in the survey—61 two-year institutions, 18 public four-years,
and 10 private not-for-profit four-years. While the pool of schools in the survey represents
a diverse group of institutions and students served, it should be considered a convenience
sample – albeit an extremely large one – as it is not strictly representative of the entire
nation. The response rate was 9.4 percent, so there may be response bias in the data.
Trellis tried to mitigate this risk by weighting the results by gender, age, and enrollment
intensity to better reflect the total population of the participating schools based on data
fields available for all students surveyed regardless of whether they responded or not.
Minimal dierences were found. When compared to all students surveyed, respondents
tended to be slightly older, more likely to attend full-time, and were more likely to identify
as female. While weighting the results by these indicators will make the results more
representative, there may be other factors beyond our control that may generate a bias in
the results. A detailed description of survey characteristics, comparison groups, tests for
representativeness, methodology, and other research notes can be found in Appendix A.
This report is divided into the following sections:
• Distress Indicators Among College Students
• Student Success Indicators
• Students Who Are Parents
• Paying For College
• Student Credit Card Use and Risky Borrowing
• Financial Behavior, Knowledge, and Decision-Making
WHEN COMPARED TO
ALL STUDENTS SURVEYED,
RESPONDENTS TENDED
TO BE SLIGHTLY OLDER,
MORE LIKELY TO ATTEND
FULL-TIME, AND WERE
MUCH MORE LIKELY TO
IDENTIFY AS FEMALE.

www.trelliscompany.org10
Distress Indicators Among
College Students
Paying for college can be stressful and challenging. With its steep, if brief, period of
investment, the long-term rewards of higher education can seem distant as students
become overwhelmed by associated costs. Unsurprisingly, a large majority of students
report financial diculties. This section shows the incidence of 10 indicators of financial
distress, sometimes breaking the results out by race/ethnicity, gender, first-generation
status, enrollment intensity, and school sectors. Many students say they would have
diculty meeting a $500 emergency, suggesting inadequate savings to cover unexpected
costs or financial shortfalls. Basic needs insecurity and mental health challenges can
have devastating impacts on students as well. Other indicators of distress – such as
selling one’s belongings to make ends meet or running out of money eight or more times
within a 10-month period – beset substantial portions of students. Such concerns can
impede learning, reduce happiness, and erode students’ social lives.
FINDINGS
• While a majority of respondents overall worried about paying current expenses and
having enough money to pay for school, students of color were more likely to report
this compared to white students. Black and Hispanic respondents were also more likely
to say they would have trouble finding $500 in cash or credit in case of an emergency
in the next month. (Q42, Q49-50)
• The use of savings or turning to family were the most common options for
respondents in need of $500 in a hypothetical emergency, but higher percentages
of four-year respondents would have these options available compared to two-year
respondents. Twelve percent of four-year respondents and 17 percent of two-year
respondents said they would be unable to find such an amount if faced with an
emergency. (Q43)
• Sometimes students face financial emergencies which deplete their reserves. While it
was fairly common to run out of money at least once, 20 percent of students ran out
of money eight or more times during the year. (Q44)
THE LONG-TERM
REWARDS OF HIGHER
EDUCATION CAN SEEM
DISTANT AS STUDENTS
BECOME OVERWHELMED
BY ASSOCIATED COSTS.
Trouble finding $500
69%Black
61%Hispanic
53%White
Worried about
current expenses
59%Black
55%Hispanic
51%White
Worried about
paying for college
63%Black
68%Hispanic
61%White

www.trelliscompany.org 11
Food Security
The Economic Research Service (ERS) of the United States Department of Agriculture
(USDA) defines food security as “access by all people at all times to enough food for
an active, healthy life.” Conversely, ERS describes food insecurity as “the limited or
uncertain availability of nutritionally adequate and safe foods, or limited or uncertain
ability to acquire acceptable foods in socially acceptable ways.”
1
Trellis assessed food security among surveyed students using the USDA short-form,
six-item scale. This scale identifies food-insecure individuals and households with high
sensitivity and specificity, and minimal bias.
2
• According to their survey responses, 46 percent of students had experienced food
insecurity within the 30 days before taking the survey. (Q81-86)
Q81-86: USDA Food Security Scale (30-Day)
54%
High or Marginal
Food Security
23%
Low
Food Security
23%
Very Low
Food Security
Percent of respondents who ran out of
money eight or more times during the year,
by characteristic
Black 33%
Hispanic
18%
White
17%
Female
Male
23%
14%
First Generation
Not First Generation
26%
16%
Average:
20%
Q43: Imagine that you had to pay a $500 cost
unexpectedly in the next month. In this situation, which
of the following resources would you turn to first?
My savings
31%
28%
A credit card
10%
11%
My parent(s) or other
family members
27%
18%
Delaying paying a bill
5%
7%
Selling my possessions
5%
6%
A loan
3%
3%
Reducing my spending
5%
6%
0%
0%
My friend(s)
My school
1%
1%
Other
2%
2%
I would not be able
to get $500
12%
17%
4-year Schools
2-year Schools

www.trelliscompany.org12
In response to this crisis, many institutions have established on-campus food
distribution centers, like food pantries, to better assist students who struggle to meet
their basic needs. However, research suggests that students are generally unaware of
these critical resources (see the Trellis brief, Hungry Minds, for more on this topic).
• Of the 89 colleges and universities that participated in the Fall 2022 implementation,
71 (80 percent) had at least one food pantry or closet available to students.
• Forty-six percent of those who responded “I don’t know” or “no” to the question
about the presence of an on-campus food pantry were food insecure. Further, only
19 percent of food insecure students reported visiting a pantry of any type (on- or
o-campus). (Q87-88)
Housing Security and Homelessness
The Student Financial Wellness Survey incorporates measures of housing security and
homelessness that are commonly used by other researchers studying basic needs security.
3
According to the United States Department of Housing and Urban Development
(HUD), housing insecurity encompasses a range of issues, “including diculty finding
aordable, safe, and/or quality housing, having unreliable or inconsistent housing, and
overall loss of housing.”
4
This may involve diculties in paying for rent and utilities,
needing to frequently move, living in overcrowded conditions, and more.
For many students, maintaining safe and stable housing during college is a significant
challenge. These obstacles can have a profound impact on students’ academic
performance, persistence, and ultimately, their ability to complete their studies and earn
a credential.
5
• Students at two-year institutions were more likely to report housing insecurity
(47 percent) than four-year respondents (40 percent). Overall, 44 percent were
housing insecure during the prior year. (Q90-95)
• Around one-fourth of surveyed students had diculties paying the full amount
of their utility bills (28 percent) and rent (25 percent). Fewer students reported
overcrowding (9 percent) or moving frequently (6 percent).
FOR MANY STUDENTS,
MAINTAINING SAFE AND
STABLE HOUSING DURING
COLLEGE IS A SIGNIFICANT
CHALLENGE.
60%
53%
Housing Secure
40%
47%
Housing Insecure
Q90-95: Housing Security Scale
4-year Schools 2-year Schools

www.trelliscompany.org 13
The most severe form of housing insecurity, homelessness is a significant obstacle to
students achieving their full academic potential. According to Federal Student Aid (FSA),
homelessness is defined as lacking “fixed, regular, and adequate housing.”
6
• While only five percent of students explicitly identified as unhoused, 15 percent
experienced homelessness at some point since starting college or within the last
year. (Q96-105)
• The most common expression of homelessness occurred when students
temporarily stayed with a friend or relative, or couch surfed while looking for
housing (11 percent). Four percent of students, respectively, did not have a home
or had been thrown out of their residence. Students were less likely to report
sleeping outdoors, staying in a shelter, or living in abandoned buildings.
0
3
6
9
12
15
Homelessness Scale Questions
Couch
surfing
10%
13%
Ever been
homeless
4%
6%
Didn’t have
a home
3%
5%
Thrown out
of home
3%
5%
Didn’t know
where would
sleep
2%
4%
Slept in
other closed
space
3%
4%
Evicted
from home
1%
2%
Stayed in
shelter
1%
2%
Stayed in
abandoned
building
0%
1%
Slept
outdoors
1% 1%
4-year Schools 2-year Schools
Overall Basic Needs Insecurity
College students often face one or more forms of basic needs insecurity (BNI) at the
same time, whether that be food insecurity, housing insecurity, or homelessness. Basic
needs security can also be fluid and change over time, meaning a student may be food
secure during the fall and spring semesters, but experience very low food security in the
summer (see the Trellis report “Studying on Empty” for more).
• Three in five students experienced food insecurity, housing insecurity, or homelessness
in the prior 12 months, not only jeopardizing their mental and physical health, but their
academic success.
• Food insecurity puts students at a higher risk of facing housing insecurity.
Thirty percent of students who responded to the survey were both food and
housing insecure.
• Overall, 10 percent of students experienced all three forms of basic needs insecurity
in the past year: food insecurity and housing insecurity and homelessness. The high
prevalence of basic needs insecurity among college students is deeply concerning
and demands urgent attention from policymakers, educators, and communities.

www.trelliscompany.org14
Mental Health Challenges
Not only are college students at an increased risk of experiencing basic needs
insecurity, but they are also more vulnerable to mental health challenges that can have
a significant impact on their academic performance, social lives, and physical wellbeing.
In fact, The Healthy Minds Study found that 60 percent of its respondents were likely
experiencing one or more mental health concerns in the 2020-2021 school year.
7
To assess potential mental health challenges among SFWS respondents, two validated
scales were used—the Patient Health Questionnaire-2 (PHQ-2) and the Generalized
Anxiety Disorder 2-item (GAD-2).
The PHQ-2 is a modified, short-form scale that measures the frequency of depressed
mood and the inability to feel pleasure over the past 14 days; the GAD-2 is a modified,
short-form instrument that screens for generalized anxiety disorder.
• Through their responses to the PHQ-2, nearly two in five students (36 percent)
indicated they were likely experiencing depression, a serious mood disorder.
• Sixty-nine percent of respondents had little interest or pleasure in doing things in
the prior 14 days to taking the survey. Nearly two-thirds (66 percent) of students
felt down, depressed, or hopeless in that same timeframe. (Q76-77)
• Anxiety is the leading mental health concern among students; in the Student
Financial Wellness Survey, 46 percent of respondents screened positive for
Generalized Anxiety Disorder.
• Eighty percent of students described feeling nervous, anxious, or on edge at least
several times in the 14 days prior to taking the survey. Almost a quarter
(23 percent) felt this way nearly every day. (Q78-79)
• Of the schools that took part in the survey, 88 percent either directly oered mental
health services (65 percent) or collaborated with an external organization to make
these services available to students (22 percent).
• While a significant portion of students knew of the mental health and counseling
services available to them (62 percent overall), those with mental health concerns
were often less aware of these resources. For instance, 40 percent of those likely
experiencing depression did not know their school had mental health services
available. (Q80)
0
10
20
30
40
50
60
70
80
No
77%
50%
Yes
2%
3%
21%
47%
I don’t know
Q80: Does your school have mental health or
counseling services available for students?
4-year Schools 2-year Schools
ANXIETY IS THE
LEADING MENTAL
HEALTH CONCERN
AMONG STUDENTS.

www.trelliscompany.org 15
Key Indicators of Distress
• Higher percentages of respondents who experienced key indicators of distress were
students of color, female students, first-generation students, or enrolled part-time
compared to all undergraduate respondents. While first-generation students made
up 36 percent of all undergraduate respondents, over half of those who would not
be able to get $500 in an emergency were first-generation students.
STUDENT CHARACTERISTICS BY DISTRESS INDICATOR
Those who… were… Non-White Female First Gen Part-time
All Undergraduate Respondents 53% 61% 36% 43%
Experienced Financial Diculty While Enrolled 54% 64% 39% 43%
Would Have Trouble Finding $500 in Emergency 56% 68% 42% 43%
Wouldn’t Be Able to Find $500 in Emergency
(from any resource)
61% 75% 51% 48%
Ran Out of Money 8 or More Times 58% 72% 47% 48%
Sold Belongings to Make Ends Meet 54% 68% 44% 44%
Indicated Major Depressive Disorder 54% 64% 39% 40%
Indicated Generalized Anxiety Disorder 51% 68% 38% 41%
Experienced Very Low Food Security 56% 67% 46% 42%
Experienced Housing Insecurity 54% 67% 43% 48%
Experienced Homelessness 57% 62% 47% 46%
www.trelliscompany.org16
Student Success
Indicators
Students need general good health, sucient energy, the ability to concentrate on
their studies, and the opportunity to attend classes if they are to excel in college. Stress
regarding finances and other mental health concerns can disrupt the patterns that lead
to high academic performance. In this edition of the SFWS, Trellis added questions
regarding the ability to concentrate on school and missed classes due to financial
pressures. This section examines the frequency of concentration diculties by several
student characteristics including race/ethnicity, age, and first-generation status, but
also by their reported level of importance placed on supporting families financially and
self-perception of being either a student or worker. Concentration and missed classes
can also be tied to Trellis’ ten indicators of financial distress.
FINDINGS
• Financial concerns impacted academics for some students, with with 48 percent
of respondents who had experienced financial challenges while enrolled agreeing
or strongly agreeing that they had diculty concentrating on schoolwork because
of their financial situation. Older students, first-generation students, students who
saw themselves as workers who attend school, and students who reported it was
important they support their family financially while enrolled were more likely to say
they had diculty concentrating on schoolwork because of their financial situation
compared to their peers. (Q4)
AS THE COST OF COLLEGE
CONTINUES TO RISE,
THE MOST VULNERABLE
STUDENT POPULATIONS
ARE FINDING THEMSELVES
REACHING FOR HIGH
INTEREST AND HIGH-RISK
SHORT-TERM LOANS.
Percent of respondents who reported diculty concentrating
on schoolwork because of their financial situation
Under 25
25 and older
46%
52%
Important
Not Important
Student Who Works
Worker Attending School
48%
55%
Average:
48%
Black
Hispanic
White
53%
50%
45%
Parent
Not a Parent
52%
47%
First Generation
Not First Generation
First Generation Status
55%
45%
Age Group
How Students Who Work
View Themselves
Race/Ethnicity
Parent Status
Importance of Supporting Family
Financially While in School
55%
42%

www.trelliscompany.org 17
• About a quarter of all respondents were parents, and a quarter of those parents
reported missing at least one class due to lack of childcare. Higher percentages of
students who experienced certain financial distress indicators (such as not being able
to get $500, running out of money, and experiencing basic needs insecurities) were
parents, compared to all undergraduate respondents, and higher percentages of the
parents with those indicators had missed classes due to childcare issues. Students
experiencing those financial distress indicators also reported missing classes due
to transportation issues at higher rates. Nearly all of the key distress indicators were
associated with higher levels of diculty concentrating on schoolwork due to the
student’s financial situation.
STUDENT CHARACTERISTICS BY DISTRESS INDICATOR
Those who… reported… Was a Parent
Missed
Classes –
Childcare*
Missed
Classes -
Transportation
Diculty
Concentrating**
All Undergraduate Respondents 22% 25% 13% 48%
Experienced Financial Diculty While
Enrolled
24% 28% 16% 48%
Would Have Trouble Finding $500
in Emergency
26% 29% 17% 57%
Wouldn’t Be Able to Find $500
in Emergency (from any resource)
38% 30% 21% 66%
Ran Out of Money 8 or More Times 36% 31% 21% 66%
Sold Belongings to Make Ends Meet 29% 34% 20% 61%
Indicated Major Depressive Disorder 19% 34% 19% 63%
Indicated Generalized Anxiety Disorder 19% 31% 17% 60%
Experienced Very Low Food Security 26% 34% 24% 71%
Experienced Housing Insecurity 31% 30% 19% 62%
Experienced Homelessness 27% 39% 28% 69%
*Of those who said they were a parent to a child or children.
**Of those who said they had experienced financial diculties or challenges while in college.

www.trelliscompany.org18
Students Who Are Parents
A sizable percentage of the respondents – 22 percent – reported being parents. The
responsibilities that come with parenthood can aect students’ available time to study
and disrupt concentration. The added costs of childcare can stress their already limited
resources
8
, forcing many to explore other non-traditional sources of funding including
public assistance and risky credit. Yet even with these non-traditional sources, finances
may be inadequate; parenting students still have a generally higher incidence of financial
distress indicators. Addressing the financial challenges of parenting students can help
institutions improve their student success rates.
FINDINGS
• Twenty-two percent of respondents reported being a parent, primary caregiver, or
legal guardian to children. Parenting students were more likely to attend two-year
institutions and enroll part-time. These students were also more likely to be the first
person in their family to attend college, be 25 years of age and older, female, or
identify as Black.
• Higher percentages of parenting students reported using every category of public
assistance compared to respondents without children. Nearly half of respondents
with children reported using medical assistance and food assistance in 2022.
• Student parents were more likely to have used a credit card during the year than
non-student parents (67 percent vs. 49 percent). Among the respondents who had
used a credit card, parenting students were less likely to say they always pay their bill
on time, and less likely to say they pay o the full balance each month, compared to
non-parenting students.
Q56-61: Percent of respondents who indicated use
of public assistance, by assistance type
Medical Assistance
43%
18%
Utility Assistance
13%
3%
Childcare Assistance
10%
1%
Housing Assistance
8%
2%
Unemployment Assistance
3%
2%
Food Assistance
41%
11%
Parent
Not a Parent
ADDRESSING THE
FINANCIAL CHALLENGES
OF PARENTING STUDENTS
CAN HELP INSTITUTIONS
IMPROVE THEIR STUDENT
SUCCESS RATES.

www.trelliscompany.org 19
• Higher percentages of student parents reported experiencing nearly all of the key
distress indicators compared to non-student parents. Respondents with children
were particularly likely to report diculty finding $500 in an emergency, running out
of money, selling belongings, or experiencing housing insecurity.
100
69%
81%
Agree/Strongly Agree
20%
9%
Disagree/Strongly Disagree
Q66: I always pay my credit card bill on time.*
(of those who borrowed on a credit card)
Parent
Not a Parent
*Responses indicating 'Neutral' are not shown
20%
47%
Agree/Strongly Agree
69%
38%
Disagree/Strongly Disagree
Q67: I fully pay o my credit card balance each month.*
(of those who borrowed on a credit card)
Parent
Not a Parent
*Responses indicating 'Neutral' are not shown
Indicator
All Undergrad
Respondents Student Parents Not Student Parents
Experienced Financial Diculty While Enrolled 73% 81% 71%
Would Have Trouble Finding $500 in Emergency 57% 69% 54%
Wouldn’t Be Able to Find $500 in Emergency
(from any resource)
15% 26% 12%
Ran Out of Money 8 or More Times 20% 33% 16%
Sold Belongings to Make Ends Meet 37% 48% 34%
Indicated Major Depressive Disorder 36% 30% 37%
Indicated Generalized Anxiety Disorder 46% 41% 48%
Experienced Very Low Food Security 23% 27% 22%
Experienced Housing Insecurity 44% 61% 39%
Experienced Homelessness 15% 18% 14%

www.trelliscompany.org20
Paying For College
Self-help has become a foundational element of higher education financing, but it is
rarely sucient. Through their personal savings and current employment, students
invest heavily in their own education, but typically must access other sources of financial
support from family, government programs, and through credit. Students rely on an array
of sources that can dierently influence their ability to concentrate on academics. The
need to accumulate numerous sources of aid—in particular, government programs—can
also create information barriers to college, as students attempt to navigate programs that
have their own set of eligibility rules, application processes, and program terms. Within
this context, the importance of completing a FAFSA is key as it can unlock resources for
which the student may be eligible. Reliance on certain types of aid, such as grants, loans,
and emergency aid can alter the prevalence of financial distress indicators as can the lack
of family financial support.
FINDINGS
Q36: Did any of the following contribute to your decision
to not complete the FAFSA? Please check all that apply*
*Of those who said they did complete the FAFSA
I did not think I would be
eligible for financial aid
50%
I could aord to go to school
without financial aid
22%
I did not want the possibility
of taking on debt
20%
The application form(s) were too much
work or too time-consuming
14%
I did not have enough information
about how to apply for financial aid
15%
I did not plan to continue my
degree/program
2%
Other reason(s) 36%
STUDENTS RELY ON AN
ARRAY OF SOURCES
THAT CAN DIFFERENTLY
INFLUENCE THEIR ABILITY
TO CONCENTRATE ON
ACADEMICS.
Q35: Did you receive any help in completing the FAFSA?
Check all that apply.*
I completed the FAFSA on my own
68%
75%
Another family member
4%
5%
Another on-campus oce
or resource
2%
3%
Other
8%
10%
University or college
financial aid oce
5%
7%
Community organization or college
access program (e.g. TRiO,
College Forward, etc.)
1%
2%
Parents
46%
30%
4-year Schools
2-year Schools
*Of those who said they did complete the FAFSA
• Most respondents had completed the Free Application for Federal Student Aid
(FAFSA). Eighty-one percent of respondents reported completing it while 16 percent
said they did not complete it and three percent were unsure.

www.trelliscompany.org 21
• Four-year respondents were more likely
to report that their parents completed
the FAFSA for them compared to
two-year respondents.
• Among all respondents who did not
complete the FAFSA, common reasons
included perceived ineligibility, not wanting
to take on debt, or a belief they could aord
school without financial aid. (Q34-36)
• While self-help is a common source of
funding to pay for college, it rarely is
enough; few students today can pay their
way through college using just their savings
and income. Only two percent of four-year
respondents and five percent of two-year
respondents reported using only current
income and/or personal savings to pay for
college. (Q24-32)
• Seventy-five percent of respondents
reported using grants, scholarships, student
loans, and/or parent loans to pay for school.
Forty-four percent of respondents who
reported using grants to pay for school
also reported borrowing student loans. In
fact, those using grants to pay for school
were more likely to borrow student loans
compared to those who did not use grants.
(Q24-25, Q27-28)
• Thirty-seven percent of respondents had
some form of family support to pay for
college, though it varied by dierent student
characteristics. (Q26)
Q24-32: Do you use any of the following methods to pay for college?
Respondents who answered 'Yes'
Self-Help
Personal savings
Current employment
60%
61%
61%
52%
Family Support
Support from my
parents and/or family
49%
32%
Student loan(s) my
parents took out
18%
4%
Grants
Pell Grants and/or
other grants
55%
59%
Scholarships
63%
38%
Military or
veteran benefits
7%
5%
Credit cards
Credit
Student loan(s) I have
taken out for myself
48%
26%
29%
30%
Student loan(s) my
parents took out
18%
4%
4-year Schools
2-year Schools

www.trelliscompany.org22
Percent of respondents who reporting having family support
to pay for college, by student characteristic
Average:
37%
Black
Hispanic
White
29%
36%
39%
Parent
Not a Parent
20%
49%
First Generation
Not First Generation
First Generation Status
32%
47%
Race/Ethnicity
Parent Status
Indicator
All Undergrad
Respondents Had Grant
Had Student
Loan
No Family
Support
Received
Emergency
Aid
Experienced Financial Diculty
While Enrolled
73% 79% 88% 75% 84%
Would Have Trouble Finding $500
in Emergency
57% 66% 70% 60% 66%
Wouldn’t Be Able to Find $500
in Emergency (from any resource)
15% 20% 21% 18% 18%
Ran Out of Money 8 or More Times 20% 24% 28% 22% 24%
Sold Belongings to Make Ends Meet 37% 42% 46% 39% 44%
Indicated Major Depressive Disorder 36% 37% 38% 35% 36%
Indicated Generalized Anxiety Disorder 46% 48% 50% 46% 47%
Experienced Very Low Food Security 23% 27% 32% 25% 28%
Experienced Housing Insecurity 44% 51% 57% 49% 54%
Experienced Homelessness 15% 17% 19% 17% 18%
• While somewhat higher percentages of respondents who used grants to pay for
school and those who received emergency aid from their institution had experienced
key distress indicators compared to all respondents, those who had borrowed
student loans reported even higher rates of distress.

www.trelliscompany.org 23
Student Credit Card Use
and Risky Borrowing
Postsecondary education is a personal investment that students make towards their career
and life ambitions. Because the financial returns on this investment can take years to
materialize, many turn to various forms of credit to spread out the payments over time.
But whereas educational loans typically are subsidized and come with various consumer
protections, other forms of credit like credit cards, auto title loans, and payday loans do
not. While students may use these riskier forms of credit out of a lack of awareness of
these risks, it’s more likely they have fewer alternatives to make ends meet. This section
documents the use of credit cards, auto title loans, and payday loans and how their use
is associated with indicators of financial distress.
FINDINGS
• Credit card use was much more common among students compared to pay day
loans and auto title loans. However, while 77 percent of respondents who used a
credit card in the past year reported paying their bill on time, 47 percent failed to pay
their full balance each month, accruing interest at potentially high rates. (Q62-64,
Q66-67)
0
10
20
30
40
50
60
53%
Credit Card
6%
Pay Day Loan
6%
Auto Title Loan
Q62-64: Since January 1, 2022, have you
used the following borrowing sources?
Respondents who answered 'Yes'
*Responses indicating 'Neutral' are not shown
0
10
20
30
40
50
60
70
80
77%
Agree/
Strongly Agree
12%
Disagree/
Strongly Disagree
Q66: I always pay my credit card bill on time.*
(of those who borrowed on a credit card)
*Responses indicating 'Neutral' are not shown
0
10
20
30
40
50
60
70
80
39%
Agree/
Strongly Agree
47%
Disagree/
Strongly Disagree
Q67: I fully pay o my credit card balance each month.*
(of those who borrowed on a credit card)
CREDIT CARD USE WAS
MUCH MORE COMMON
AMONG STUDENTS
COMPARED TO PAY DAY
LOANS AND AUTO
TITLE LOANS.

www.trelliscompany.org24
• Respondents from four-year schools, white respondents, and non-first-generation
respondents were more likely to report that they fully pay o their credit card balance
each month, compared to their peers.
• Respondents who had used a credit card did not dier much on key distress
indicators from all respondents overall. However, those who had borrowed auto
title loans and payday loans reported experiencing key distress indicators at higher
rates compared to all respondents. More than three-quarters of respondents who
had borrowed a payday loan said they had experienced financial diculties while
enrolled, would have trouble finding $500 in an emergency, and had experienced
housing insecurity.
Percent of respondents who report fully paying o
their credit card balance each month
Average:
39%
Black
Hispanic
White
37%
24%
43%
Four-year Schools
Two-year Schools
45%
35%
First Generation
Not First Generation
First Generation Status
31%
44%
Race/Ethnicity
School Sector

www.trelliscompany.org 25
Indicator
All Undergrad
Respondents
Used Credit
Card
Borrowed
Auto Title
Loan
Borrowed
Payday Loan
Experienced Financial Diculty While Enrolled 73% 78% 85% 92%
Would Have Trouble Finding $500 in Emergency 57% 58% 69% 86%
Wouldn’t Be Able to Find $500 in Emergency
(from any resource)
15% 14% 20% 33%
Ran Out of Money 8 or More Times 20% 21% 31% 51%
Sold Belongings to Make Ends Meet 37% 40% 53% 64%
Indicated Major Depressive Disorder 36% 35% 40% 42%
Indicated Generalized Anxiety Disorder 46% 47% 51% 53%
Experienced Very Low Food Security 23% 24% 35% 46%
Experienced Housing Insecurity 44% 50% 63% 80%
Experienced Homelessness 15% 15% 23% 27%

www.trelliscompany.org26
Financial Behavior,
Knowledge, and
Decision-Making
For many students, navigating the information barriers of college financing can be
confusing with its foreign terminology, complex legal documents, and daunting
implications. Students often confront these obstacles with underdeveloped financial
knowledge and limited experience. The decisions they make while in college help
form lasting financial behaviors. Trellis introduced a question about students’ perceived
return on investment which we analyze by dierent categories of students such as
attitudes about student debt, parental status, and school sector.
FINDINGS
• Many students reported positive financial behaviors. Seventy percent said they always
paid their bills on time and 48 percent followed a weekly or monthly budget. Those
who reported following a budget were more likely to say they pay their bills on time.
(Q46-47)
• Students who know where to find advice on financial decisions were more likely
to have confidence in their ability to manage their finances. Seventy percent of
respondents who said they have the ability to manage their finances said they knew
where to find the financial advice they need, compared to 39 percent who said they
don’t have the ability to manage their finances. (Q48, Q55)
STUDENTS WHO
KNOW WHERE TO FIND
ADVICE ON FINANCIAL
DECISIONS WERE
MORE LIKELY TO HAVE
CONFIDENCE IN THEIR
ABILITY TO MANAGE
THEIR FINANCES.
0
10
20
30
40
50
44%
Financial Aid
Advisor
Academic
Advisor
38%
23%
Faculty
Member
15%
Other
Sta
37%
I Have Not Spoken
With Any of These
Individuals
Q12-16: During my time at school, I have spoken with the following
individuals about my financial struggles. (Check all that apply)*
*Percentage indicate respondents who chose at least one of the above choices
79%
9%
Follows Budget
62%
21%
No Budget
Q46: Always pay their bills on time by Budget Status*
Agree/Strongly Agree Disagree/Strongly Disagree
*Responses indicating 'Neutral' are not shown
70%
39%
Agree/Strongly Agree
9%
35%
Disagree/Strongly Disagree
Q48: Ability to manage finances well*
Know Where to Find Don’t know Where
*Responses indicating 'Neutral' are not shown

www.trelliscompany.org 27
• Sixty percent of students said they would
seek financial support services, like financial
coaching, if oered by their institution.
While 37 percent of students had not
spoken with anyone at their institution
about their financial struggles, those who
did were most likely to speak with financial
aid advisors. However, many students
sought advice from ocials who were not
experts in financial aid programs, such as
academic advisors, faculty members, or
student aairs sta. (Q6, Q12-16)
• Black and Hispanic students were more
likely to say they would use financial
services oered by their institution
compared to white students. (Q6)
• Overall, 70 percent of respondents said
they believed the cost of college was a
good investment for their financial future.
However, some students were more likely
to believe this than others. Student loan
borrowers who said they did not have more
debt than they expected, were confident
about their ability to repay their loans,
and were confident about a future loan
forgiveness were more likely to agree that
college was a good investment. Additionally,
parenting students, students who felt their
school was aware of their financial situation,
students who were not worried about
paying for school, and community college
students were more likely to agree that
college was a good investment. (Q53)
• Respondents who disagreed or strongly
disagreed that they always pay their bills on
time reported experiencing all key distress
indicators at higher rates compared to all
undergraduate respondents.
Hispanic
73%
9%
Black
64%
11%
54%
17%
White
Q6: Students that would use professional financial support
services if oered by their school, by Race/Ethnicity*
Agree/Strongly Agree Disagree/Strongly Disagree
*Responses indicating 'Neutral' are not shown
Percent of respondents who agree or strongly agree the cost
of college is a good investment for their financial future
Aware
Not Aware
75%
66%
Average:
70%
Confident or Very Confident
Less Than Confident
Confidence About
Ability to Repay Loans
82%
64%
Not More Than Expected
More Than Expected
78%
66%
School Awareness of
Students’ Financial Situation
Worry About Paying
for School
Worry
No Worry
70%
77%
Have More Student Loan
Debt Than Expected
Confidence About Future
Loan Forgiveness
Confident or Very Confident
Less Than Confident
75%
68%
School Sector
Four-year Schools
Two-year Schools
66%
74%
Parenting Status
Parent
Not a Parent
79%
68%

www.trelliscompany.org28
Indicator
All Undergrad
Respondents
Financial
Knowledge
Scale – Zero
Correct
Financial
Knowledge
Scale – All
Correct
Doesn’t
Follow a
Budget
Doesn’t Pay
Bills on Time
Experienced Financial Diculty
While Enrolled
73%
68% 74% 76% 91%
Would Have Trouble Finding $500
in Emergency
57%
59% 52% 60% 85%
Wouldn’t Be Able to Find $500
in Emergency (from any resource)
15%
19% 11% 16% 36%
Ran Out of Money 8 or More Times 20%
21% 17% 23% 50%
Sold Belongings to Make Ends Meet 37%
36% 34% 35% 60%
Indicated Major Depressive Disorder 36%
39% 33% 40% 45%
Indicated Generalized Anxiety Disorder 46% 48%
43% 51% 56%
Experienced Very Low Food Security 23%
22% 21% 23% 44%
Experienced Housing Insecurity 44%
39% 45% 46% 79%
Experienced Homelessness 15%
12% 15% 14% 28%

www.trelliscompany.org 29
Research to Practice
The responses contained in this report provide deep insights into the financial lives of our students and can inform
campus policy, procedures, and programs. Based on the responses, Trellis has identified a few areas of focus for campus
leaders that are looking to address issues related to student financial wellness.
COST OF ATTENDANCE
Tuition and direct fees have received substantial attention over the past decade by Boards and campus
leadership as individuals look to slow the growth in the cost of college. Given the recent inflationary economic
climate and the large increases in costs for basic needs, students are feeling increased financial pressure.
Campus Change:
Campuses can conduct an extensive review of their cost of attendance and utilize numerous data sources
to present an accurate picture of current indirect costs.
INTEGRATED SUPPORT
Institutions are continuing to add student facing supports that address numerous barriers to student basic
needs and student success. Services like counseling support, benefit navigators, and rent assistance programs
all provide key and necessary services to students. All of these challenges are linked, and campuses will
benefit from finding unique connection points to provide various services to students including integrating
local social service agencies.
Campus Change:
Institutions should actively seek out partnerships with social service organizations that are providing basic
needs supports to individuals. This includes organizations like Head Start, WIC, Transit Agencies, and
regional food bank providers. Deepening these relationships will allow for better supporting students.
EMERGENCY FUNDING
The absence of federal funding has left a large void in the emergency funding landscape. Survey responses
show that many students face substantial barriers to access money in the case of an emergency, which can
result in derailing their educational experience.
Campus Change:
As we transition out of an environment of federal support for emergency aid, institutions can prioritize
fundraising for emergency aid programs and reallocate financial aid strategies to include reactive support
funding. Additionally, institutions can look to structure match savings programs that work to assist
students in developing an emergency fund similar to this work at Austin Community College.
PARENTING STUDENTS
Students that are parents are dicult to identify on campus but continue to make up a large percentage
of student bodies, especially at two-year institutions. These students face significant constraints related to
their time and finances as they purse their education. As childcare costs rise, these financial challenges will
continue to grow, making student success more dicult.
Campus Change:
Campuses are encouraged to appoint a student parent liaison that can assist with helping student parents
move through the institution. This individual can also be charged with the development of parent-friendly
policies and programs including childcare, course scheduling times, priority scheduling for student
parents, and creating communities to enhance a sense of belonging.

www.trelliscompany.org30
CREDIT CARD USAGE
While student loans dominate popular discussions about college financing, responses from students show
continued heavy use of credit cards to fund elements of their educational experience, especially indirect
costs. Campuses can provide on-going education related to credit cards and can continue to strengthen
student financial competency.
Campus Change:
Given the precarious funding structures that many students experience, campuses are encouraged to
make financial aid awards that provide as much clarity as possible over the life of the degree program.
Campuses are encouraged to review any awards that are declining in the amount over the student’s
enrollment on campus and to review eligibility requirements to promote continued enrollment.
WORKERS WHO ATTEND SCHOOL
One interesting finding is that those that are attending school while working often identify as an employee
first, and a student second. Given their dependency on current earnings, this has implications for how
institutions understand and promote student engagement.
Campus Change:
Campuses have an opportunity to work directly with area employers to more conveniently schedule
courses, provide seamless tuition reimbursement, and explore options for tuition subsidy programs
that assist with workforce development. Additionally, campuses should design policy, procedures, and
programs to support the whole person, recognizing that for many, the identity of student is secondary to
that of employee. This work includes developing explicit personas to better understand student barriers
to completion, including an appreciation of the whole cost of education which encompasses direct costs
(i.e., tuition and fees), indirect costs (i.e., room, board, transportation, supplies, technology), as well as
opportunity costs associated with forgoing full-time employment.
MULTIPLE SOURCES OF FUNDING
Survey responses continue to highlight that students piece together numerous funding sources to pay for
their postsecondary experience. Diversification, in this sense, injects additional risk with the loss of one
funding source potentially creating a significant barrier to continued enrollment.
Campus Change:
Given the precarious funding structures that many students experience, campuses are encouraged to
make financial aid awards that provide as much clarity as possible over the life of the degree program.
Campuses are encouraged to review any awards that are declining in the amount over the student’s
enrollment on campus and to review eligibility requirements to promote continued enrollment.

www.trelliscompany.org 31
Conclusion
College is a time of intense learning that can shape a person’s trajectory in the world.
Student financial wellness can impact this pathway in important ways. This report
documents how a broad cross section of students pays for college and how their
finances influence their ability to succeed. This edition of the SFWS explores how
students’ finances aect concentration on academics whether through pervasive
anxiety, worry about debt accumulation, missed classes due to transportation or
daycare issues, or securing one’s basic needs.
Research confirms the ecacy of student supports that reduce financial and information
barriers to student success, showing that these eorts improve not only academic
outcomes but even post-college earnings.
9
This study shows that students internally sense
this same connection, reporting higher expected return on investment from college when
their finances are secure and their institution understands their financial challenges. Trellis
identified key indicators of financial distress and used these indicators as a lens through
which to view how students pay for college, navigate parenthood as a student, rely on
credit, and develop financial behaviors and aptitudes.
Trellis views these findings as the first step in promoting student success. The deep
understanding that comes from this survey has helped colleges from across the country
develop initiatives to address the most destabilizing aspects of financial insecurity. This
report shares some of these promising practices. Trellis is committed to furthering this
iterative process of research and programmatic change as we help institutions grow
individual economic mobility and expand community prosperity.
THE DEEP
UNDERSTANDING
THAT COMES FROM
THIS SURVEY HAS
HELPED COLLEGES
FROM ACROSS THE
COUNTRY DEVELOP
INITIATIVES TO
ADDRESS THE MOST
DESTABILIZING
ASPECTS OF
FINANCIAL
INSECURITY.

www.trelliscompany.org32
Appendix A: Detailed Methodology
and Sample Characteristics
Participating Institutions in the Fall 2022 SFWS
The fall 2022 implementation of the SFWS captures the attitudes, perspectives, and self-reported financial behaviors of
more than 36,000 students from 89 colleges and universities in 23 states. While not nationally representative, student
respondents attended public universities, private colleges, and community colleges that range in size from nearly 70,000
students to fewer than 650. Student responses from all institutions were aggregated to provide a comparison group for
individual institutional findings by school sector.
Four-Year Public Institutions (18)
Angelo State University (TX)
Grambling State University (LA)
Mississippi Valley State University (MS)
Salisbury University (MD)
Sam Houston State University (TX)
Southern University and A&M College (LA)
State University of New York Oneonta (NY)
Sul Ross State University (TX)
Tarleton State University (TX)
Texas A&M University – Kingsville (TX)
Texas State University (TX)
University of Oklahoma (OK)
University of South Alabama (AL)
University of Texas at El Paso (TX)
University of Utah (UT)
University of West Alabama (AL)
University of Wyoming (WY)
Western Kentucky University (KY)
Four-Year Private Institutions (10)
Belmont University (TN)
College of Saint Mary (NE)
Herzing University (WI)
Houston Christian University (TX)
Lubbock Christian University (TX)
Midway University (KY)
Newberry College (SC)
Peirce College (PA)
St. Mary’s University (TX)
Vaughn College of Aeronautics and Technology (NY)

www.trelliscompany.org 33
Two-Year Institutions (61)
Allan Hancock College (CA)
Amarillo College (TX)
Asheville-Buncombe Technical Community College (NC)
Ashland Community and Technical College (KY)
Atlanta Metropolitan State College (GA)
Atlanta Technical College (GA)
Big Sandy Community and Technical College (KY)
Bluegrass Community and Technical College (KY)
Cape Fear Community College (NC)
Carteret Community College (NC)
Catawba Valley Community College (NC)
Central Carolina Community College (NC)
Central Piedmont Community College (NC)
College of the Albemarle (NC)
Dallas College (TX)
Davidson-Davie Community College (NC)
Delgado Community College (LA)
Elizabethtown Community and Technical College (KY)
Fayetteville Technical Community College (NC)
Gateway Community and Technical College (KY)
Grayson College (TX)
Haywood Community College (NC)
Hazard Community and Technical College (KY)
Henderson Community College (KY)
Hill College (TX)
Hopkinsville Community College (KY)
Howard College (TX)
Jeerson Community and Technical College (KY)
Lake Michigan College (MI)
Macomb Community College (MI)
Madisonville Community College (KY)
Martin Community College (NC)
Maysville Community and Technical College (KY)
McDowell Technical Community College (NC)
McLennan Community College (TX)
Monroe County Community College (MI)
Muskegon Community College (MI)
Navarro College (TX)
North Central Michigan College (MI)
Northeast Lakeview College (TX)
Northwest Vista College (TX)
Oakland Community College (MI)
Owensboro Community and Technical College (KY)
Palo Alto College (TX)
Panola College (TX)
Randolph Community College (NC)
Ranger College (TX)
Roanoke-Chowan Community College (NC)
Sandhills Community College (NC)
Seminole State College of Florida (FL)
Somerset Community College (KY)
Southcentral Kentucky Community and
Technical College (KY)
Southeast Kentucky Community and Technical College (KY)
Southern Maine Community College (ME)
Southwestern Oregon Community College (OR)
St. Philip’s College (TX)
Temple College (TX)
Tyler Junior College (TX)
Wayne Community College (NC)
West Kentucky Community and Technical College (KY)
Yakima Valley College (WA)

www.trelliscompany.org34
Methodology
The SFWS seeks to document the financial well-being and student success outcomes
of post-secondary students across the nation. Trellis hosted and delivered the online
survey in an attempt to understand more about the financial challenges and barriers
facing students, how students view their institutions’ awareness of those challenges
and barriers, and how the challenges and barriers alter how students view and attend
college. All participating institutions receive a school-level report of findings with
comparison response groups from their sector.
In order to host and deliver the survey to students, participating institutions provide
Trellis with the contact information and select demographics (to allow assessment of
representativeness) of study participants. Participants in the SFWS are asked to consent
to having additional select student-level records (e.g., number of credit hours, gender,
age) released by their institution for matching with their survey responses. Participating
institutions with enrollments above 10,000 students could choose to randomly sample
5,000 of their students or provide their entire population. Institutions with enrollments
lower than 10,000 included all students in the survey population.
To maximize student responses, Trellis contributed 50, $50 Amazon gift cards which were
randomly awarded to 50 study participants. Institutions were encouraged to supplement
the survey-wide incentive oered by Trellis with their own incentives where possible.
For survey-wide incentives provided by Trellis, Trellis randomly chose incentive winners,
contacted the incentive winners, and disbursed the incentives. For institutional incentives,
Trellis randomly chose incentive winners and provided institutions with contact
information to disburse the incentives. If a participant withdrew from the
survey before completion, they were still eligible for the incentive drawing.
Data were de-identified to create a dataset for analysis. In most instances, reports
primarily consist of descriptive statistics; however, additional exploratory data analysis
was conducted to identify trends among groups of respondents and answer the research
questions. Analyses conducted include chi-square tests and reliability tests to construct
and validate indexes contained within the survey instrument. All data are reported in
aggregate form only and reported data do not identify individual institutions outside of
confidential institution-level reports.
Sample Characteristics and Representativeness
Voluntary surveys—particularly those delivered online—are unlikely to achieve high
response rates. Lower response rates make surveys more susceptible to response bias,
i.e., the risk that those taking the survey don’t reflect the views of the total population.
The Student Financial Wellness Survey obtains data on both the total population and
responders. This allows for comparisons to determine if, based on these characteristics,
responders mirror the total population. The results are weighted using a post-stratification
weighting technique. Two-year institutions and four-year institutions were separately
weighted by gender, age, and enrollment intensity. Response bias in the sample
marginally aected the magnitude of the response frequencies presented for questions
in the survey but did not aect the overall findings and themes found from the study.
The tables in this appendix provide a comparison between the population of students
invited to participate and the sample of responders, and they present where there were
statistically significant dierences.

www.trelliscompany.org 35
Patterns of response were analyzed at the aggregate level in order to determine if
low quality responses (i.e., response patterns that indicate a lack of attention) were
skewing the data. On average, respondents chose a neutral response 17 percent of the
time where neutral was an option. The nature of the questions asked by the Student
Financial Wellness Survey result in neutral being a valid response in each case it was
made available. Additionally, many of the survey items with neutral response options
are part of indices or grouped questions for which consistent patterns of response
would be expected. Given the minimal impact and the potential of suppressing valid
responses, these responses were retained.
TESTS FOR REPRESENTATION BY STUDENT CHARACTERISTIC, UNWEIGHTED
All Undergraduates
Relationships between variables were tested for association using Pearson’s Chi-Square tests.
Race/Ethnicity
Statistical dierences between the population and sample (**Statistically significant result at
the p<.01 level). Hispanic students are overrepresented in the sample by a magnitude of one
percentage point and Black students are underrepresented in the sample by a magnitude of
one percentage point.
Gender
Statistical dierences between the population and sample (**Statistically significant result
at the p<.01 level). Female students are overrepresented in the sample by a magnitude of
16 percentage points.
Enrollment Intensity
(Full-time, Part-time)
Statistical dierences between the population and sample (**Statistically significant result
at the p<.01 level). Students enrolled full-time were overrepresented in the sample by a
magnitude of seven percentage points.
Credit Hours Earned
(Class Year)
No statistical dierences were observed between the population and sample.
Age
Statistical dierences between the population and sample (**Statistically significant
result at the p<.01 level). The average age of the sample is almost one year older than
the population.
GPA
Statistical dierences between the population and sample (**Statistically significant result
at the p<.01 level). The average GPA of the sample is 0.1 points higher than the population.
SURVEY METRICS
Fall 2022 SFWS – Undergraduate Cohort
2-year Institutions 4-year Institutions
Survey Population 241,307 students 147,346 students
Responses 20,536 students 15,910 students
Response Rate 8.5% 10.8%
Completion Rate 78% 79%
Median Time Spent 14 minutes 13 minutes

www.trelliscompany.org36
SURVEY CHARACTERISTICS FALL 2022 SFWS
Characteristic
Population
(N=388,653)
Respondents
(n=36,446)
Race/Ethnicity
American Indian/Alaskan Native 1% 1%
Asian, Hawaiian, or Other Pacific Islander 3% 4%
Black/African-American 17% 16%
Hispanic/Latinx 17% 18%
International 1% 1%
White 47% 47%
Multiple 3% 4%
Other 0% 0%
Race/Ethnicity Not Reported 11% 10%
Gender
Female 60% 76%
Male 39% 23%
Self-Identify/Not Reported 1% 1%
Enrollment Intensity
Full-time 55% 62%
Part-time 44% 38%
Class Year
1st (<30 credits earned) 47% 47%
2nd (30-59 credits earned) 24% 25%
3rd (60-89 credits earned) 15% 15%
4th (90-120 credits earned) 8% 9%
5th (120+ credits earned) 4% 4%
Age
Average Age 24.6 25.5
GPA
Average GPA 2.9 3.0
Scales: Net Promoter Score (Q22)
Trellis’ Student Financial Wellness Survey includes a customer satisfaction rating for
institutions to benchmark future work and to better understand how students perceive
their institution. Trellis collected the information with a scale that allows a Net Promoter
Score (NPS) to be calculated. NPS is a method, based in research, to benchmark customer
satisfaction ratings across dierent services, businesses, and products.
10
NPS uses a 0-10
scale. Those respondents who score 9-10 are promoters, 7-8 are passives, and 0-6 are
detractors. %Promoters - %Detractors = NPS. A positive NPS (>0) is generally considered
good, with highest performers usually between 50 and 80.

www.trelliscompany.org 37
Scales: United States Department of Agriculture (USDA) 30-Day Food Security
(Q84-89)
Trellis’ Student Financial Wellness Survey uses a six-question scale designed by the
United States Department of Agricultures (USDA) that measures food security within
the prior 30 days.
11
Many researchers of food security amongst college students use a
more robust twelve-question USDA scale. The six-question scale was chosen to reduce
cognitive overload within a survey that seeks to measure many financial wellness topics
in other ways.
Things to know about food insecurity:
• USDA methodology assigns levels of food security to individuals based on
how many armative responses they give to certain questions. Under the
short-form survey, individuals who give 2-4 armative responses have
“low food security” and individuals who give 5-6 armative responses
have “very low food security.”
12
• While categorical labels are helpful, food insecurity exists on a spectrum,
and even the underlying responses to the survey questions cannot definitively
locate individuals on that spectrum. Rather, more armative responses indicate
higher odds that an individual is experiencing greater diculty maintaining an
adequate diet.
Scales: Housing Security (Q93-98) and Homelessness (Q99-108)
The Student Financial Wellness Survey incorporates standard housing security and
homelessness measurements commonly used by other researchers studying basic
needs security in order to ensure data validity and facilitate comparisons with findings
in prior research.
13
Things to know about housing security and homelessness:
• Leading researchers in this field define a homeless person as “a person without
a place to live, often residing in a shelter, an automobile, an abandoned building
or outside,” and housing insecurity as, “broader set[s] of challenges such as the
inability to pay rent or utilities or the need to move frequently.”
14
• Respondents are categorized as ‘Housing Insecure’ if they answered “True”
to any of the six housing insecurity questions (Q83-88).
• Respondents are categorized as ‘Homeless’ if they answered ‘Yes’ and/or
‘True’ to any of the ten homelessness questions (Q89-98).
Scales: Financial Knowledge (Q112-114)
The financial knowledge scale used in this survey is a version of the Lusardi three-question
scale, augmented to be more relevant to students in higher education.
15
Respondents
who provided an answer for all items on the financial knowledge scale were included for
analysis. Correct answers for each question are totaled for the scale value.

www.trelliscompany.org38
Scales: Patient Health Questionnaire-2 (Q80-81) and Generalized Anxiety
Disorder-2 (Q82-83)
To assess potential mental health challenges among respondents, two validated scales
were used—the Patient Health Questionnaire-2 (PHQ-2) and the Generalized Anxiety
Disorder 2-item (GAD-2).
Patient Health Questionnaire-2 (PHQ-2) (Q80-81)
This survey used a modified, short-form scale first used by the Centers for Disease
Control and Prevention (CDC) that measures the frequency of depressed mood and
the inability to feel pleasure over the past 14 days.
16
• The purpose of the PHQ-2 is to act as a screener for depression in a “first-step”
approach. Respondents are asked: Over the last 14 days, how often have you
been bothered by…
• Having little interest or pleasure in doing things?
• Feeling down, depressed, or hopeless?
• The scale includes the following answer options: “Not at all” (score of 0); “Several
days” (score of 1); “More than half the days” (score of 2); and “Nearly every day”
(score of 3).
• A PHQ-2 score ranges from 0-6, with a score of 3 acting as the optimal cutpoint
when screening for depression. If a respondent scores 3 or greater, a diagnosis of
major depressive disorder is likely.
17
Generalized Anxiety Disorder 2-item Scale (GAD-2) (Q82-83)
This survey also incorporates a modified, short-form instrument used to screen for
generalized anxiety disorder (GAD) by the CDC.
18
• Similar to the PHQ-2, respondents are asked: Over the last 14 days, how often
have you been bothered by…
• Feeling nervous, anxious or on edge?
• Not being able to stop or control worrying?
• The scale includes the following options: “Not at all” (score of 0); “Several days”
(score of 1); “More than half the days” (score of 2); and “Nearly every day” (score
of 3).
• A GAD-2 score ranges from 0-6, with a score of 3 acting as the optimal cutpoint
when screening for generalized anxiety disorder. If a respondent scores 3 or
greater, a diagnosis of generalized anxiety disorder is likely. Using this cut-o
of 3 points, the GAD-2 has a sensitivity of 86% and specificity of 83%.
19
www.trelliscompany.org 39
Appendix B: Survey Questions
and Responses
Values presented are rounded, therefore the sum of response frequencies may not equal 100 percent.
Q1: While in college, have you experienced financial diculties
or challenges?
4-year Schools 2-year Schools
Yes 76% 70%
No 20% 26%
I Don’t Know 4% 4%
n=15803 n=20529
Q2: My school has the support services to help me address my
financial situation.
4-year Schools 2-year Schools
Strongly Agree 11% 20%
Agree 41% 42%
Neutral 30% 27%
Disagree 14% 7%
Strongly Disagree 5% 4%
n=14978 n=19440
Q3: My school is aware of the financial challenges I face.*
4-year Schools 2-year Schools
Strongly Agree 6% 7%
Agree 22% 21%
Neutral 27% 29%
Disagree 32% 29%
Strongly Disagree 14% 13%
n=11386 n=13637
*Of respondents who answered ‘yes’ to Q1
Q4: I have diculty concentrating on my schoolwork because of my
financial situation.*
4-year Schools 2-year Schools
Strongly Agree 14% 14%
Agree 34% 34%
Neutral 24% 25%
Disagree 22% 21%
Strongly Disagree 6% 6%
n=11395 n=13645
*Of respondents who answered ‘yes’ to Q1
Q5: The faculty at my school understand my financial situation.
4-year Schools 2-year Schools
Strongly Agree 6% 10%
Agree 21% 24%
Neutral 37% 39%
Disagree 25% 19%
Strongly Disagree 10% 9%
n=14964 n=19400
Q6: I would use financial support services (such as one-on-one coaching
from a trained expert) if oered by my school.
4-year Schools 2-year Schools
Strongly Agree 18% 21%
Agree 41% 41%
Neutral 25% 26%
Disagree 12% 9%
Strongly Disagree 4% 3%
n=14966 n=19404
Q7: Tuition - To what extent do you agree or disagree that your school
makes the following items more aordable?
4-year Schools 2-year Schools
Strongly Agree 11% 26%
Agree 30% 46%
Neutral 20% 16%
Disagree 24% 8%
Strongly Disagree 15% 3%
n=14732 n=18902
Q8: Housing - To what extent do you agree or disagree that your school
makes the following items more aordable?
4-year Schools 2-year Schools
Strongly Agree 5% 6%
Agree 15% 12%
Neutral 39% 64%
Disagree 26% 11%
Strongly Disagree 16% 7%
n=14693 n=18831

www.trelliscompany.org40
Q9: Food - To what extent do you agree or disagree that your school
makes the following items more aordable?
4-year Schools 2-year Schools
Strongly Agree 6% 10%
Agree 24% 26%
Neutral 36% 49%
Disagree 22% 11%
Strongly Disagree 12% 5%
n=14695 n=18847
Q10: Transportation - To what extent do you agree or disagree that your
school makes the following items more aordable?
4-year Schools 2-year Schools
Strongly Agree 15% 10%
Agree 28% 21%
Neutral 38% 54%
Disagree 11% 10%
Strongly Disagree 8% 5%
n=14690 n=18835
Q11: Textbooks - To what extent do you agree or disagree that your school
makes the following items more aordable?
4-year Schools 2-year Schools
Strongly Agree 8% 16%
Agree 23% 32%
Neutral 22% 19%
Disagree 28% 23%
Strongly Disagree 18% 11%
n=14721 n=18879
Q12-Q16: During my time at school, I have spoken with the following
individuals about my financial struggles. (Check all that apply)*
4-year Schools 2-year Schools
Financial Aid Advisor 42% 45%
Academic Advisor 38% 38%
Faculty Member 24% 22%
Other Sta 15% 16%
I Have Not Spoken With Any of
These Individuals 38% 37%
*Percentage indicate respondents who chose at least one of the above choices
Q17: My Parents - I am comfortable discussing my financial situation with
the following people.
4-year Schools 2-year Schools
Strongly Agree 50% 40%
Agree 31% 33%
Neutral 7% 11%
Disagree 7% 9%
Strongly Disagree 5% 8%
n=14450 n=18351
Q18: Other Family - I am comfortable discussing my financial situation
with the following people.
4-year Schools 2-year Schools
Strongly Agree 16% 16%
Agree 33% 32%
Neutral 20% 21%
Disagree 20% 20%
Strongly Disagree 10% 11%
n=14354 n=18257
Q19: Friends - I am comfortable discussing my financial situation with the
following people.
4-year Schools 2-year Schools
Strongly Agree 16% 15%
Agree 40% 37%
Neutral 20% 21%
Disagree 17% 18%
Strongly Disagree 7% 9%
n=14382 n=18268
Q20: School Sta - I am comfortable discussing my financial situation with
the following people.
4-year Schools 2-year Schools
Strongly Agree 8% 11%
Agree 30% 34%
Neutral 30% 29%
Disagree 23% 18%
Strongly Disagree 9% 8%
n=14370 n=18289
www.trelliscompany.org 41
Q21: Faculty - I am comfortable discussing my financial situation with the
following people.
4-year Schools 2-year Schools
Strongly Agree 8% 11%
Agree 30% 33%
Neutral 29% 31%
Disagree 23% 18%
Strongly Disagree 10% 8%
n=14367 n=18262
Q22: How likely is it that you would recommend your school to a friend or
family member?
4-year Schools 2-year Schools
0 (Not at All Likely) 2% 1%
1 1% 0%
2 1% 0%
3 2% 1%
4 3% 1%
5 8% 5%
6 11% 6%
7 18% 13%
8 20% 19%
9 10% 12%
10 (Very Likely) 22% 39%
n=14367 n=18314
Q22: Net Promoter Score (NPS)* How likely is it that you would
recommend your school to a friend or family member?
4-year Schools 2-year Schools
Promoters (Score 9-10) 32% 52%
Passives (Score 7-8) 38% 33%
Detractors (Score 0-6) 29% 16%
Net Promoter Score (NPS)* 3.07 36.20
n=14,366 n=18,313
* A Net Promoter Score (NPS) is a research-based method to benchmark and compare
customer satisfaction ratings across dierent services, businesses, and products. NPS
uses a 0-10 scale. Those who score 9-10 are promoters, 7-8 are passives, and 0-6 are
detractors. %Promoters - %Detractors = NPS. A positive NPS (>0) is generally
considered good, with highest performers usually between 50 and 80.
Q23: Do you work for pay?
4-year Schools 2-year Schools
Yes 69% 70%
No 28% 26%
I don’t know 3% 4%
n=14196 n=18041
Q24: Student loan(s) I have taken out for myself - Do you use any of the
following methods to pay for college?
4-year Schools 2-year Schools
Yes 48% 26%
No 50% 71%
I don’t know 2% 3%
n=14100 n=17780
Q25: Student loan(s) my parents took out - Do you use any of the
following methods to pay for college?
4-year Schools 2-year Schools
Yes 18% 4%
No 78% 93%
I don’t know 4% 3%
n=13886 n=17609
Q26: Other support from my parents and/or family - Do you use any of the
following methods to pay for college?
4-year Schools 2-year Schools
Yes 49% 32%
No 48% 65%
I don’t know 2% 3%
n=13975 n=17675
Q27: Pell grant and/or other grants - Do you use any of the following
methods to pay for college?
4-year Schools 2-year Schools
Yes 55% 59%
No 41% 37%
I don’t know 4% 4%
n=14067 n=17936
Q28: Scholarships - Do you use any of the following methods to pay
for college?
4-year Schools 2-year Schools
Yes 63% 38%
No 34% 57%
I don’t know 3% 5%
n=14036 n=17756

www.trelliscompany.org42
Q29: Current income - Do you use any of the following methods to pay
for college?
4-year Schools 2-year Schools
Yes 60% 61%
No 37% 36%
I don’t know 3% 4%
n=14030 n=17813
Q30: Personal savings - Do you use any of the following methods to pay
for college?
4-year Schools 2-year Schools
Yes 61% 52%
No 37% 46%
I don’t know 2% 2%
n=14000 n=17711
Q31: Credit cards - Do you use any of the following methods to pay
for college?
4-year Schools 2-year Schools
Yes 29% 30%
No 68% 67%
I don’t know 3% 3%
n=13824 n=17618
Q32: Military or veteran benefits - Do you use any of the following
methods to pay for college?
4-year Schools 2-year Schools
Yes 7% 5%
No 91% 93%
I don’t know 2% 2%
n=13735 n=17500
Q33: Since January 1, 2022, have you received emergency aid from your
institution?
4-year Schools 2-year Schools
Yes 15% 18%
No 69% 63%
I don’t know 15% 19%
n=14212 n=18053
Q34: In the past 12 months, did you or someone on your behalf complete
the FAFSA (Free Application for Federal Student Aid)?
4-year Schools 2-year Schools
Yes 81% 81%
No 16% 16%
I don’t know 3% 3%
n=14061 n=17816
Q35: Did you receive any help in completing the FAFSA?
Check all that apply.*
4-year Schools 2-year Schools
I completed the FAFSA on my own 68% 75%
Parents 46% 30%
Another family member 4% 5%
University or college financial aid oce 5% 7%
Another on-campus oce or resource 2% 3%
Community organization or college access
program (e.g., TRiO, College Forward, etc.) 1% 2%
Other 8% 10%
n=15108 n=18982
*Of respondents who answered ‘yes’ to Q34
Q36: Did any of the following contribute to your decision to not complete
the FAFSA? Please check all that apply.*
4-year Schools 2-year Schools
The application form(s) were too much work or too time-consuming 15%
14%
I did not want the possibility of taking on debt 19% 21%
I did not have enough information about how to apply for financial aid 14%
15%
I could aord to go to school without financial aid 21% 23%
I did not think I would be eligible for financial aid 54% 48%
I did not plan to continue my degree/program 1% 2%
Other reason(s) 33% 39%
n=3332 n=4188
*Of respondents who answered ‘No’ to Q34
Q37: Are you a parent, primary caregiver, or legal guardian to any
children?
4-year Schools 2-year Schools
Yes 14% 27%
No 85% 72%
I don’t know 1% 1%
n=14002 n=17672

www.trelliscompany.org 43
Q38: Your spouse - Do you provide financial support for any of the
following individuals?
4-year Schools 2-year Schools
Yes 10% 15%
No 89% 84%
I don’t know 1% 1%
n=13838 n=17385
Q39: A child or children - Do you provide financial support for any of the
following individuals?
4-year Schools 2-year Schools
Yes 13% 26%
No 86% 73%
I don’t know 1% 1%
n=13851 n=17459
Q40: Your parent(s) or guardian(s) - Do you provide financial support for
any of the following individuals?
4-year Schools 2-year Schools
Yes 12% 14%
No 87% 84%
I don’t know 1% 2%
n=13825 n=17265
Q41: Other family members - Do you provide financial support for any of
the following individuals?
4-year Schools 2-year Schools
Yes 7% 11%
No 91% 88%
I don’t know 1% 1%
n=13783 n=17259
Q42: Would you have trouble getting $500 in cash or credit in order to
meet an unexpected need within the next month?
4-year Schools 2-year Schools
Yes 55% 58%
No 33% 29%
I don’t know 12% 13%
n=13940 n=17609
Q43: Imagine that you had to pay a $500 cost unexpectedly in the next
month. In this situation, which of the following resources would you
turn to first?
4-year Schools 2-year Schools
My savings 31% 28%
My parent(s) or other family member(s) 27% 18%
My friend(s) 0% 0%
A credit card 10% 11%
A loan 3% 3%
My school 1% 1%
Selling my possessions 5% 6%
Reducing my spending 5% 6%
Delaying paying a bill 5% 7%
Other 2% 2%
I would not be able to get $500 12% 17%
n=13890 n=17527
Q44: Since January 1, 2022, approximately how many times did you run
out of money?
4-year Schools 2-year Schools
Never 35% 30%
One time 9% 8%
Two Times 11% 10%
Three Times 10% 10%
Four Times 8% 8%
Five Times 6% 7%
Six Times 3% 4%
Seven Times 1% 1%
Eight or More Times 17% 22%
n=13830 n=17460
Q45: Since January 1, 2022, approximately how many times did you
borrow money from your family and/or friends?
4-year Schools 2-year Schools
Never 34% 37%
One time 10% 10%
Two Times 13% 13%
Three Times 10% 10%
Four Times 8% 7%
Five Times 6% 6%
Six Times 3% 3%
Seven Times 1% 1%
Eight or More Times 16% 13%
n=13791 n=17410

www.trelliscompany.org44
Q46: I always pay my bills on time.
4-year Schools 2-year Schools
Strongly Agree 34% 31%
Agree 40% 38%
Neutral 17% 18%
Disagree 8% 11%
Strongly Disagree 2% 3%
n=13605 n=17188
Q47: I follow a weekly or monthly budget.
4-year Schools 2-year Schools
Strongly Agree 13% 14%
Agree 35% 35%
Neutral 24% 25%
Disagree 22% 20%
Strongly Disagree 6% 6%
n=13595 n=17160
Q48: I have the ability to manage my finances well.
4-year Schools 2-year Schools
Strongly Agree 16% 16%
Agree 45% 43%
Neutral 25% 25%
Disagree 12% 12%
Strongly Disagree 3% 4%
n=13598 n=17167
Q49: I worry about being able to pay my current monthly expenses.
4-year Schools 2-year Schools
Strongly Agree 18% 19%
Agree 34% 34%
Neutral 22% 23%
Disagree 18% 16%
Strongly Disagree 7% 7%
n=13593 n=17160
Q50: I worry about having enough money to pay for school.
4-year Schools 2-year Schools
Strongly Agree 33% 27%
Agree 33% 33%
Neutral 14% 18%
Disagree 13% 14%
Strongly Disagree 7% 7%
n=13597 n=17193
Q51: I know how I will pay for college next semester.
4-year Schools 2-year Schools
Strongly Agree 16% 16%
Agree 40% 40%
Neutral 21% 22%
Disagree 15% 14%
Strongly Disagree 7% 7%
n=13595 n=17174
Q52: It is important that I support my family financially while in college.
4-year Schools 2-year Schools
Strongly Agree 15% 24%
Agree 22% 28%
Neutral 30% 28%
Disagree 22% 14%
Strongly Disagree 12% 7%
n=13586 n=17176
Q53: The cost of college is a good investment for my financial future.
4-year Schools 2-year Schools
Strongly Agree 25% 33%
Agree 41% 40%
Neutral 24% 21%
Disagree 7% 4%
Strongly Disagree 3% 2%
n=13589 n=17173
Q54: I know how to keep myself from spending too much.
4-year Schools 2-year Schools
Strongly Agree 22% 22%
Agree 50% 49%
Neutral 16% 16%
Disagree 10% 10%
Strongly Disagree 2% 3%
n=13388 n=16949
Q55: I know where to find the advice I need to make decisions
involving money.
4-year Schools 2-year Schools
Strongly Agree 16% 18%
Agree 43% 43%
Neutral 20% 20%
Disagree 17% 14%
Strongly Disagree 5% 5%
n=13376 n=16916

www.trelliscompany.org 45
Q56: Food Assistance - Since January 1, 2022, have you used public
assistance in the following areas?
4-year Schools 2-year Schools
Yes 12% 22%
No 85% 75%
I don’t know 3% 3%
n=13202 n=16694
Q57: Unemployment Assistance - Since January 1, 2022, have you used
public assistance in the following areas?
4-year Schools 2-year Schools
Yes 2% 3%
No 96% 95%
I don’t know 2% 2%
n=13190 n=16673
Q58: Housing Assistance - Since January 1, 2022, have you used public
assistance in the following areas?
4-year Schools 2-year Schools
Yes 3% 4%
No 95% 93%
I don’t know 2% 2%
n=13195 n=16674
Q59: Utility Assistance - Since January 1, 2022, have you used public
assistance in the following areas?
4-year Schools 2-year Schools
Yes 4% 7%
No 94% 90%
I don’t know 2% 3%
n=13190 n=16668
Q60: Medical Assistance - Since January 1, 2022, have you used public
assistance in the following areas?
4-year Schools 2-year Schools
Yes 17% 29%
No 80% 67%
I don’t know 3% 4%
n=13190 n=16679
Q61: Child Care Assistance - Since January 1, 2022, have you used public
assistance in the following areas?
4-year Schools 2-year Schools
Yes 2% 3%
No 96% 94%
I don’t know 2% 2%
n=13182 n=16657
Q62: Credit Card - Since January 1, 2022, have you used the following
borrowing sources?
4-year Schools 2-year Schools
Yes 52% 54%
No 46% 45%
I don’t know 2% 2%
n=13122 n=16600
Q63: Pay Day Loan - Since January 1, 2022, have you used the following
borrowing sources?
4-year Schools 2-year Schools
Yes 5% 7%
No 91% 91%
I don’t know 4% 2%
n=12930 n=16372
Q64: Auto Title Loan - Since January 1, 2022, have you used the following
borrowing sources?
4-year Schools 2-year Schools
Yes 5% 7%
No 91% 90%
I don’t know 4% 3%
n=12904 n=16351
Q65: Since January 1, 2022, approximately how many times did you use a
credit card for something you didn’t have money for?*
4-year Schools 2-year Schools
Never 27% 19%
One Time 6% 6%
Two Times 9% 9%
Three Times 9% 10%
Four Times 7% 9%
Five Times 7% 8%
Six Times 4% 5%
Seven Times 1% 2%
Eight or More Times 30% 35%
n=6864 n=8857
*Of respondents who answered ‘yes’ to Q62

www.trelliscompany.org46
Q66: I always pay my credit card bill on time.*
4-year Schools 2-year Schools
Strongly Agree 42% 38%
Agree 37% 38%
Neutral 10% 11%
Disagree 8% 10%
Strongly Disagree 3% 4%
n=6836 n=8818
*Of respondents who answered ‘yes’ to Q62
Q67: I fully pay o my credit card balance each month.*
4-year Schools 2-year Schools
Strongly Agree 25% 18%
Agree 20% 16%
Neutral 14% 14%
Disagree 23% 28%
Strongly Disagree 18% 24%
n=6828 n=8799
*Of respondents who answered ‘yes’ to Q62
Q68: Since January 1, 2022, approximately how many times did you
borrow a pay day loan?*
4-year Schools 2-year Schools
One time 34% 27%
Two Times 22% 21%
Three Times 17% 16%
Four Times 10% 9%
Five Times 4% 6%
Six Times 3% 4%
Seven Times 1% 2%
Eight or More Times 10% 16%
n=527 n=1001
*Of respondents who answered ‘yes’ to Q63
Q69: Since January 1, 2022, approximately how many times did you
borrow an auto title loan?*
4-year Schools 2-year Schools
One time 83% 83%
Two Times 10% 10%
Three Times 3% 2%
Four Times 1% 1%
Five Times 0% 0%
Six Times 0% 0%
Seven Times 0% 0%
Eight or More Times 2% 3%
n=473 n=888
*Of respondents who answered ‘yes’ to Q64
Q70: Since January 1, 2022, approximately how many times did you sell
your belongings to make ends meet (like at a pawn shop, online
marketplace, over social media, etc.)?
4-year Schools 2-year Schools
Never 66% 61%
One time 8% 8%
Two Times 9% 9%
Three Times 7% 7%
Four Times 3% 4%
Five Times 2% 3%
Six Times 1% 1%
Seven Times 0% 0%
Eight or More Times 4% 5%
n=13064 n=16497
Q71: I have more student loan debt than I expected to have at this point.*
4-year Schools 2-year Schools
Strongly Agree 29% 26%
Agree 32% 27%
Neutral 20% 22%
Disagree 15% 18%
Strongly Disagree 5% 7%
n=6134 n=4267
*Of respondents who indicated having a student loan they took out for themselves
(‘yes’ to Q24)

www.trelliscompany.org 47
Q72: How confident are you that you will be able to pay o the debt
acquired while you were a student?*
4-year Schools 2-year Schools
Not At All Confident 28% 29%
Somewhat Confident 45% 42%
Confident 20% 19%
Very Confident 7% 10%
n=6118 n=4257
*Of respondents who indicated having a student loan they took out for themselves
(‘yes’ to Q24)
Q73: When you first received your student loan, did you receive any in-
person or online counseling that informed you about your student
loans?*
4-year Schools 2-year Schools
Yes, online 41% 47%
Yes, in-person 6% 6%
I did not receive counseling 44% 37%
I don’t know 10% 10%
n=6126 n=4267
*Of respondents who indicated having a student loan they took out for themselves
(‘yes’ to Q24)
Q74: The amount of total debt (e.g. credit card debt, car loan debt, or
money owed to family or friends) I have right now is manageable.
4-year Schools 2-year Schools
Strongly Agree 8% 8%
Agree 30% 28%
Neutral 19% 19%
Disagree 15% 15%
Strongly Disagree 8% 9%
I Do Not Have Other Debt 21% 20%
n=12838 n=16229
Q75: How confident are you that some or all of your student loans will be
forgiven?*
4-year Schools 2-year Schools
Not At All Confident 44% 43%
Somewhat Confident 41% 40%
Confident 10% 11%
Very Confident 5% 6%
n=6060 n=4218
*Of respondents who indicated having a student loan they took out for themselves
(‘yes’ to Q24)
Q76-Q77: Patient Health Questionnaire-2 (PHQ-2)*
4-year Schools 2-year Schools
Major Depressive Disorder - Likely 36% 36%
Major Depressive Disorder - Negative 64% 64%
n=12770 n=16132
*A full description of scales used and how they are calculated can be found in the
methodology section
Q78-Q79: Generalized Anxiety Disorder 2-item Scale (GAD-2)*
4-year Schools 2-year Schools
Generalized Anxiety Disorder - Likely 46% 46%
Generalized Anxiety Disorder - Negative 54% 54%
n=12756 n=16116
*A full description of scales used and how they are calculated can be found in the
methodology section
Q76: Having little interest or pleasure in doing things - Over the last 14
days, how often have you been bothered by?
4-year Schools 2-year Schools
Not at all 30% 31%
Several days 39% 38%
More than half the days 17% 17%
Nearly every day 13% 14%
n=12764 n=16110
Q77: Feeling down, depressed, or hopeless - Over the last 14 days, how
often have you been bothered by?
4-year Schools 2-year Schools
Not at all 34% 35%
Several days 37% 37%
More than half the days 17% 15%
Nearly every day 12% 13%
n=12750 n=16085
Q78: Feeling nervous, anxious, or on edge - Over the last 14 days, how
often have you been bothered by?
4-year Schools 2-year Schools
Not at all 19% 21%
Several days 38% 36%
More than half the days 21% 20%
Nearly every day 23% 23%
n=12746 n=16095

www.trelliscompany.org48
Q79: Not being able to stop or control worrying - Over the last 14 days,
how often have you been bothered by?
4-year Schools 2-year Schools
Not at all 29% 29%
Several days 34% 33%
More than half the days 18% 17%
Nearly every day 20% 21%
n=12731 n=16069
Q80: Does your school have mental health or counseling services
available for students?
4-year Schools 2-year Schools
Yes 77% 50%
No 2% 3%
I don’t know 21% 47%
n=12778 n=16141
Q81-Q86: Six-Question USDA Food Security Scale (30-Day)*
4-year Schools 2-year Schools
High or Marginal Food Security 52% 56%
Low Food Security 24% 22%
Very Low Food Security 24% 22%
n=12517 n=15705
*A full description of scales used and how they are calculated can be found in the
methodology section
Q81: The food that I bought just didn’t last and I didn’t have money to get
more (in the last 30 days).
4-year Schools 2-year Schools
Often 9% 10%
Sometimes 30% 28%
Never True 55% 55%
I don’t know 6% 7%
n=12730 n=16069
Q82: I couldn’t aord to eat balanced meals (in the last 30 days).
4-year Schools 2-year Schools
Often 17% 16%
Sometimes 29% 28%
Never True 49% 50%
I don’t know 5% 6%
n=12709 n=16046
Q83: In the last 30 days, did you ever cut the size of your meals or skip
meals because there wasn’t enough money for food?
4-year Schools 2-year Schools
Yes 39% 35%
No 57% 60%
I don’t know 4% 5%
n=12711 n=16025
Q84: How many days did this happen? (Skipped or cut size of meals due
to money)*
4-year Schools 2-year Schools
Fewer than 3 days 21% 20%
Three or more days 63% 61%
I don’t know 16% 19%
n=4904 n=5642
*Of respondents who answered ‘yes’ to Q83
Q85: In the last 30 days, did you ever eat less than you felt you should
because there wasn’t enough money for food?
4-year Schools 2-year Schools
Yes 35% 32%
No 59% 62%
I don’t know 5% 6%
n=12602 n=15858
Q86: In the last 30 days, were you ever hungry but didn’t eat because there
wasn’t enough food?
4-year Schools 2-year Schools
Yes 30% 26%
No 65% 69%
I don’t know 5% 5%
n=12703 n=16035
Q87: Does your school have a food pantry or food closet on campus?
4-year Schools 2-year Schools
Yes 44% 39%
No 8% 4%
I don’t know 47% 57%
n=12686 n=16011

www.trelliscompany.org 49
Q88: Have you visited a food pantry, on or o campus, since
January 1, 2022?
4-year Schools 2-year Schools
Yes 12% 14%
No 83% 81%
I don’t know 5% 5%
n=12681 n=16014
Q89: Please select the type(s) of food pantries you have visited since
January 1, 2022:
4-year Schools 2-year Schools
On-campus food pantry or food closet
at my school 67% 60%
O-campus food pantry or food bank
(e.g., at a church, non-profit organization,
regional food bank, etc.) 39% 52%
Other 6% 5%
n=1710 n=2530
*Of respondents who answered ‘yes’ to Q88
Q90-Q95: Housing Security Scale (Prior 12 Months)*
4-year Schools 2-year Schools
Housing Secure 60% 53%
Housing Insecure 40% 47%
n=12653 n=15974
*A full description of scales used and how they are calculated can be found in the
methodology section
Q90: I had diculty paying for my rent (past 12 months).
4-year Schools 2-year Schools
True 23% 26%
False 71% 67%
I don’t know 6% 6%
n=12642 n=15958
Q91: I didn’t pay the full amount of my rent (past 12 months).
4-year Schools 2-year Schools
True 8% 13%
False 87% 81%
I don’t know 5% 6%
n=12631 n=15917
Q92: I had diculty paying the full amount of a gas, oil, or electricity bill
(past 12 months).
4-year Schools 2-year Schools
True 24% 32%
False 71% 63%
I don’t know 5% 5%
n=12627 n=15924
Q93: I moved 3 or more times (past 12 months).
4-year Schools 2-year Schools
True 5% 6%
False 92% 92%
I don’t know 2% 2%
n=12632 n=15933
Q94: I lived with others beyond the expected capacity of my house or
apartment (past 12 months).
4-year Schools 2-year Schools
True 8% 11%
False 89% 85%
I don’t know 3% 4%
n=12636 n=15920
Q95: I moved in with other people due to financial problems (past 12
months).
4-year Schools 2-year Schools
True 14% 17%
False 84% 80%
I don’t know 3% 3%
n=12635 n=15916
Q96-Q105: Homelessness Scale*
4-year Schools 2-year Schools
No Indication of Homelessness 87% 84%
Homeless 13% 16%
n=12653 n=15983
*A full description of scales used and how they are calculated can be found in the
methodology section
Q96: Since starting college, have you ever been homeless?
4-year Schools 2-year Schools
Yes 4% 6%
No 96% 93%
I don’t know 1% 1%
n=12638 n=15956

www.trelliscompany.org50
Q97: I was thrown out or forced out of my home (in past 12 months).
4-year Schools 2-year Schools
True 3% 5%
False 96% 94%
I don’t know 1% 1%
n=12590 n=15905
Q98: I was evicted from my home (in past 12 months).
4-year Schools 2-year Schools
True 1% 2%
False 98% 97%
I don’t know 1% 1%
n=12585 n=15890
Q99: I stayed in a shelter, transitional housing, or independent living
program (in past 12 months).
4-year Schools 2-year Schools
True 1% 2%
False 98% 98%
I don’t know 1% 1%
n=12589 n=15893
Q100: I stayed in an abandoned building (in past 12 months).
4-year Schools 2-year Schools
True 0% 1%
False 99% 98%
I don’t know 1% 1%
n=12565 n=15870
Q101: I didn’t know where I would sleep at night (in past 12 months).
4-year Schools 2-year Schools
True 2% 4%
False 97% 95%
I don’t know 1% 1%
n=12567 n=15876
Q102: I didn’t have a home (in past 12 months).
4-year Schools 2-year Schools
True 3% 5%
False 96% 94%
I don’t know 1% 1%
n=12579 n=15881
Q103: I temporarily stayed with a relative, friend, or couch surfed while I
looked for housing (in past 12 months).
4-year Schools 2-year Schools
True 10% 13%
False 89% 87%
I don’t know 1% 1%
n=12586 n=15886
Q104: I slept in an outdoor location such as a street, sidewalk, or alley, bus
or train stop (in past 12 months).
4-year Schools 2-year Schools
True 1% 1%
False 98% 98%
I don’t know 1% 1%
n=12584 n=15880
Q105: I slept in a closed area/space not meant for human habitation
such as a car or truck, van, RV, or camper, encampment or tent, or
unconverted garage, attic, or basement (in past 12 months).
4-year Schools 2-year Schools
True 3% 4%
False 97% 95%
I don’t know 1% 1%
n=12588 n=15889
BNI_ Any Basic Needs Insecure - identified as either food insecure and/or
housing insecure and/or homeless.
4-year Schools 2-year Schools
Yes 60% 60%
No 40% 40%
n=12712 n=16068
BNI_ FH Basic Needs Insecure - identified as both food insecure and
housing insecure
4-year Schools 2-year Schools
Yes 28% 31%
No 72% 69%
n=12612 n=15854
BNI_ All Basic Needs Insecure - identified as food insecure, housing
insecure, and homeless
4-year Schools 2-year Schools
Yes 9% 11%
No 91% 89%
n=12664 n=15976

www.trelliscompany.org 51
Q106: Do you have a car?
4-year Schools 2-year Schools
Yes 77% 79%
Sometimes 3% 4%
No 19% 17%
n=12576 n=15894
Q107: How reliable would you say your car is?*
4-year Schools 2-year Schools
Very Reliable 49% 43%
Reliable 33% 35%
I Don’t Know 0% 1%
Somewhat Reliable 16% 19%
Not At All Reliable 2% 2%
n=9702 n=12523
*Of respondents who answered ‘yes’ to Q106
Q108: Parking is available on campus when I need it.
4-year Schools 2-year Schools
Never 9% 1%
Rarely 16% 2%
Sometimes 21% 7%
Often 19% 17%
Always 23% 62%
Not applicable 13% 11%
n=9698 n=12522
*Of respondents who answered ‘yes’ to Q106
Q109: Do you use public transportation to get to school?
4-year Schools 2-year Schools
Never 58% 73%
Rarely 8% 5%
Sometimes 8% 4%
Often 4% 1%
Always 8% 3%
Not applicable 13% 13%
n=12565 n=15898
Q110: Have you ever missed class due to lack of reliable transportation?
4-year Schools 2-year Schools
Never 55% 63%
Rarely 19% 14%
Sometimes 12% 9%
Often 3% 2%
Always 1% 1%
Not applicable 12% 12%
n=12536 n=15808
Q111-Q113: Financial Knowledge Questions*
4-year Schools 2-year Schools
Zero Questions Correct 19% 20%
One Question Correct 19% 23%
Two Questions Correct 28% 29%
Three Questions Correct 33% 28%
n=12485 n=15738
*A full description of scales used and how they are calculated can be found in the
methodology section
Q111: Imagine that the interest rate on your savings account is 1% per year
and inflation is 2% per year. After 1 year, would you be able to buy
more than today, exactly the same as today, or less than today with
the money in this account?
4-year Schools 2-year Schools
More Than Today 6% 7%
Exactly The Same As Today 11% 12%
Less Than Today (correct answer) 53% 48%
I don’t know 31% 33%
n=12512 n=15788
Q112: Suppose you have $100 in a savings account and the interest rate
was 2% per year. After 5 years, how much would you have in the
account if you left the money to grow?
4-year Schools 2-year Schools
More Than $102 (correct answer) 62% 58%
Exactly $102 6% 7%
Less Than $102 6% 6%
I don’t know 26% 28%
n=12493 n=15765

www.trelliscompany.org52
Q113: Suppose you borrowed $5,000 to help cover college expenses for
the coming year. You can choose to repay this loan over 10 years,
20 years, or 30 years. Which of these repayment options will cost
you the least amount of money over the length of the repayment
period?
4-year Schools 2-year Schools
10-Year (correct answer) 61% 59%
20-Year 5% 5%
30-Year 13% 14%
I don’t know 21% 22%
n=12512 n=15780
Q114: Are you the first person in your immediate family to attend college?
4-year Schools 2-year Schools
Yes 33% 38%
No 66% 60%
I don’t know 1% 2%
n=12526 n=15811
Q115: Are you a current or former member of the U.S. Armed Forces,
Reserves, or National Guard?
4-year Schools 2-year Schools
Yes 4% 4%
No 96% 96%
n=12524 n=15797
Q116: Have you ever transferred from one institution to another?
4-year Schools 2-year Schools
Yes 34% 28%
No 64% 70%
I don’t know 1% 2%
n=12511 n=15781
Q117: Do you plan on transferring from your school to another institution
in the future?
4-year Schools 2-year Schools
Yes 9% 51%
No 73% 29%
I don’t know 18% 19%
n=12510 n=15793
Q118: About how many hours do you spend in a typical 7-day week
providing care for dependents (children, parents, etc)?*
4-year Schools 2-year Schools
Less than 20 hours 55% 50%
20-39 hours 17% 17%
40 or more hours 29% 33%
n=3335 n=6563
*Of respondents who indicated supporting family members financially (‘Yes’ to any of
Q37-Q41)
Q119: Approximately how many days of classes did you miss last semester
[Spring 2022] due to lack of child care?
4-year Schools 2-year Schools
None 62% 59%
One to two days 13% 13%
Three to five days 8% 8%
More than five days 5% 5%
Not applicable - I was not enrolled in
Spring 2022 12% 16%
n=1841 n=4400
*Of respondents who answered ‘Yes’ to Q37
Q120: If you were to lose access to your current child care arrangement(s),
would you (check all that apply):
4-year Schools 2-year Schools
Need to take fewer classes or drop classes 31% 36%
Be less likely to enroll in future semesters 23% 29%
Have less time to focus on studying
and academics 40% 43%
Be likely to get worse grades 32% 33%
Consider bringing your child(ren) to classes 19% 20%
None of the above 47% 41%
n=3517 n=8858
*Of respondents who answered ‘Yes’ to Q37
Q121: At any time since you turned 13, were you in foster care or were you
a dependent of the court?
4-year Schools 2-year Schools
Yes 1% 3%
No 97% 95%
I don’t know 1% 2%
n=12489 n=15738

www.trelliscompany.org 53
Q122: Did you indicate on the FAFSA (Free Application for Federal Student
Aid) that you were previously in foster care or a ward of the state?*
4-year Schools 2-year Schools
Yes 58% 59%
No 30% 26%
I don’t know 12% 16%
n=149 n=421
*Of respondents who answered ‘Yes’ to Q34 and ‘Yes’ to Q121
Q123: Did you receive increased funding/support as a result of identifying
yourself as a former foster youth on the FAFSA?*
4-year Schools 2-year Schools
Yes 23% 20%
No 50% 47%
I don’t know 28% 33%
n=149 n=421
*Of respondents who answered ‘Yes’ to Q34 and ‘Yes’ to Q121 and Q122
Q124: Does your state have a state-level, foster youth-specific financial aid
program or policy for college?*
4-year Schools 2-year Schools
Yes 21% 22%
No 12% 8%
I don’t know 67% 69%
n=171 n=482
*Of respondents who answered ‘yes’ to Q121
Q125: Have you participated in the state-level, foster youth-specific
financial aid program or policy for college?*
4-year Schools 2-year Schools
Yes 47% 52%
No 32% 32%
I don’t know 21% 16%
n=36 n=104
*Of respondents who answered ‘yes’ to Q121 and Q124
Q126: Does your institution have a foster youth-specific financial aid,
scholarship, or outreach program?*
4-year Schools 2-year Schools
Yes 21% 14%
No 10% 10%
I don’t know 69% 76%
n=167 n=470
*Of respondents who answered ‘yes’ to Q121
Q127: Have you participated in your institution’s foster youth-specific
financial aid, scholarship, or outreach program?*
4-year Schools 2-year Schools
Yes 66% 68%
No 28% 25%
I don’t know 6% 8%
n=36 n=67
*Of respondents who answered ‘yes’ to Q121 and Q126
Q128: Do you consider yourself a student who works or a worker that goes
to school?*
4-year Schools 2-year Schools
Student 75% 55%
Worker 25% 45%
n=8557 n=10944
*Of respondents who answered ‘Yes’ to Q23
Q129: During the school year, about how many hours do you spend in a
typical 7-day week working for pay?*
4-year Schools 2-year Schools
Less than 20 hours 26% 12%
20-39 hours 42% 40%
40 or more hours 32% 47%
n=8176 n=10558
*Of respondents who answered ‘Yes’ to Q23
Q130: Are you a dependent or independent student?
4-year Schools 2-year Schools
Dependent 45% 32%
Independent 43% 55%
I don’t know 12% 13%
n=12489 n=15753
Q131: Where do you currently live?
4-year Schools 2-year Schools
On-campus residence 27% 3%
O-campus college/university-
aliated residence 7% 4%
O-campus private (not college/university-
aliated) residence 61% 80%
No current residence or homeless 0% 1%
Other 4% 11%
n=12501 n=15758

www.trelliscompany.org54
Appendix C: Endnotes
1 United States Department of Agriculture (USDA). (2021). What is food security?
https://www.ers.usda.gov/topics/food-nutrition-assistance/food-security-in-the-us/measurement.aspx
2 Ibid.
3 Crutchfield, R., & Maguire, J. (2017). Researching basic needs in higher education: Qualitative and quantitative
instruments to explore a holistic understanding of food and housing insecurity. https://www.calstate.edu/impact-of-
the-csu/student-success/basic-needs-initiative/Documents/researching-basic-needs.pdf
4 United States Department of Housing and Urban Development (HUD). (2018). Measuring housing insecurity in the
American Housing Survey. https://www.huduser.gov/portal/pdredge/pdr-edge-frm-asst-sec-111918.html
5 Broton, K. M. (2017). The evolution of poverty in higher education: Material hardship, academic success, and policy
perspectives (Unpublished doctoral dissertation). University of Wisconsin–Madison, Madison, Wisconsin.
6 Federal Student Aid (FSA). (2022). Student homelessness question. Student Homelessness Question | Federal
Student Aid
7 Cornett, A. (2023). Inside the college mental health crisis: Evidence from the Healthy Minds Study. Trellis
Company. Retrieved from: https://www.trelliscompany.org/wp-content/uploads/2023/03/Research-Brief_Mar23_
MentalHealthCrisis.pdf
8 Fletcher, C., Webster, J., Cornett, A., Niznik, A., Gardner, T., and Kna, C. (2022). Student Financial Wellness Survey
report: Fall 2021. Trellis Company. https://www.trelliscompany.org/wp-content/uploads/2022/11/SFWS-Report-
Fall-2021.pdf
9 MDRC. (2023). Ohio Programs Based on CUNY’s Accelerated Study in Associate Programs (ASAP) Boost Earnings
During the Pandemic. https://www.mdrc.org/news/press-release/ohio-programs-based-cuny-s-accelerated-study-
associate-programs-asap-boost
10 Hyken, S. (2016). How eective Is Net Promoter Score (NPS)? Forbes Magazine.
https://www.forbes.com/sites/shephyken/2016/12/03/how-eective-is-net-promoter-score-nps/#253a33123e4c
11 United States Department of Agriculture (USDA). (2021). What is food security?
https://www.ers.usda.gov/topics/food-nutrition-assistance/food-security-in-the-us/measurement.aspx
12 Ibid.
13 Crutchfield, R., & Maguire, J. (2017). Researching basic needs in higher education: Qualitative and quantitative
instruments to explore a holistic understanding of food and housing insecurity. https://www.calstate.edu/impact-of-
the-csu/student-success/basic-needs-initiative/Documents/researching-basic-needs.pdf
14 Baker-Smith, C., Coca, V., Goldrick-Rab, S., Looker, E., Richardson, B., & Williams, T. (2020). #RealCollege 2020: Five
years of evidence on campus basic needs insecurity. https://tacc.org/sites/default/files/documents/2020-02/2019_
realcollege_survey_report.pdf
15 Lusardi, A. (2008). Financial literacy: An essential tool for informed consumer choice. Dartmouth College, Harvard
Business School, and NBER. https://www.nber.org/system/files/working_papers/w14084/w14084.pdf
16 Centers for Disease Control. (2021). Anxiety and depression: Household Pulse Survey.
https://www.cdc.gov/nchs/covid19/pulse/mental-health.htm
17 National HIV Curriculum. (2021). Patient Health Questionnaire-2 (PHQ-2).
https://www.hiv.uw.edu/page/mental-health-screening/phq-2
18 Centers for Disease Control. (2021). Anxiety and depression: Household Pulse Survey.
https://www.cdc.gov/nchs/covid19/pulse/mental-health.htm
19 National HIV Curriculum. (2021). Generalized Anxiety Disorder 2-item (GAD-2).
https://www.hiv.uw.edu/page/mental-health-screening/gad-2

