
Understanding the pandemic’s impact
on the aviation value chain
December 2022

Contents
INTRODUCTION 3
EXECUTIVE SUMMARY 4
ANNEX C: WACC ESTIMATES 23
This work is independent, reects the views of IATA and McKinsey, and has
not been commissioned by any business, government, or other institution.

3 Understanding the pandemic’s impact on the aviation value chain
Introduction
Since 2005, IATA and McKinsey & Company have jointly looked
at value creation across the aviation value chain. This analysis
examines the entire value chain, covering aircraft and engine
original equipment manufacturers (OEMs); lessors; airports;
air navigation service providers (ANSPs); ground handlers;
maintenance, repair, and overhaul (MRO) providers; catering
companies; airlines; global distribution systems (GDSs); and
freight forwarders. The value chain analysis presented here
excludes upstream value creation by oil companies. Given the
dierentiated nature of oil companies, prots attributed to
jet fuel production alone are not transparent. Hence, this has
been excluded.
While acknowledging the human toll the COVID-19 pandemic
has exacted, the focus here is on economic value creation,
dened as the dierence between the return on invested
capital (ROIC) and the weighted average cost of capital (WACC)
— thereby taking the lens of an investor. ROIC measures
the earnings available to pay debt and equity investors in
relation to the capital invested. The WACC can be seen as
the opportunity cost for the investor, as it is a measure of the
alternative return the investor could have had if the capital
were invested in an asset with a similar risk prole. The
dierence between the two indicates economic protability.
If the ROIC is greater than the WACC, then value is being
created. Conversely, if the ROIC is lower than the WACC, then
economic value is being lost.
This report covers 2020 and 2021 and deepens the
assessment of value creation by including a larger sample
of companies in each sector. COVID-19 led, and still leads,
to signicant loss of lives, and daily life has been upended
in countless ways. Businesses are aected in various ways
too. This report provides a starting point for understanding
performance pre-pandemic and during COVID-19, and aims
to inform the debate about how to enhance value creation and
eciency across the whole value chain. (For an analysis of
the aviation value chain in 2020, please see McKinsey’s article
Taking stock of the pandemic’s impact on global aviation).
First, the report investigates the longer-term performance of
the value chain. It then dives deeper by sector to understand
what drives that performance. Next, it assesses the value
chain dynamics and forces acting upon the airline sector
which help explain performance. It concludes by looking at
what could be done to enhance value creation in the value
chain going forward.

4 Understanding the Pandemic’s Impact on the Aviation Value Chain
Executive summary
The aviation value chain consists of a diverse set of sectors
in terms of size, structure and performance. Pre-pandemic,
the value chain as a whole generated an economic loss of
approximately USD 5 billion per year. Airlines consistently
were the weakest link across the value chain, generating an
economic loss of approximately USD 18 billion per year.
Amid lockdowns and travel restrictions, all sectors making up
the aviation value chain suered signicant losses in 2020 and
2021 - except for air cargo carriers and freight forwarders who
experienced yield increases given undersupply and sustained
demand. With economic losses of USD 175 billion in 2020 and
USD 104 billion in 2021, airlines showed the largest economic
losses during the pandemic. Of the other sectors, those with
greater shares of xed costs, such as airports, suered more
and saw less ROIC recovery in 2021 versus 2020 than those
with a more variable cost base, such as ground handlers.
The great disparity of returns across the value chain — where
some sectors match the most protable sectors globally, and
others are near the bottom of cross-sector performance —
existed long before the pandemic. Airlines' under-performance
has its roots in factors such as low entry and high exit barriers,
high sensitivity to external shocks, the fragmented nature of
the industry, and a more concentrated supplier landscape, to
name a few.
As the value chain is only as strong as its weakest link,
all sectors that make up the chain have an interest in one
another's ability to perform. To expand the value created for
all participants, value chain partners can consider various
mutually reinforcing steps. These include improving service
and reliability by working together across the value chain,
pursuing opportunities for greater data and insights sharing,
removing ineciencies in the value chain, working together
on decarbonization, collaborating to meet ever-changing
demand in customer segments, and enhancing resilience and
robustness.
Aviation makes a signicant economic contribution to
societies globally. By jointly working to enhance performance
across the value chain, all sectors should be able to generate a
a return to its investors beyond the minimum based on its risk
prole.

5 Understanding the pandemic’s impact on the aviation value chain
The aviation sector is impacted by all forms of macro-
economic, natural, and other shocks, rendering the
sector highly cyclical. Over time, the sector, and airlines
in particular, have accumulated considerable expertise in
crisis management. Those skills were in full display during
the pandemic, as airlines took full advantage of the new
opportunities in air cargo in innovative ways. Prior to the
pandemic, the Global Financial Crisis too brought greater
resilience to the industry, led by North America. In its wake,
airlines posted uninterrupted operating prots from 2010 to
2019 — a period that attracted considerable investor interest
to the airline industry. Protability was not uniform across
the airline industry, however, and was the highest in markets
with fewer infrastructure constraints, favorable regulatory
environments, and a greater openness to consolidation.
In spite of this period of consistent operating prots, the
airline sector did not produce economic returns dened as the
dierence between the return on invested capital (ROIC) and
the weighted average cost of capital (WACC) (Exhibit 1). In fact,
on this basis, airlines were consistently the weakest link across
the aviation value chain over the 2012-19 period (Exhibit 2).
Jet fuel prices uctuated signicantly between 2012 and
2019, with a low point of approximately USD 52 per barrel
in 2016 to a high point of USD 130 per barrel in 2012. As a
result, the fuel share of airline operating expenses uctuated
between 22% and 33% in this period. Airline sector ROIC
averaged approximately 6% during this period, versus 8% for
the oil & gas sector.
Pre-COVID-19, the air transport value chain generated an economic loss of USD ~5 billion p.a.
driven by large airlines losses
Average annual economic prot/loss by subsector, 2012-2019, USD Billion
1
Manufacturers
1. Based on invested capital excluding goodwill, extrapolated to total industry.
2. Computed as cumulative economic prot divided by cumulative sector revenue over the period.
3. Sector economic prot for lessors estimated based on sample economic prot as share of revenue and as share of eet value, the combination of which is expressed as a range.
2.2
1.9% ~0.1% 4.4% 3.0% 3.8% 5.1% 0.9% -2.4% 2.1% 8.5%
Lessors
3
(0.1) – 0.2
ANSP
1.0
Airports
4.6
0.6
1.5
0.3
2.0
0.7
Catering Ground MRO Airlines Freight
Forwarders
GDS/
Travel Tech
TOTAL
xx
Economic prot as share of revenue
2
, %
Source: McKinsey value chain modelling for IATA
(5.3) – (4.9)
(17.9)
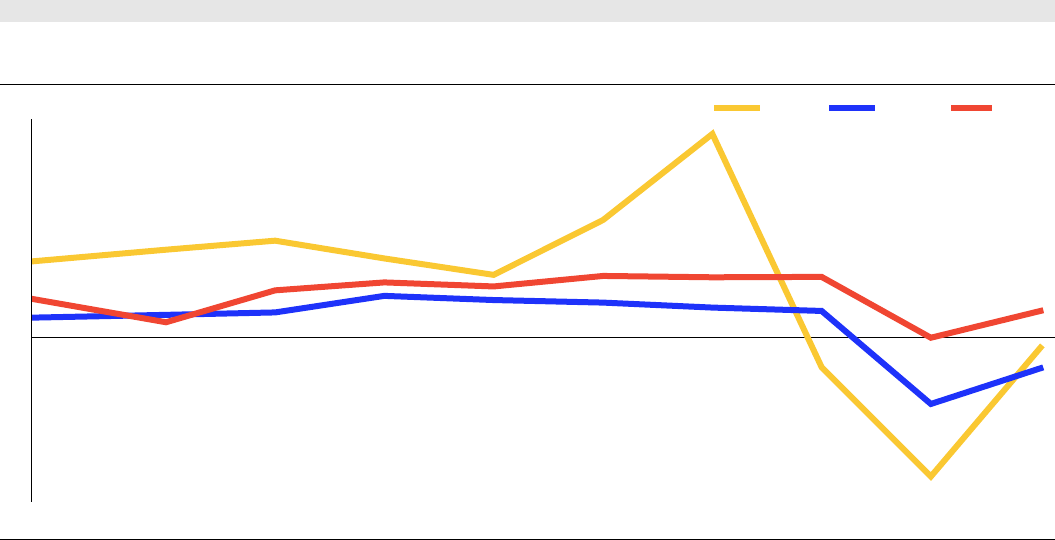
ROIC for the airline industry remained below WACC in pre-COVID-19 years;
worst ever result in 2020 with improvement in 2021
Airline industry ROIC excluding goodwill vs. median WACC, 1996-2021, %
ROIC excluding goodwill
10
8
6
4
2
0
1996 98 00 02 04 06 08 10 12 14 16 18 20 22
-2
-4
-6
-8
-10
-12
Median WACC
Source: McKinsey value chain modelling for IATA
Exhibit 1
Exhibit 2
Taking a step back:

6 Understanding the pandemic’s impact on the aviation value chain
Changes during the pandemic
Global airline trac (measured by revenue passenger
kilometers) declined by 66% in 2020, and by 58% in 2021,
compared to 2019, producing an economic loss of USD 244
billion in 2020 and USD 146 billion in 2021 across the value
chain (Exhibit 3). These are hyperbolic losses, considering that
in the best year for the value chain, 2015, economic prot was
limited to USD 12 billion for all sectors combined.
Amid lockdowns and travel restrictions, all aviation sectors
suered signicant losses in 2020 and 2021 — except for air
cargo carriers and freight forwarders where supply-demand
imbalances led to increases in yields, and value creation.
Sectors with greater shares of xed costs, such as airports,
suered more than those with a more variable cost base, e.g.,
ground handlers, while airlines lost the most.
ROIC improved across the value chain in 2021 compared
to 2020, and the rebound in terms of the degree of change
in ROIC diered materially by sector (Exhibit 4). Airports
rebounded the least compared to other aviation sectors in
2021, with ROIC improving by 0.9 percentage points. At the
other end of the spectrum, the manufacturers showed a
24.5 percentage point increase in ROIC. The other sectors
in the value chain saw their ROIC rise by between 5 and 10
percentage points, generally speaking. Nevertheless, all
sectors, except the freight forwarders, stayed in the red in
2021.
Jet fuel prices initially came down in 2020, from approximately
USD 80 per barrel in 2019 to USD 47 in 2020. But in 2021,
prices rebounded to USD 78, and the forecast average for
2022 is USD 126. Where airline sector ROIC came to -5.9% in
2021 as a result of the pandemic, the oil & gas sector reached
11.4%.
Exhibit 3
Exhibit 4
In 2021, all subsectors noted sizable economic losses – air cargo was the only bright spot
Economic prot/loss by subsector, 2021, USD Billion
1
Manufacturers
1.
Based on invested capital excluding goodwill, extrapolated to total industry.
2.
Computed as cumulative economic prot divided by cumulative sector revenue over the period.
(4.4)
-6.9% ~ -14% -9.3% -39.5% -12.6% -3.1% -2.7% -20.6% 5.8% -22.4%
Lessors
(4.9) – (4.6)
ANSP
(1.5)
Airports
(34.3)
(1.7)
(0.8)
(0.8)
6.8
(0.8)
Catering Ground MRO Airlines Freight
Forwarders
GDS/
Travel Tech
TOTAL
4.1
xx
Economic prot as share of revenue
2
, %
Source: McKinsey value chain modelling for IATA
(146)
(104.1)
ROIC change 2021 vs. 2020: OEMs and freight forwarders in the lead
Manufacturers
ROIC change 2021 vs. 2020
Percentage points
Change in economic prot 2021 vs. 2020
USD Billion
1. Change in ROE.
Source: McKinsey value chain modelling for IATA
Lessors
5.1
1
3.8
ANSP
5.1 2.0
Airports
0.9 4.7
Catering
4.7 0.3
Ground
10.7 2.8
MRO
7.9 1.2
Airlines
6.8 71.3
Freight Forwarders
16.8
3.8
GDS
8.5 0.4
24.5 7.7

7 Understanding the pandemic’s impact on the aviation value chain
Performance and recovery by sector
Airlines
The airline sector produced an economic loss of USD 175
billion in 2020 (10 times larger than the average annual value
destruction pre-pandemic) and USD 104 billion in 2021,
resulting in economic prot margins of -46% and -21%
respectively.
Plotting the economic prot of companies, ordered from low
performers to best performers, reveals a "power curve"
1
;
Power curves have tails that rise and fall at exponential rates,
with long atlands of middle-performing companies. Airlines'
power curves are, unsurprisingly, skewed to the negative.
The vast majority of airlines, 104 out of a sample of 111 in
2019, nd themselves in the middle atland or at the left
tail-end, again illustrating the general characterization of the
industry as one that is highly competitive and for the most
part producing slim margins. However, the power curve shows
that despite overall economic losses, there are always a small
number of airlines that do achieve a return above the cost
of capital (Exhibit 5). These airlines dier in composition, are
from dierent regions, and have dierent business models
— some are low cost and some follow a network business
model , and many have borrowed from each other and become
hybrid business models. The outperformance of these
airlines can be explained by the market context and carrier-
specic factors. For instance, some airlines may be active in
more mature markets where capacity growth is in line with
underlying demand growth. Others may exhibit excellence
in factors important for attracting customers or maximizing
asset productivity, such as ancillary sales, a unique network
portfolio, and operational excellence
2
.
Frequent yer programmes, too, can be a source of signicant
value for airlines. To illustrate, it is not uncommon for
large North American network carriers to generate annual
revenue of USD 3-5 billion through mileage sales to nancial
institution partners. This revenue stream has also proven to
be less volatile during the pandemic compared to passenger
revenues.
1
Martin Hirt, "Is your strategy good enough to move you up on the power curve?", McKinsey, January 30, 2018.
2
Jaap Bouwer, Alex Dichter, Vik Krishnan, and Steve Saxon, "The six secrets of protable airlines", McKinsey, June 28, 2022.
The airline industry power curve shows the large variation in performance by year
Airline industry economic prot power curve
1
, USD Million
2001
Airlines
Value creators
3,000
2,000
1,000
0
-2,000
-1,000
-3,000
-4,000
-5,000
-6,000
-7,000
2008 2015 2019 2021
1. Number of carriers by year diers, power curve lines stretched to make equal, i.e., lines show more the distribution than the actual number of airlines.
Source: McKinsey value chain modelling for IATA
Exhibit 5

8 Understanding the pandemic’s impact on the aviation value chain Performance and recovery by sector
Air cargo was a clear, and much-needed, area of relief during
the pandemic. In 2021, of the nine value-creating airlines in the
sample, seven had signicant or pure cargo operations. Global
air cargo tonnage was roughly 7% higher in 2021 than in 2019.
Airlines idled widebodies as long-haul passenger demand
evaporated given travel restrictions. Bellies of passenger
aircraft used on long-haul ights contribute around half of
global cargo capacity normally. Strong demand, coupled
with a sharp reduction in supply, led to cargo yields spiking.
Consequently, carriers more exposed to air cargo saw less of a
decline in ROIC, and several pure-play air cargo carriers began
to create value. Airlines with limited cargo activity saw the
greatest drop in ROIC in 2021 (Exhibit 6).
Low cost carriers (LCCs) outperformed network carriers in
terms of ROIC pre-pandemic (Exhibit 7). The traditional LCC
model focuses on shorter haul point-to-point travel, which
can reduce costs through higher aircraft utilization and a more
simplied aircraft eet. It also reduces cost through ying to
secondary airports, increased seat density, and greater online
distribution share, to name a few. During the pandemic, LCCs
performed worse however. An absence of air cargo may help
to explain this.
80
60
40
20
0
0 5 10 15 20 25 30 35 40 45 50 55 60 65 70 75 80 85 90 95 100
-20
-40
-60
Source: McKinsey value chain modelling for IATA
More cargo led to higher returns during the pandemic
ROIC
2021, ex goodwill and after tax, %
Network
Cargo revenue share
2021, %
Cargo Low cost
Exhibit 6
Exhibit 7
LCCs in sample performed better than network carriers pre-COVID-19, but worse during the pandemic
Network versus low cost carrier ROIC ex goodwill, weighted average, 2012-2021, %
6
8
10
12
4
2
0
-2
-4
2012 2013 2014 2015 2016 2017 2018
-6
-8
-10
-12
-14
-16
LCCNetwork
Source: McKinsey value chain modelling for IATA
Based on Sample: not Representative of Full Sector
2020
2019 2021

9 Understanding the pandemic’s impact on the aviation value chain Performance and recovery by sector
Airline performance diers signicantly by region (Exhibit8).
Pre-pandemic, North America was the only value-creating
region. This may have been due, in part, to a more
consolidated and mature market, with only moderate capacity
additions (Exhibit 9). The top-5 carriers' share of scheduled
seat capacity reached approximately 80% in North America
and ROIC performance was signicantly higher versus
other regions. Latin America, too, showed a higher degree
of consolidation, albeit not as high as North America. ROIC
performance in Latin America lagged North America driven, in
part, by greater capacity additions.
Exhibit 8
Exhibit 9
2020 2021
Pre-COVID-19, North America was the only region where airlines created value
Annual airline sector economic prot by region, 2012-2021, USD Billion
Middle East/Africa
-70
-65
-60
-55
-50
-45
-40
-35
-30
-25
-20
-15
-10
-5
0
2013 2014 2015 2016 2017 2018 2019
5
10
15
Latin America North America Asia Pacic Europe
Source: McKinsey value chain modelling for IATA
2012
North America showed most consolidation and best ROIC performance pre-pandemic
Top 5 airline group share of scheduled seats within region
1
versus airline ROIC ex goodwill by region, 2000-2021, %
70
80
90
100
60
50
40
30
20
00 05 10 15 00 05 10 15 00 05 10 15 00 05 10 15 00 05 10 15
10
0
-10
-20
-30
ROICTop 5 shareNumber of carriers per region
2
North America Latin America Europe Africa & Middle East Asia Pacic
Source: McKinsey value chain modeling for IATA; Diio mi
1.
North America seen as United States and Canada. Europe includes Turkey, Russia. Latin America includes Mexico.
2.
Per August 2022. Individual active carriers.
2020 2020 2020 2020 2020
xx
152 119 321 213 287

10 Understanding the pandemic’s impact on the aviation value chain Performance and recovery by sector
Airlines' largest operating cost component, jet fuel, showed
considerable volatility during the pandemic. After initially
dropping by approximately 40% year-on-year in 2020, prices
increased by around 70% in 2021 and by another 43% in 2022,
adding to cost pressure.
Given the historic impact of the pandemic on performance,
the airline sector took on signicant amounts of debt during
COVID-19 (Exhibit 10). Only one third of the debt taken on in
2020 was supported by governments, showing remarkable
access to credit markets in this time of crisis. Innovatively,
multiple airlines used their frequent yer programmes as
collateral to secure new loans.
Nonetheless, the additional debt burden has seen credit
scores move down several notches. The share of tracked
airlines with a C or D rating increased from 5% to 29%
between 2019 and 2021. The reduction in credit ratings could
on average lift the cost of funds by 1 percentage point and
add to the nancial challenges ahead (Exhibit 11).
The airline industry became signicantly more indebted during COVID-19
Estimated change in global airline sector debt, USD Billion
Debt 2019 Government
Loans
Deferred
Taxes
Government
Loans Guarantees
Bond issuance
(Secured, Unsecured
Convertible)
Commercial
Loans
Other
(Dip Loan, Loyalty,
Programme)
Debt 2020
58
14
28
78
39
8
Source: IATA
651
+51%
430
Government-sourced Capital markets-sourced
Exhibit 10
Exhibit 11
Credit ratings worsened signicantly during the pandemic
Airline industry distribution of credit ratings, share of S&P tracked airlines
1
, %
1. Sample size — 2019: 22, 2020: 23, 2021: 21.
Average of sample
AA-
A+
A
A-
BBB+
BBB
BBB-
BB+
BB
BB-
B+
B
B-
CCC+
CCC
CCC-
CC
C
D
0%
0%
0%
0%
14%
14%
9%
9%
9%
23%
14%
0%
5%
5%
0%
0%
0%
0%
0%
0%
0%
0%
0%
0%
0%
4%
0%
13%
9%
13%
13%
13%
13%
0%
0%
4%
0%
17%
0%
0%
0%
0%
0%
0%
5%
5%
14%
5%
19%
14%
10%
14%
5%
0%
0%
0%
10%
Source: S&P
Investment
Grade
Pre-COVID-19 (2019) 2020 2021
Junk
28%
5%
4%
34%
5%
29%

11 Understanding the pandemic’s impact on the aviation value chain Performance and recovery by sector
Airports and air navigation service providers
Airports generated around USD 4 to 5 billion in annual
economic prot between 2012-2019. Both airports' and
airlines' ROIC uctuated between 4% and 8%, but as airlines
bear more risk and have a higher WACC, they generated
economic losses over the same period
3
. If we were to exclude
North American airports which operate on a utility-like not-
for-prot basis, the airport ROIC globally is higher, varying as
a function of regulatory regimes and till structures as well as
revenues from non-aeronautical sources.
The pandemic drove airports' pre-COVID-19 positive ROIC of
around 6% into negative territory in 2020 and 2021. Airports
have broadly been more resilient than airlines in this respect
(Exhibit 12). Airports faced drops in aeronautical revenues and
passenger-related retail and services. Unsurprisingly, given the
depth of the crisis, many airports both needed and received
government support through COVID-19, which combined
with continued inows from real estate and other sources,
lessened the impact of the crisis.
ANSPs are mostly government-run, though private in countries
such as Canada and the United Kingdom. The sector is highly
fragmented at the macro level, with many individual ANSPs,
but highly concentrated at the local level, with typically one
ANSP covering one country.
The ANSP sector reported prots above WACC levels pre-
pandemic. ROIC for the sector was about 8% between 2012
and 2019 versus about 6% for airlines (Exhibit 12). ANSPs'
ROIC in 2020 and 2021 dropped to about -7% and -2%
respectively, given high xed costs and overheads, and the
reduced level of ight activity. In 2021, global scheduled ights
were down approximately 36% compared to 2019.
ANSP and airport returns compared to airlines
ROIC, excluding goodwill, 2012-2021, %
Airports
10
8
6
4
2
0
2012 2013 2014 2015 2016 2017 2018 2019
-2
-4
-6
-8
-10
-12
-14
AirlinesANSP
Source: McKinsey value chain modelling for IATA
20212020
Exhibit 12
3
McKinsey value chain modeling for IATA.
12 Understanding the pandemic’s impact on the aviation value chain Performance and recovery by sector
Original equipment manufacturers and lessors
The aircraft and engine OEM sector generated returns that
outperformed airlines pre-pandemic, earning a ROIC of about
16% between 2012 and 2019 (Exhibit 13). As the pandemic hit,
OEMs' ROIC fell to -26% in 2020 and -2% in 2021.
In 2020, global commercial aircraft orders were down 54% in
2019 but rebounded strongly by 154% year-on-year in 2021.
This led to a relatively strong improvement in performance
— albeit with negative economic prot — in 2021. Aircraft
manufacturing is a consolidated, global market where
companies also earn a return through after-market services.
Entry barriers are high given the capital needs for aircraft
programs and the considerable know-how and expertise
involved. Aircraft programs are complex and lengthy, and
some manufacturers have experienced production challenges
in recent years, which dented protability. There are some
relatively new entrants in the market, particularly those that
produce aircraft with fewer than 120 seats.
Lessors earned a return on equity of about 9% pre-pandemic.
In 2020, returns fell to approximately 0% as lease rates
plummeted and demand decreased. The leasing market
has high barriers to entry but is fairly fragmented. Some
consolidation has occurred, but new companies are entering
the market as well. It is a sector where there is value in
diversifying portfolios, to spread risk and tap into dierent
growth rates. There have been some defaults, and some
lessors underwent restructurings in recent years.
Lessors have seen their share of the commercial aircraft eet
grow over time. For narrowbody aircraft, the share of leased
aircraft globally increased from 42% in 2010 to 51% in 2022,
where for widebodies, the share grew from 27% to 35%. Over
that period, airlines turned increasingly to leasing and to sale-
and-leaseback solutions in order to limit equity requirements
and gain some exibility.
Overall, lessors bounced back strongly in 2021. The
sector roughly halved its economic loss in 2021 though
performance varies widely. Some airlines have renegotiated
and restructured leases, for example adopting power-by-the-
hour arrangements, especially those which went through a
bankruptcy or court-led restructuring. Still, the majority of
airlines have continued to pay leases, in some cases with a
restructuring or deferral of payments.
OEM and lessor returns compared to airlines
ROIC, excluding goodwill, 2012-2021, %
Lessors
1
25
30
35
40
20
15
10
5
0
2012 2013 2014 2015 2016 2017 2018
-5
-10
-15
-20
-25
-30
AirlinesOEMs
Source: McKinsey value chain modelling for IATA
20202019 2021
1. ROE.
Exhibit 13

13 Understanding the pandemic’s impact on the aviation value chain Performance and recovery by sector
Catering, ground handling and maintenance, repair
and overhaul
Pre-pandemic, the catering, ground handling, and MRO sectors
outperformed the airline sector consistently in terms of ROIC
(Exhibit 14). Ground handlers' ROIC was approximately 16%
between 2012 and 2019. When trac dropped in 2020, ROIC
fell to -7%. The sector recovered well compared to others in
terms of ROIC improvement in 2021. Ground handlers’
revenues are driven by passenger and freight volumes and
the sector has lower xed costs compared to other aviation
sectors.
The catering sector's ROIC was approximately 20% between
2012 and 2019. Catering faces similar passenger-variable
revenue streams and relatively low xed costs as the ground
handler sector, with labor representing a signicant share of
operating expenses. For both segments, the market at a global
level appears fragmented, but is more concentrated at a local
airport-specic level. There is ongoing consolidation activity.
The global passenger volume, as core driver of caterers'
revenue, fell by approximately 59% in 2020 and by 52% in
2021, versus 2019. Furthermore, long-haul passengers, who
generate more catering revenue, showed a greater reduction.
As a result, caterers' ROIC dropped to -21% in 2020 and -16%
in 2021.
MROs fared better in 2021 compared to 2020, with a ROIC
of 3% in 2021, up from -5% in 2020. At a global level, the
market is fairly fragmented, but there are geographical and
component-related niches where the landscape is more
concentrated. MROs exhibit large structural dierences by
type of maintenance. Base maintenance on the air frames
is mostly labor driven, with less dierentiation across rms,
where engine MRO is more concentrated and has signicant
OEM involvement. Line maintenance is highly fragmented
with little opportunity for dierentiation, but there can be local
market concentration. Barriers to entry overall are relatively
high given the technological know-how and certication
required.
Catering, ground handling and MRO returns compared to airlines
ROIC, excluding goodwill, 2012-2021, %
MRO
25
30
20
15
10
5
0
2012 2013 2014 2015 2016 2017 2018
-5
-10
-15
-20
-25
AirlinesGround servicesCatering
Source: McKinsey value chain modelling for IATA
2019 20212020
Exhibit 14
4
https://www.iata.org/en/iata-repository/publications/economic-reports/airline-industry-economic-performance---june-2022---data-tables.

14 Understanding the pandemic’s impact on the aviation value chain Performance and recovery by sector
Global distribution systems – Travel tech
Pre-pandemic, GDSs were the best performing sector in
the value chain on an economic margin basis, with ROIC
signicantly above the airline sector (Exhibit 15). There are
high entry barriers on the distribution side, given the need to
build out a global network of travel agencies and airlines. On
the IT side, the core system is the passenger service system
(PSS) which is mostly supplied by two organizations. This leads
to a highly concentrated industry. Many airlines continue
to depend on GDSs for broad reach in their distribution,
particularly for high-value corporate trac.
In 2020 and 2021 ROIC for the sector dropped signicantly,
to -16% and -8% respectively. The GDS sector’s prime
revenue source lies in segment-linked booking fees, but most
companies have evolved into travel software ecosystem
businesses that oer a broader array of services.
Through the pandemic, sales shifted towards online bookings
through the airline.com and mobile channels, particularly as
business-travel volumes were harder hit than leisure travel. To
illustrate, the share of airline direct supplier online bookings
in the United States increased from 50% in 2019 to 64% in
2021
5
, and globally from 39% to 48% (Exhibit 16).
Distribution will likely continue to be a dynamic sector as travel
recovers post-COVID-19. Airlines may retain some of the
direct distribution share even as international travel returns.
IATA's New Distribution Capability (NDC) is transforming
the way airlines distribute their products through GDS and
beyond, and could also potentially lead to new commercial
relationships.
5
PhocusWright US Airline Market Report 2021-25.
GDS – Travel tech returns compared to airlines
ROIC, excluding goodwill, 2012-2021, %
GDS — Travel tech
30
35
25
20
15
10
5
2012 2013 2014 2015 2016 2017 2018
0
-5
-10
-15
-20
Airlines
Source: McKinsey value chain modelling for IATA
2019 20212020
Exhibit 15
Exhibit 16
During COVID-19 a larger share of bookings went through direct/online channels
Breakdown of airline gross bookings by channel, global, share of bookings, % and USD Billion
OTA Online supplier direct Oine
Source: PhocusWright
100% =
10%
451
2010
23%
67%
2011
513
10%
25%
64%
2012
534
11%
27%
63%
2013
548
11%
28%
60%
2014
555
12%
30%
58%
2015
522
12%
32%
56%
2016
528
13%
34%
54%
2017
570
13%
35%
51%
2018
619
14%
37%
49%
2019
631
14%
39%
46%
2020
206
17%
43%
40%
2021
282
18%
48%
35%

15 Understanding the pandemic’s impact on the aviation value chain Performance and recovery by sector
Cargo airlines and freight forwarders
Cargo was the only bright spot for the value chain in 2020 and
2021 (Exhibit 17). Of the nine airlines that were value creating
in 2021, seven had signicant or fully cargo-driven operations.
Going forward, cargo yields are expected to remain elevated,
and come down gradually as more belly capacity is reinstated.
Freight forwarders play an important role in air freight, with
approximately 80% of air cargo volumes being handled by
this sector. It is a fragmented sector, with the top companies
accounting for around 35% of sector revenue, but there is
consolidation activity. Freight forwarding has a highly variable
cost base and started out as an asset-light business. As the
industry developed, the need increased to develop more
sophisticated IT and oer, amongst others, tracking systems.
Most forwarders now oer certain logistics services as
well – warehousing and consolidation, for instance. Larger
players dierentiate themselves through sales and support
infrastructure globally to service larger shippers, and can
secure access to airline capacity at preferential terms. Thus,
over time, the sector has become harder to enter.
That said, forwarders are still exible businesses, with high
capital turnover. The average revenue per invested dollar of
capital was approximately USD 4.1, versus USD 0.9 for the
airline sector in 2019. During 2012 to 2019, freight forwarder
ROIC averaged approximately 16%. As protability is linked
with air cargo volumes and freight rates, performance
improved signicantly during the pandemic, with ROIC moving
to 22% in 2020 and 39% in 2021.
Freight forwarder and cargo carrier returns compared to airlines
ROIC, excluding goodwill, 2012-2021, %
35
40
30
25
20
15
10
2012 2013 2014 2015 2016 2017 2018
5
0
-5
-10
-15
2019 20212020
Source: McKinsey value chain modelling for IATA
1.
Full freighter pure play carriers only.
Pure cargo carriers
1
AirlinesFreight forwarders
Exhibit 17

16 Understanding the pandemic’s impact on the aviation value chain
Value chain dynamics
There is a great disparity of returns across the air transport
value chain, where some links in the chain can be compared to
the most protable industries in other sectors, and other links
struggle to keep up with the utilities sector (Exhibit 18). Airlines
in particular have underperformed, and this has its roots in
several factors: low entry and high exit barriers, a high share
of xed costs, high sensitivity to external demand shocks,
a fragmented industry, and a more concentrated supplier
landscape, to name a few. This creates a highly challenging
environment and has to led to uneven distribution of prots
across the value chain.
The degree of global fragmentation, measured here through
the share of sector revenue accounted for by the top 5
companies, diers signicantly between sectors, as does the
degree to which sectors compete globally. With some sectors,
such as airports, ground handlers and caterers, the global
degree of fragmentation can dier from the local picture at a
particular city.
Performance across the aviation value chain compared to other sectors over the past 20 years
Economic prot margin quartile range by industry
1
, ex goodwill, 2002-2021, select industries, %
1.
Data set includes global top 5000 companies by market cap in 2021, excluding insurance and banks.
2.
Indicative and for entire industry. Top 5 share will dier based on segments within industries (e.g., Chemicals consists of many dierent sub-industries, not all chemicals players are active in
all). OEMs: top 5 OEM share of 2019 value of produced aircraft. Lessors: top 5 lessor share of leased eet value Q4 2021. Airports: top 5 airport group revenue share out of total 2019
market size. Catering: top 5 caterer share of 2019 total market revenue. Ground: top 5 share of 2019 market revenue. Airlines: top 5 airline group revenue share out of total 2019 industry
revenue. Freight Forwarders: top 5 air forwarder revenue share. All other sectors: share of top 5 2021 as share of total revenue in sector based on global top 5000 companies by market cap.
Median
Number of rms in sample Aviation value chain industry Quartile range
Telecom
Media
Medical Technology
GDSs — Travel Tech
Pharma & Biotech
Apparel, Fashion & Luxury
High Tech
Business Services
Consumer Packaged Goods
Consumer Services
Advanced Electronics
ANSPs
Consumer Durables
In-Flight Catering
Ground Handlers
Chemicals
Freight Forwarders
Retail
Automotive & Assembly
Aircraft — Engine OEMs
Logistics & Trading
Aircraft MROs
Basic Materials
Conglomerates
Utilities
Oil & Gas
Aircraft Lessors
Airlines
Airports
Source: McKinsey Corporate Performance Analytics; Cirium; Value Chain Model; Company reports; Airports Council International; Teal
-15 -10 -5 0 5 10 15 20
68
133
16
151
196
47
397
8
67
8
204
192
8
219
13
6
43
11
530
59
244
105
371
63
260
4
155
133
93
12%
25%
36%
31%
25%
NA
16%
19%
36%
99%
26%
39%
35%
19%
19%
63%
59%
NA
16%
43%
20%
21%
36%
45%
30%
100%
51%
38%
42%
xx
Top 5 company share, global
2
xx%
Exhibit 18

17 Understanding the pandemic’s impact on the aviation value chain Value chain dynamics
In 2011, IATA worked with Harvard Business School’s
Professor Michael Porter to examine the forces acting
upon the airline sector and their inuence on the sector’s
protability. Exhibit 19 illustrates Porter’s framework with
updated content.
More than a decade since this research, and after the largest
crisis the sector has ever seen, the question arises whether
these forces have truly changed. The answer is likely no.
Bargaining power of suppliers continues to be high. The
threat of substitutes remains, and in fact increased during the
pandemic given the surge in availability, acceptance, and use
of online meeting tools.
Barriers to entry remain relatively low and barriers to exit high.
COVID-19 saw an uptick in airline start-ups. In 2019, 42 airlines
began service, followed by 57 in 2021. New entrants were
attracted into a sector by the availability of cheaper second-
hand aircraft and leases, and availability of skilled pilots. There
were also few bankruptcies through COVID-19. Barriers to
exit remained high with various carriers receiving life support
from their stakeholders. COVID-19 did not result in as large a
reduction in carriers as may have been expected. In 2019, 59
airlines ceased operations, and this number decreased to 53
in 2020, and 33 in 2021.
Price transparency has increased further with the rise of online
travel agents and metasearch comparison websites. On the
supplier side, the strength of labor remains — with signicant
unionization. Airport privatization has continued.
Additionally, all aviation sectors operate in a highly regulated
environment. This not only relates to safety, but also to
economic performance. Most countries have ownership limits
in place for airlines, capping foreign ownership of local airlines,
for instance to 25% in the US and 49% in Europe. This has the
eect of limiting the free ow of capital and adding a barrier to
cross-border consolidation. As such, airlines do not operate in
a policy vacuum.
Competitive forces shaping the airline sector have arguably not changed or have intensied
Degree of change observed in competitive forces for the airline sector since 2011
1
Force intensied, greater competitive pressureNo change in dynamicForce reduced, lower competitive pressure
Source: McKinsey and IATA update based on original from Professor Michael Porter, 2011
1.
In 2011 this ve forces analysis was originally done by Michael Porter for IATA.
Threat of substitute products or
services: MEDIUM and RISING
Rivalry among existing competitors:
HIGH
Threat of new entrants:
HIGH
Bargaining power of channels:
HIGH
Bargaining power of buyers:
HIGH
Bargaining power of suppliers:
HIGH
Powerful labor unions especially
when controlling operations at
network hubs
Aircraft and engine producers are
both concentrated oligopolies
Airports are mostly local
monopolies
Airport services (handling,
catering, cleaning) are also
concentrated in a small number of
rms, but low switching costs
The number of customers who can
aord air travel is increasing
substantially, mainly in emerging
markets
Te chnology for web-conferencing
is improving
High speed trains are competitive
with airlines on select short-haul
routes
Travel can be delayed, limited or
done without
Environmental issues challenge air
travel
Growth has been rapid but volatile
Perishable product
Limited product dierentiation
High sunk costs per aircraft, low
marginal costs per passenger
Limited economies of scale
Signicant exit barriers
Multiple direct and indirect rivals
Limited incumbency advantages
Low switching costs
Some demand-side benets of
scale
Easy access to distribution
channels
High concentration among GDS
and aggregator websites
Websites increase price
transparency
Tra vel agents focus on the
interests of corporate buyers to
reduce travel costs
Buyers are fragmented
Air travel perceived as a
standardized product
Low switching costs for most
customers
Price sensitive, because travel is a
meaningful share of discretionary
spending
Exhibit 19

18 Understanding the pandemic’s impact on the aviation value chain
While we focus on economic value in this report, aviation
provides signicant value in other forms. Worldwide, pre-
COVID-19, aviation enabled 4.5 billion passengers to take
to the air, creating new connections and reuniting families.
Aviation supported around 88 million jobs directly, and
accounted for just over 4% of global economic activity.
Aviation generates positive externalities, especially for
countries and cities which are home to major aviation hubs,
while providing an essential service in locations with poor
connectivity to the global economy, and often life-saving
services during the pandemic.
The sectors making up the aviation value chain each
contribute to the total economic value added. The airline
sector is at the center of the value chain and its revenue ows
(Exhibit 20).
The airline sector remains a highly challenging industry where
shareholders are not rewarded with the minimum return they
should expect based on the risk prole of their investment.
The aviation value chain was negatively impacted by the
pandemic — and airlines fared the worst. However, even
before the pandemic, airlines were the only value chain sector
where investors did not get a return above the cost of capital
over a prolonged period.
What could be done to strengthen the value chain for
everyone? Companies across the value chain could consider
various actions to enhance the performance of the value chain
as a whole, and ensure nancial sustainability for all. To the
extent that the chain is only as strong as its weakest link, all
actors have an interest in one another’s ability to perform.
Expanding the value created by all value chain participants
Exhibit 20
Illustrative ow of revenues within the aviation value chain
Passengers
Freight forwarders
Source: McKinsey
Indicative revenue ows within the aviation sector, 2019, USD Billions
Cargo shippers
Airlines
Travel agents
OEMs Lessors Oil companies Airports ANSPs Handlers, caterers
379
118 44 190 99 21 53
246 20
81
43

19 Understanding the pandemic’s impact on the aviation value chain Expanding the value created for all value chain participants
Improving service and reliability by working together
across the value chain, thus attracting more customers
Individual companies across the value chain are customers
and suppliers to companies in other aviation sectors, and
together they are partners in the fullment of the customer
journey. There is an opportunity for greater value chain
collaboration to enhance the experience for customers,
thereby improving the results for all involved. Examples could
include joint mapping of full customer journeys, including
current challenges and where these occur, involving all sectors
that inuence the customer journey so it can be improved
holistically, rather than by one party at a time. If the value
chain can work together to improve reliability and comfort
throughout the journey, demand could rise.
As the value chain participant who contracts directly with
the passenger, airlines are at the center of the customer
relationship. However, airlines rely on airports, handlers,
caterers and others to bring the journey to completion
(Exhibit 21). Delays are a signicant source of frustration for
customers, and the responsibility for them is shared across
the value chain. Airlines are responsible for, amongst others,
aircraft turnarounds between ights, technical and crew
performance. However, delays are often under the purview of
air trac control, security, and airport conditions, in addition to
the weather, the eects of which could sometimes be reduced
with corrective action by the airports or the national aviation
administration. Ensuring that security checks are smooth,
frees up time for passengers to spend in the airports, boosting
retail. Swift baggage reclaim helps make a passenger’s onward
journey hassle-free. Enhanced collaboration can only bring
benets to all parts of the value chain who depend upon the
passengers airlines y.
Airlines do not own the full end-to-end customer journey — cooperation required to optimize customer experience
Not airline ownedAirline partially ownedAirline owned
Journey
Sub-journey
Customer
follow-ups
Post-trip
IROPS
1
recovery
Entertainment
In-ight
Seating
and aircraft
conguration
Refreshments
and meals
IROPS
1
mitigation
Research
ight
Shop
& Purchase
Purchase
ight
Desire/Need
Travel
Inspiration
Research
destination
Promotions
Transport
To Airport
Parking
IROPS
1
early
communication
Loyalty
programs
Lifestyle
Engagement
Partnerships
Credit cards
Check bags
Airport
Experience
Security
Airport
navigation
Shop and dine
Wait at gate
IROPS
1
recovery
Deplaning
Arrival
and On-trip
Immigration
Connections
Baggage
claim
Customs
Transport
Research
destination
Prepare
to travel
Book other
(car, hotel…)
Arrange
travel
documents
Pack
Make
departure
arrangements
Check-in
for ight
Source: McKinsey
1.
IROPs are Irregular Operations, i.e. extraordinary situations in which a ight does not operate as scheduled.
Exhibit 21

20 Understanding the pandemic’s impact on the aviation value chain Expanding the value created for all value chain participants
Pursuing opportunities for greater data and insights
sharing across the value chain
Companies within the value chain are starting to put the
data-rich environment in which they operate to greater use
by, for instance, using advanced data techniques to provide
more tailored oers to customers, or to engage in predictive
maintenance. Beyond this, there is an opportunity for greater
sharing of data and insights across the value chain. This could
include enhanced data sharing between airlines, airports,
and handlers about expected volumes — leading to better
short-term projections and enhanced operational planning
at airports. Initiatives such as airport collaborative decision-
making (A-CDM) could be further rolled out to enhance joint
performance of the value chain and the passenger experience.
A-CDM's focus lies on improving the eciency and resilience
of airport operations by encouraging airlines, airports,
handlers and ANSPs to collaborate more and to exchange
accurate and timely data and insights.
Removing ineciencies in the value chain
Tackling ineciencies could enhance performance for the
whole chain. For example, longer than necessary ight paths
within regions lead to air trac control (ATC) ineciencies,
additional fuel burn, and associated climate impact. The
European ATC body Eurocontrol indicates that ights in
Europe use, on average, between 9% and 11% more fuel than
the most ecient ight routes. Improvement initiatives, such
as Europe's Single European Sky, can help address these
ineciencies, boost protability, and reduce CO
2
emissions
for all participants in the value chain.
Working together on decarbonization
Decarbonization is the prime challenge at this time. Moving
the airline industry to net zero by 2050 requires signicant
innovation and value chain cooperation, potentially through
novel forms of collaboration. Sustainable aviation fuel (SAF)
will play a major role in airlines’ path to net-zero operations but
announced supply does not equal expected demand.
Decarbonization is a challenge that will require the value chain
working together to solve. The industry needs fuel suppliers
to invest in capacity — likely backed with commitments from
airlines and with support and incentives from governments.
Airports need to develop a new fueling infrastructure, must
decarbonize their own operations, and give passengers
low-carbon onward ground transport choices. Handlers and
caterers need to work with their host airports, to electrify and
improve energy eciency. Airframe and engine OEMs need
to develop ever-cleaner technologies such as hydrogen-
powered ight. ANSPs must innovate to reduce emissions on
conventional ights, while adapting regulations to permit new
forms of transport, such as eVTOL services.
The investment needed is signicant, and it will take everyone
working together to get aviation to net zero.
Collaborating to meet ever-changing demand
in customer segments
Airlines and their value chain partners face ever-changing
patterns of customer demand and do adapt their business
models to such evolutions. The more a market matures, the
more dierentiated demand tends to become. Certain trends
might have been accelerated because of the pandemic.
To be sure, working from home has impacted the entire
transportation sector in multiple ways. For airlines, this has
spread out demand for ights over the week in many cases.
Much speculation abounds regarding business travel in the
post-COVID-19 world, but the jury is still out on whether
lowered demand will be anything but transitory.
On the other hand, business travelers might opt more often
for economy-class travel, certainly on shorter ights. Leisure
travelers have been seen to chose business class for their
holiday trips. Hence, there is a uidity among market segments
and demand morphs constantly along the spectrum from the
ultra-low-cost option to rst-class travel and private jets.
In response to changing customer demand, airline business
models have become much more hybrid. Today, few airlines
are "pure" in the original sense of the terms "low-cost" or
"network” carriers, as both have borrowed from each other
and adapted their oering. It is vital for customer-welfare
maximization that the regulatory environment fosters
competition, innovation, and sustainability, not only in aviation
but across all modes of transportation. Consumers will then
optimize their choices and the transportation sector will be
more ecient
6
.
Enhancing resilience and robustness
Airlines have proved to be resilient, having bounced back, for
the most part, from the multiple crises the world has seen
since the inception of the industry. What arguably is less of
a feature among airlines is robustness, i.e. the ability to avoid
falling over in the rst place. Robustness can be enhanced
through creating more diverse revenue streams, in addition
to the habitual attention to costs. This might involve vertical
and horizontal integration when that is possible, maybe even
beyond the aviation value chain. Achieving robustness likely
necessitates discipline in terms of capacity expansion, and
a strengthening of alliances and collaboration among the
airlines. In essence, the goal must be not only to grow, but to
grow protably and sustainably, in order to limit the impacts
of various crises on the airline industry and the aviation value
chain.
6
"One Size does not Fit All: A Study of how Airline Business Models have evolved to meet Demand in Europe", IATA, November 2022.

21 Understanding the Pandemic’s Impact on the Aviation Value Chain
Conclusion
Aviation provides signicant benets to the
broader economy. Pre-pandemic, the aviation
value chain overall did not generate the
economic returns its investors expect. This
was led primarily by the large economic losses
of the core sector, airlines, which remain in
a challenging market structure and context.
COVID-19 led to signicant value loss for all
sectors, apart from cargo-focused ones.
As aviation emerges from the pandemic, there is
an opportunity to expand the value created for
all participants in the value chain. This requires
performance improvement within each sector
and also requires greater collaboration and
fresh ways of working across partners in the
value chain.

22 Understanding the pandemic’s impact on the aviation value chain
Annex A:
Annex B:
Denitions
1.
PP&E =Property, Plant & Equipment; includes Right of use asset post IFRS16/ASC842 implementation.
2.
EBITA = Earning before Interest, Taxes and goodwill Amortization.
ROIC
Invested capital
Source: McKinsey value chain modelling for IATA
Denitions
‘Return on invested capital’ (ROIC) measures the operating
performance of the company
Calculation excludes goodwill
(= amount paid over book value in an acquisition)
Invested capital (IC) represents the amount invested in the
operations of the business
Adjusted for operating leases (if applicable)
Calculation methodology
ROIC = NOPLAT/end of year operating invested capital
Used end of year values to avoid discrepancies due to M&A, perimeter or
accounting changes
IC = Operating working capital + net PP&E
1
+ net other operating assets
Before lease accounting change (IFRS16/ASC842): Operating leases
capitalized using 7.3x factor, in line with industry practices (typically 7-8x);
post accounting change RoU asset included in PP&E
NOPLAT
After tax operating prot, adjusted for operating leases NOPLAT = Adjusted EBITA
2
– Taxes
Taxes based on marginal tax rate, dierentiated per country
Before IFRS16/ASC842: prot is adjusted for leases (interest component of
lease expense added back to EBITA; assuming 7% interest rate)
Economic prot
“Excess prot” earned above the cost of capital,
expressed in USD million p.a.
Economic prot spread
Economic prot margin
= (ROIC-WACC) * Invested Capital
= ROIC-WACC
= Economic Prot/Revenues
WACC
Opportunity cost of funds invested
WACC = Cost of equity * equity weight
+ (after tax) Cost of Debt * debt weight
Example ROIC calculation — illustrative carrier
Local currency millions
Source: McKinsey value chain modelling for IATA
1.
Adjusted for operating leases, including goodwill.
2.
Capitalization multiple: 1/(1/Depreciation period + Cost of lease).
3.
For companies reporting under IFRS16 or ASC842, no adjustment made to operating prot and capitalized leases replaced with published Right of Use Asset.
ROIC
1
, percent
Adjusted EBITA
1,4363.2
Reported EBIT(A): 16,323.2
Revenues
Invested capital
22,385.0
After tax
5.4%
Pretax
6.5%
Interest income from ST investment
Dividend income from ST investments
Gain on disposal of ST investments
Exchange loss
Currency hedging gain
Net gain on nancial assets
Lease adjustment
3
: Implied interest @ 7%
Debt equivalent: 4,973.4 (see below)
Includes operating cash: 326.5 (2% of sales)
Receivables, inventories, prepayments, deferred
accounts and other current assets: 2,067.5
Minus payables, sale in advance, deferred accounts
and current provisions: (7,075.3)
Intangibles (excl. goodwill), other LT assets
(excl. derivatives), net deferred accounts minus
operating provisions (return costs of leased aircraft,
onerous leases, other)
Marginal tax
rate: 17%
Capitalized leases
3
:
Net PPE:
Working capital:
Other:
Goodwill:
Adjustments:
1,067.1
348.1
4,973.4
22,176.3
(4,636.4)
(128.3)
184.4
48
679.7 aircraft lease expense
7.3x multiple (assumptions: 7% cost of lease,
15-year depreciation period)
2
(1.0)
(0.1)
(1.2)
77.6
(26.6)
(0.7)

23 Understanding the pandemic’s impact on the aviation value chain
Annex C:
It is important to note that the weighted average cost of capital (WACC) used in this analysis is the opportunity cost for investors.
It does not measure the actual cost of capital for the individual companies, but rather what ‘nancially minded’ investors would
expect to earn on an asset with similar risk characteristics.
To estimate WACC, the following formula is applied:
The cost of debt is the post-tax return on investing in the debt. The following formula is applied:
Cost of debt = (risk free rate + debt premium) × (1 − corporate tax rate).
It varies by company specic debt premiums (based on estimated credit risk) and by country specic marginal tax rates. As
noted above, this does not represent the actual cost of debt for individual companies, but rather the return an investor would
earn by investing in debt with that company/sector’s credit risk characteristics.
WACC methodology: Cost of equity
Market Risk Premium (MRP):
— MRP estimated each year to maintain (real) cost of equity around estimated long term average of 7%
— MRP = (7% + Expected ination) - Risk Free Rate
— Expected ination in year N based on actual ination for year N+1
Risk Free Rates (RF): Nominal year-end 10-year US rates for all airlines
— US government rate is the only ‘risk free’ rate; all calculations made in USD; consistent with MRP
— Value observed as of 31/12/xx
Asset Betas: Airline (0.80); Airport (0.55); ANSP (0.40); Catering (0.70); CRS (1.30); Freight Forwarders (0.80); Ground services (0.70); Leasing (1.10);
Maintenance (0.70); Manufacturers (1.10)
Debt Betas: Based on rating: AAA/BBB- (0.15); BB+/B+ (0.20); B/B- (0.25); CCC and below (0.30)
Target Debt/Equity (D/E), Airlines: Based on ratings; AAA/A- (60/40); BBB+/BBB- (67/33); BB+/BB- (71/29); B+/B- (75/25); CCC (80/20), CC/-D (82/18).
Estimate based on S&P credit ratios and observed values
Target Debt/Equity for other sectors: Airport (200%); ANSP (80%); Catering (50%); GDS (20%); Freight Forwarders (80); Ground services (50%);
Maintenance (20%); Manufacturers (15%)
4,5
1996 97 98 99
2000 01 02 03 04 05 06 07 08 09 10 11 12 13 14 15 16 17
18 19
20
2021
4,5
4,6
4,5
4,7
4,5
5,5 5,5
6,2
5,8
5,1
6,8
5,8
4,8
6,9
7,2
6,7
5,6
6,4
6,7
6,5
6,3
6,0
7,1
8,6
7,8
WACC methodology: Cost of debt
Risk Free Rate:
10-year US government rate
Tax Rates:
Marginal tax rates from the country of origin
Debt Premium
based on estimated credit rating:
Credit spread
: Last 5-year rolling average; estimated by multiplying observed credit spreads by adjustment factor (to take into account implied probability of default
for lower credit
s):
Credit rating:
Actual rating else, estimated based on nancial ratios:
Observed spreads: Dierence between yield to maturity for a basket of similarly rated 10-year company bonds (e.g., AAA, AA, A, BBB, etc.) and yield to maturity of
comparable 10-year government bond
Adjustment factor applied to BBB and below ratings, based on implied probability of default and expected loss rate
Capped for lower credit: highest possible spread is equal to MRP
Airlines: EBITDAR margin, Net Debt/EBITDAR, EBITDAR/Fixed charges, EBIT/Interest, Age of eet
Airports: EBITDA/Gross interest
Others: EBITDA/Gross interest or typical industry rating for all non rated companies
Nominal post-tax WACC = cost of equity × (1 − gearing) + cost of debt × gearing
where gearing = debt / (debt + equity).
The cost of equity is estimated using the standard Capital Asset Pricing Model (CAPM) and is equal to the risk free rate plus a
risk premium:
Cost of equity = risk free rate + re-leveraged equity beta × equity market risk premium
with re-leveraged equity beta = (asset beta − debt beta × gearing) / (1 − gearing).

24 Understanding the pandemic’s impact on the aviation value chain
Annex D:
Airlines
The airlines studied in the analysis represent approximately
85% of the global airline sector revenue pool. To compute
sector aggregates for ROIC and economic prot, the sample
of airlines studied is scaled up using its proportion of regional
sector revenues, and this is subsequently summed up to a
global estimate.
Companies included:
Europe North America Asia Pacic Rest of World
Aegean Airlines ABX Air, Inc. Air Astana Aerolineas Argentinas
Aer Lingus Air Canada Air China Aeromexico
Aeroot Air Transport Services Group (ATSG) Air India Air Arabia
Air Berlin (up to 2016) Alaska Air Air New Zealand Air Mauritius (up to 2018)
Air Europa Allegiant Travel AirAsia Avianca Holdings
Air France American Airlines AirAsia India Azul
Air Italy (up to 2018) Atlas Air Worldwide AirAsia X Comair Limited
AirBridgeCargo Cargojet Airways All Nippon Airlines COPA Holdings
Alitalia (up to 2015) Delta Airlines Asiana Egyptair
Austrian Airlines Evergreen International Airlines Bangkok airways El Al Israel Airlines
Blue Panorama Frontier Cathay Pacic Emirates
British Airways Hawaiian Cebu Pacic Ethiopian Airlines
Brussels Airlines Jetblue China Airlines Etihad (up to 2014)
Cargolux Kalitta Air China Eastern FlyDubai
Czech Airlines Mesa Airlines China Southern Airlines GOL Linhas Aereas Inteligent
Easyjet Polar Air Cargo EVA Airways Interjet
Finnair Republic Airways Garuda Indonesia Jazeera Airways
Flybe (up to 2017) Skywest Go First Kenya Airways
Iberia Southwest Airlines Hainan airlines Kuwait Airways
Icelandair Spirit Airlines Hong Kong Airlines LATAM
KLM United Airlines Indigo (Interglobe aviation) MiddleEast Airlines
LOT Polish Airlines US Airways Japan Airlines Oman Air (up to 2017)
Lufthansa Virgin America (up to 2015) Jet Airways (up to 2017) Qatar Airways
Norwegian Air Shuttle Westjet Juneyao Royal Air Maroc (up to 2018)
Pegasus Airlines Korean Airlines Royal Jordanian
Primera Air Scandinavia (up to 2017) Malaysian Airlines South African Airways (up to 2018)
Ryanair Nok Air Tunisair (up to 2017)
S7 airlines Pakistan International Airlines VivaAerobus
Scandinavian Airlines (SAS) Philippine Airlines Volaris
Swiss International Qantas
TAP Air Portugal Shandong Airlines
Turk Hava Yollari Shenzhen Airlines
Virgin Atlantic Airways SIA Group
Volotea Sichuan Airlines
Vueling Skymark
Wizz Air Spicejet
WOW Air (up to 2017) Spring Airlines
Sri Lankan airlines
Thai Airways
Vietjet Air
Vietnam Airlines
Virgin Blue/Virgin Australia
Vistara

25 Understanding the pandemic’s impact on the aviation value chain Annex: Companies included in the analysis
Airports
The airports studied in the analysis represent between 30%
and 40% of the global airport sector revenue pool. To compute
sector aggregates for ROIC and economic prot, the sample
of airports studied is scaled up using its proportion of regional
sector revenues, and this is subsequently summed up to a
global estimate.
Companies included:
Europe North America Asia Pacic Rest of World
Aena Atlanta Airports Corporation of Vietnam ACSA
Aéroport de Beauvais-Tillé Chicago Midway Airports of Thailand Aeropuerto de Tocumen
Aéroport de Bordeaux - Mérignac Chicago O'Hare Angkasa Pura I Aeropuertos Argentina 2000 (up to 2014)
Aéroport de Lyon-Saint-Exupéry Dallas Fort Worth Angkasa Pura II Corporacion America Airports
Aéroport de Nice-Côte d'Azur Denver Auckland International Airport Grupo Aeroportuario del Centro Norte (OMA)
Aéroport de Toulouse-Blagnac Las Vegas Airport Beijing Capital International Airport Grupo Aeroportuario del Pacíco (GAP)
Aeroport Marseille Provence Los Angeles World Airports Changi Grupo Aeroportuario del Sureste (ASUR)
Aeroporti di Roma San Francisco Airport Chongqing Airport Group Guayaquil Airport (up to 2014)
Aeroports de Paris Tampa Delhi Kenya Airports Authority
BAA/Heathrow Airport Holdings Toronto Guangzhou Baiyun International Airport ONDA
Flughafen Wien Hainan Meilan International Airport (Regal) Santiago de Chile (up to 2014)
Flughafen Zürich (Unique) Hangzhou International Airport
Fraport Hong Kong Airport
Kobenhavns Lufthavne Incheon
London Gatwick JATC
Malta International Airport Malaysia Airports Holdings
Munich airport Melbourne (APAC)
SAVE (Venezia) (up to 2016) Mumbai (up to 2014)
Schiphol Amsterdam Airport NanJing Lukou International Airport
Sheremetyevo Narita
TAV Havalimanlari Holding Shanghai International Airport (Hongqiao)
Toscana Aeroporti Shenzhen Airport Co.
Sichuan Province Airport Group
Sydney Airport
Xiamen International Airport Co.

26 Understanding the pandemic’s impact on the aviation value chain Annex: Companies included in the analysis
ANSPs
The ANSPs studied in the analysis represent approximately
USD 7 to 9 billion in revenue. To compute sector aggregates
for ROIC and economic prot, the sample analyzed is scaled
up using its proportion of estimated total sector revenue.
Companies included:
Lessors
The lessors studied in the analysis represent approximately
40% of estimated global lessor revenue. To compute sector
aggregates for ROE and economic prot (based on the
dierence between ROE and Cost of Equity), the sample
analyzed is scaled up using (a) its proportion of estimated total
sector revenue and (b) its proportion of estimated total sector
eet value.
Companies included:
OEMs
The aircraft and engine OEMs studied in the analysis represent
more than 90% of estimated global OEM revenue. To compute
sector aggregates for ROIC and economic prot, the sample
is scaled up using its proportion of estimated total sector
revenue.
Companies included:
MROs
The MROs studied in the analysis represent between 30% and
40% of estimated global MRO revenue. To compute sector
aggregates for ROIC and economic prot, the sample is scaled
up using its proportion of estimated total sector revenue.
Companies included:
Ground handlers
The ground handlers studied in the analysis represent
approximately 25% of estimated global handling revenue. To
compute sector aggregates for ROIC and economic prot,
the sample is scaled up using its proportion of estimated total
sector revenue.
Companies included:
Aerothai
Air Services
Airways Corporation of New Zealand
ATNS
CAAS
DFS Deutsche Flugsicherung
ENAIRE
ENAV
GKOVD - State Federal Unitary Enterprise ATM corp.
NATS
NavCanada
AerCap Holdings
Air Lease Corporation
Aircastle
Alafco
Aviation Capital Group
Avolon (to 2014)
AWAS (to 2016)
BOC Aviation
Boeing Capital (up to 2012)
China Aircraft Leasing Company
Dubai Aerospace Enterprise
FlyLeasing
ILFC (up to 2013)
Intrepid Aviation (up to 2014)
Nordic Aviation Capital
Willis Lease
Airbus Commercial
Boeing Commercial
COMAC
Embraer
Pratt & Whitney
Safran
AAR Corp
AirAsia Taiwan
AMECO
BBA Aviation
GAMECO
HAECO
Lufthansa Technik
SIAEC
Bangkok Aviation Fuel Services
BBA Aviation
Celebi Hava Servisi
Derichebourg/Penauille (up to 2012)
DNATA
GlobeGround Berlin (up to 2012)
Heathrow Airport Fuel Company
John Menzies
Korea Airport Service Co
Saigon Ground Services
SATS (ground handling)
Saudi Ground Services Company
World Fuel Services – Aviation

27 Understanding the pandemic’s impact on the aviation value chain Annex: Companies included in the analysis
Caterers
The caterers studied in the analysis represent between 30%
and 40% of estimated global caterer revenue. To compute
sector aggregates for ROIC and economic prot, the sample
is scaled up using its proportion of estimated total sector
revenue.
Companies included:
GDSs – Travel tech
The GDSs/travel tech players studied in the analysis represent
more than 90% of estimated global GDS revenue. To compute
sector aggregates for ROIC and economic prot, the sample
is scaled up using its proportion of estimated total sector
revenue.
Companies included:
Freight forwarders
The freight forwarders used in the analysis report a mixture
of contract logistics and freight forwarding revenues, which
in some cases has not been possible to split. Similar to other
sectors, ROIC and economic prot for the sector has been
estimated by scaling up estimates based on the sample, using
the share of global sector revenue.
Companies included:
Do & Co
Gate Group
Journey Group (up to 2015)
SATS (Catering)
Saudi Airlines Catering Company
Servair
Amadeus IT Group
Sabre Corporation
Travelport
Travelsky
Agility Public Warehousing Company
DSV Panalpina
Expeditors
Hellman Worldwide Logistics
Kintetsu World Express
Kuehne & Nagel International
Panalpina (up to 2018)
Uti Worldwide (up to 2014)

